Real Estate
Ranked: The Cities With the Most Bubble Risk in Their Property Markets
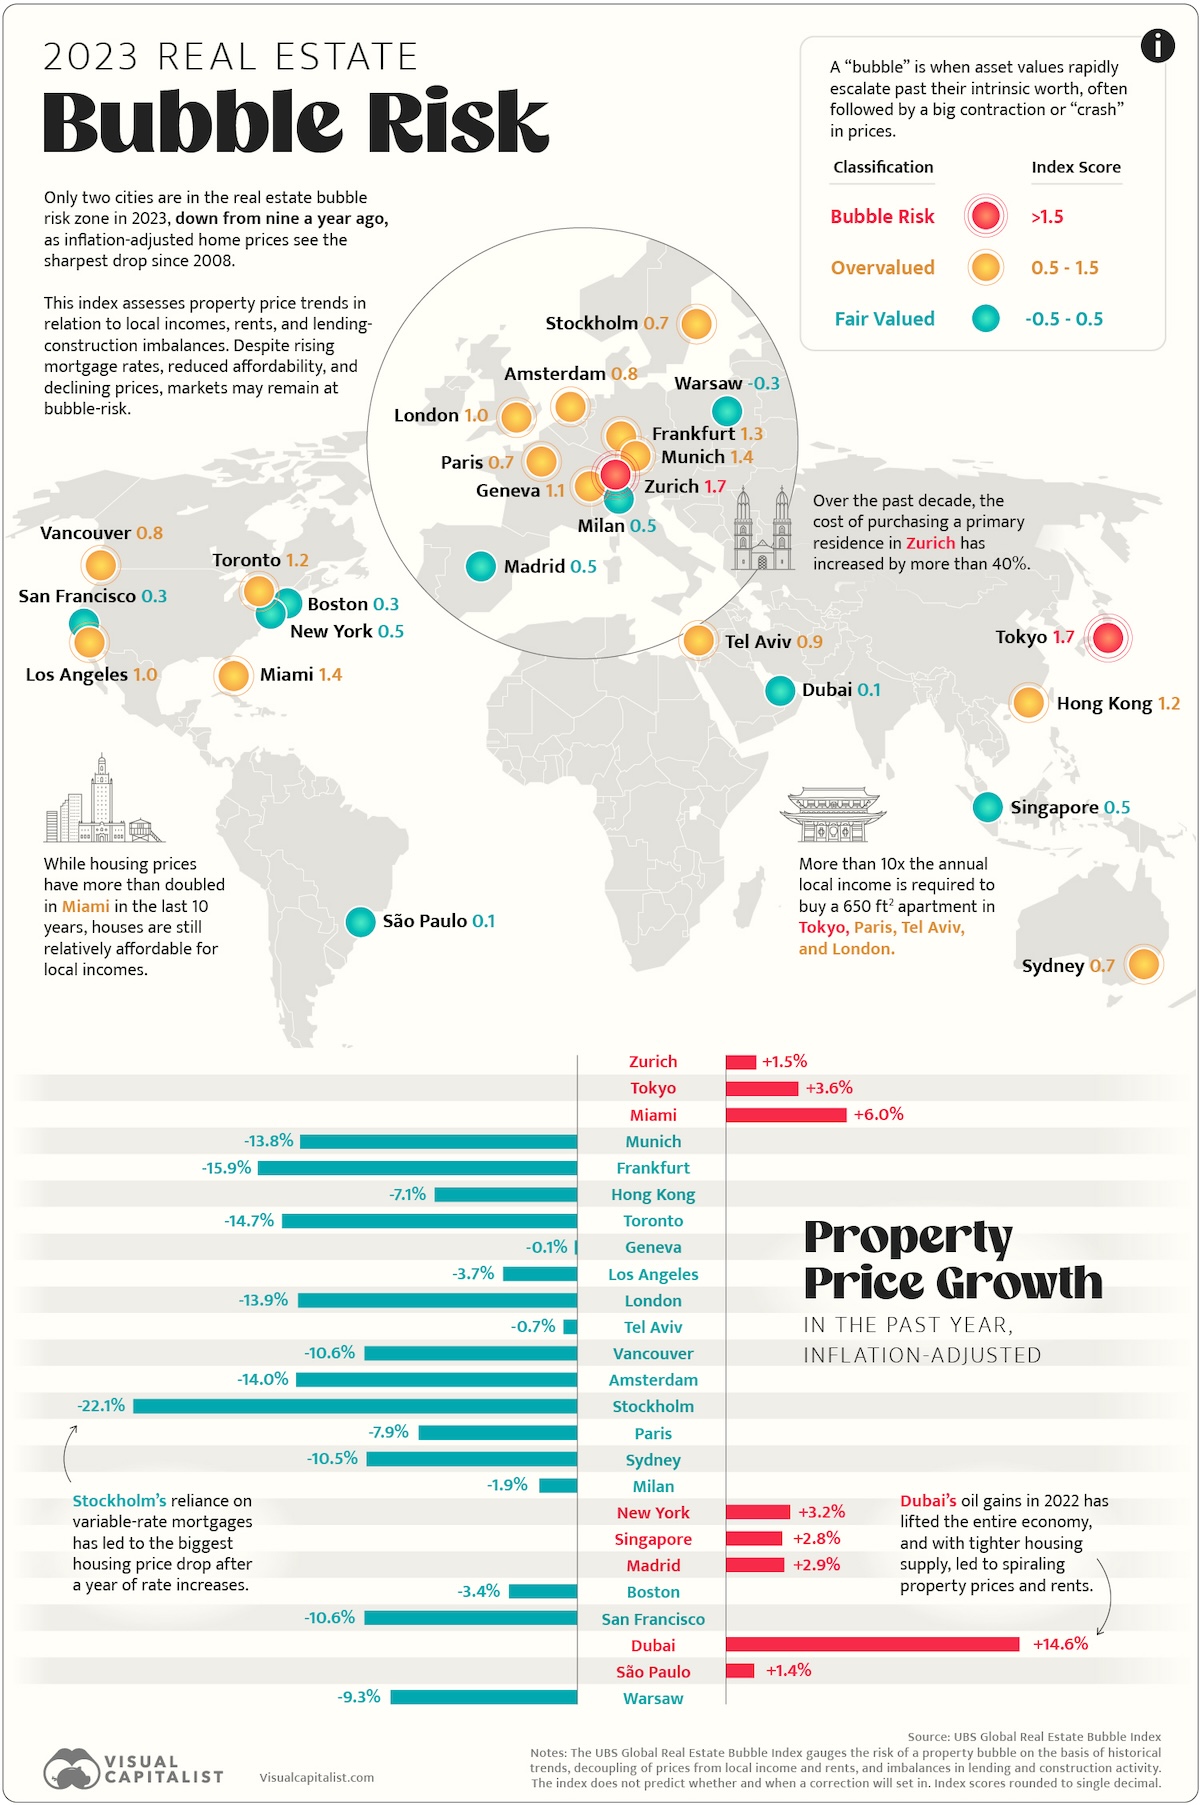
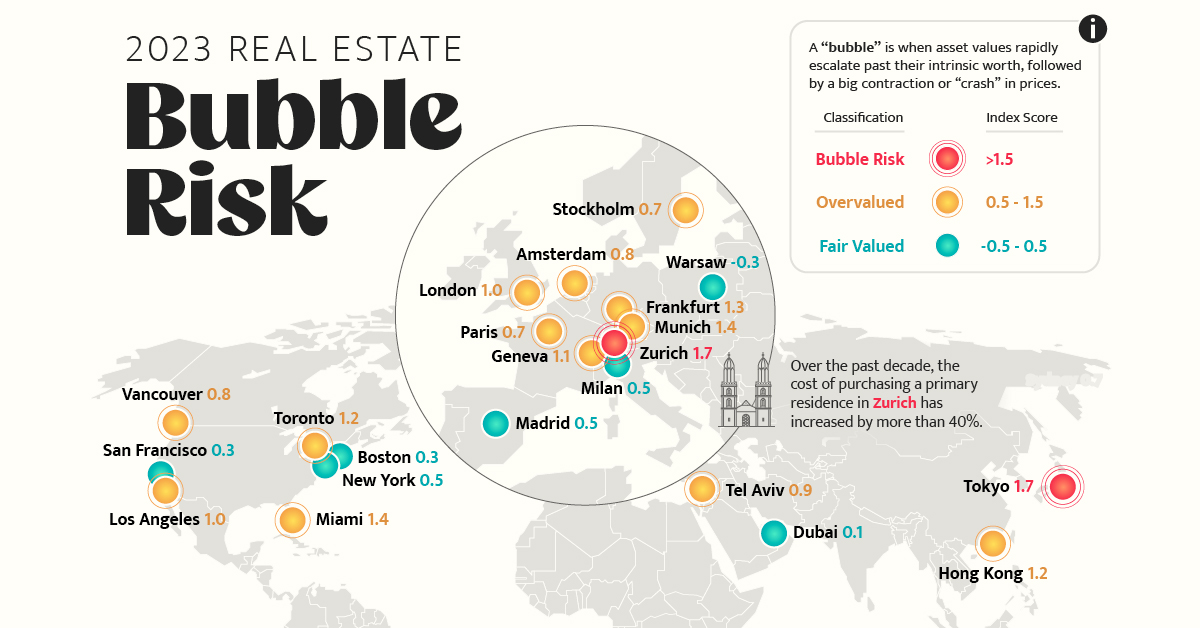
Which Cities Have Bubble Risk in Their Property Markets?
Buoyed by low interest rates for the last decade, many property markets have seen substantial price growth since 2010. Experts warned that real estate bubbles—in which the price of assets moved up far beyond their intrinsic value—were forming.
The UBS Global Real Estate Bubble Index analyzes the real estate market of 25 major cities across the globe and assigns them a score between -0.5 to 2.0 to convey bubble risk. The higher the score, the more imbalanced the market is, with those above 1.5 in “bubble-risk” territory.
We visualize the data in the above map, along with charting the real property price changes in the last year.
Ranking Bubble Risk by City
At the top of UBS’ findings is Switzerland’s financial capital Zurich, with a 1.71 score, putting the city firmly in the bubble-risk zone. With its high-income earners and the country’s low interest rates, the city has been steadily climbing the real estate bubble-risk rankings, 5th in 2021, to 3rd in 2022, to the top spot this year.
Unlike many of its former peers in the risky territory, local prices adapted to increased mortgage rates this year, and have stayed elevated.
Here’s the full rankings for bubble risk in all 25 property markets:
| Rank | City | Index Score | Rating |
|---|---|---|---|
| 1 | 🇨🇭 Zurich | 1.71 | Bubble-Risk |
| 2 | 🇯🇵 Tokyo | 1.65 | Bubble-Risk |
| 3 | 🇺🇸 Miami | 1.38 | Overvalued |
| 4 | 🇩🇪 Munich | 1.35 | Overvalued |
| 5 | 🇩🇪 Frankfurt | 1.27 | Overvalued |
| 6 | 🇭🇰 Hong Kong | 1.24 | Overvalued |
| 7 | 🇨🇦 Toronto | 1.21 | Overvalued |
| 8 | 🇨🇭 Geneva | 1.13 | Overvalued |
| 9 | 🇺🇸 Los Angeles | 1.03 | Overvalued |
| 10 | 🇬🇧 London | 0.98 | Overvalued |
| 11 | 🇮🇱 Tel Aviv | 0.93 | Overvalued |
| 12 | 🇨🇦 Vancouver | 0.81 | Overvalued |
| 13 | 🇳🇱 Amsterdam | 0.80 | Overvalued |
| 14 | 🇸🇪 Stockholm | 0.74 | Overvalued |
| 15 | 🇫🇷 Paris | 0.73 | Overvalued |
| 16 | 🇦🇺 Sydney | 0.67 | Overvalued |
| 17 | 🇮🇹 Milan | 0.49 | Fair-Valued |
| 18 | 🇺🇸 New York | 0.47 | Fair-Valued |
| 19 | 🇸🇬 Singapore | 0.47 | Fair-Valued |
| 20 | 🇪🇸 Madrid | 0.46 | Fair-Valued |
| 21 | 🇺🇸 Boston | 0.34 | Fair-Valued |
| 22 | 🇺🇸 San Francisco | 0.27 | Fair-Valued |
| 23 | 🇦🇪 Dubai | 0.14 | Fair-Valued |
| 24 | 🇧🇷 São Paulo | 0.09 | Fair-Valued |
| 25 | 🇵🇱 Warsaw | -0.28 | Fair-Valued |
Tokyo (1.65) is the second and final entry in the real estate markets with immediate bubble risk. This is a decrease from nine total cities in that category last year.
In fact the other seven real estate markets which scored above 1.5 in 2022 have all seen significant real property price drops, many of them in the double-digits, which has moved them into “overvalued territory.”
These include: Frankfurt (-15.9%), Toronto (-14.7%), Amsterdam (-14.0%), Munich (-13.8%), Vancouver (-10.6%), Hong Kong (-7.1%), and Tel Aviv (-0.7%).
The key driver of these price drops across the board are the aggressive interest rate hikes to counter rising inflation, which pushed many housing markets into unaffordability, forcing sellers to lower their prices.
However, a few cities have seen real property price increases, including the aforementioned Tokyo and Zurich.
Here’s UBS’ full ranking of real property price changes between 2022–2023.
| Rank | City | Real Property Price Growth (YoY) |
|---|---|---|
| 1 | 🇦🇪 Dubai | +14.6% |
| 2 | 🇺🇸 Miami | +6.0% |
| 3 | 🇯🇵 Tokyo | +3.6% |
| 4 | 🇺🇸 New York | +3.2% |
| 5 | 🇪🇸 Madrid | +2.9% |
| 6 | 🇸🇬 Singapore | +2.8% |
| 7 | 🇨🇭 Zurich | +1.5% |
| 8 | 🇧🇷 São Paulo | +1.4% |
| 9 | 🇨🇭 Geneva | -0.1% |
| 10 | 🇮🇱 Tel Aviv | -0.7% |
| 11 | 🇮🇹 Milan | -1.9% |
| 12 | 🇺🇸 Boston | -3.4% |
| 13 | 🇺🇸 Los Angeles | -3.7% |
| 14 | 🇭🇰 Hong Kong | -7.1% |
| 15 | 🇫🇷 Paris | -7.9% |
| 16 | 🇵🇱 Warsaw | -9.3% |
| 17 | 🇦🇺 Sydney | -10.5% |
| 18 | 🇨🇦 Vancouver | -10.6% |
| 19 | 🇺🇸 San Francisco | -10.6% |
| 20 | 🇩🇪 Munich | -13.8% |
| 21 | 🇬🇧 London | -13.9% |
| 22 | 🇳🇱 Amsterdam | -14.0% |
| 23 | 🇨🇦 Toronto | -14.7% |
| 24 | 🇩🇪 Frankfurt | -15.9% |
| 25 | 🇸🇪 Stockholm | -22.1% |
A significant outlier within this group, Dubai, has registered double-digit growth property price growth. This was fueled by expanding household incomes—thanks to an economic boom from oil prices—as well as increased immigration by wealthy individuals.
Ranked: Cities With Rising Rental Prices
However, even as property prices have cooled in the majority of the analyzed real estate market, the rental market for many cities, like Vancouver (+10.7%) and Toronto (+6.0%) has moved swiftly in the opposite direction.
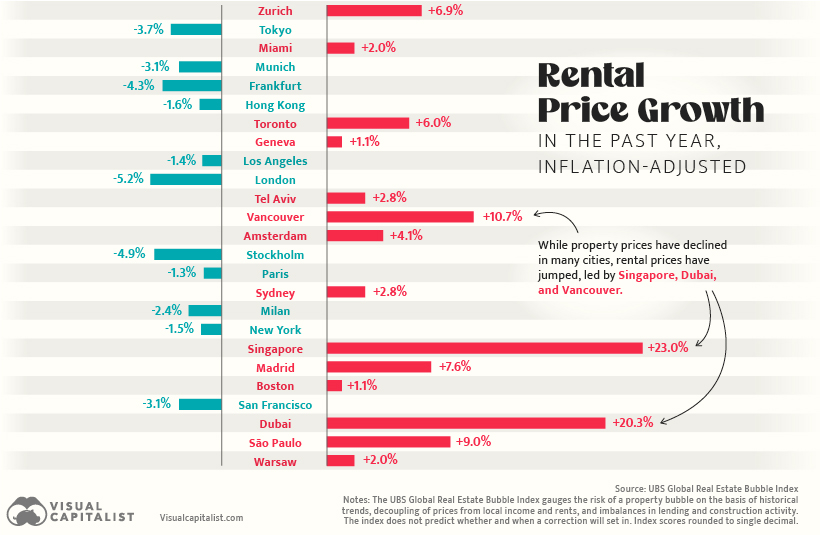
In this case, inflation is a key reason as well—pushing up incomes, in turn leading to rising rents. Furthermore, owners-occupants with tenants seek to pass on higher mortgage costs in an effort to reduce their financial burden.
Where Does This Data Come From?
Source: UBS Global Real Estate Index (2023).
Note: The term “bubble” refers to a substantial and sustained mispricing of an asset, the existence of which cannot be proved unless it bursts. But historical data reveals patterns of property market excesses. Typical signs include a decoupling of prices from local incomes and rents, and imbalances in the real economy, such as excessive lending and construction activity. The UBS Global Real Estate Bubble Index gauges the risk of a property bubble on the basis of such patterns. The index does not predict whether and when a correction will set in. A change in macroeconomic momentum, a shift in investor sentiment or a major supply increase could trigger a decline in house prices.


Markets
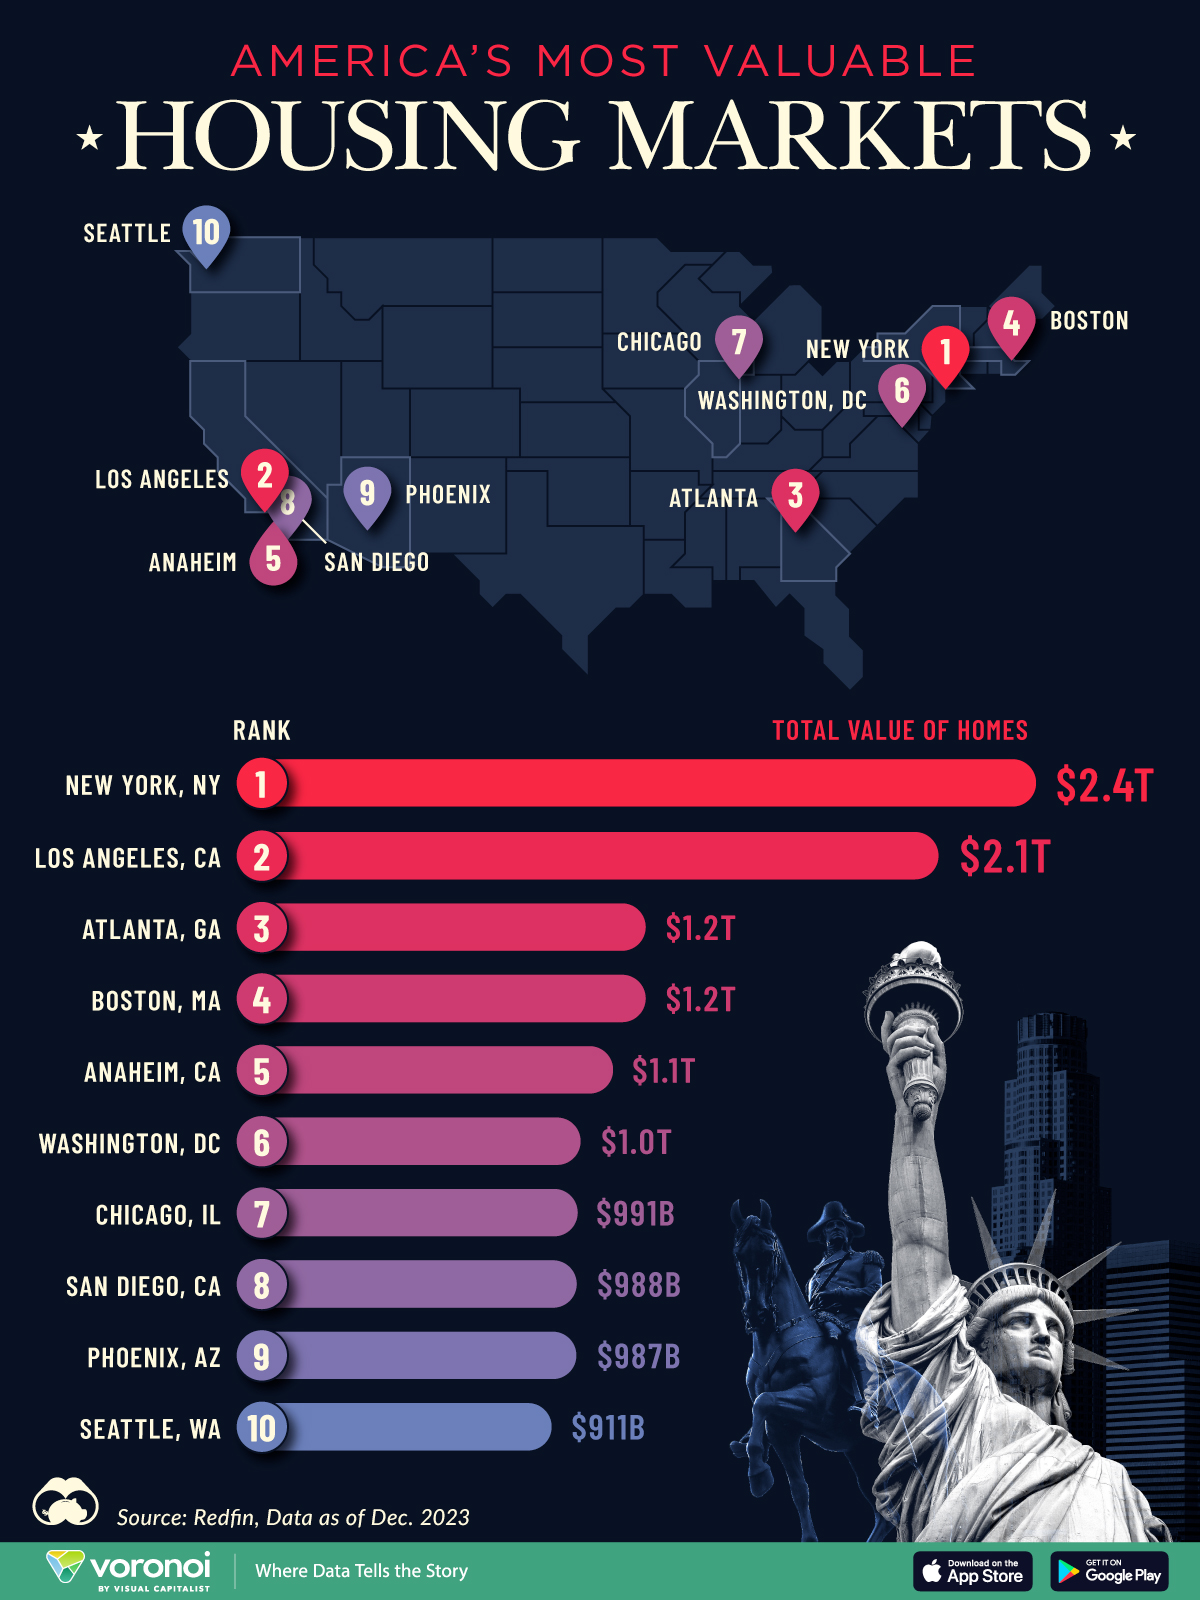
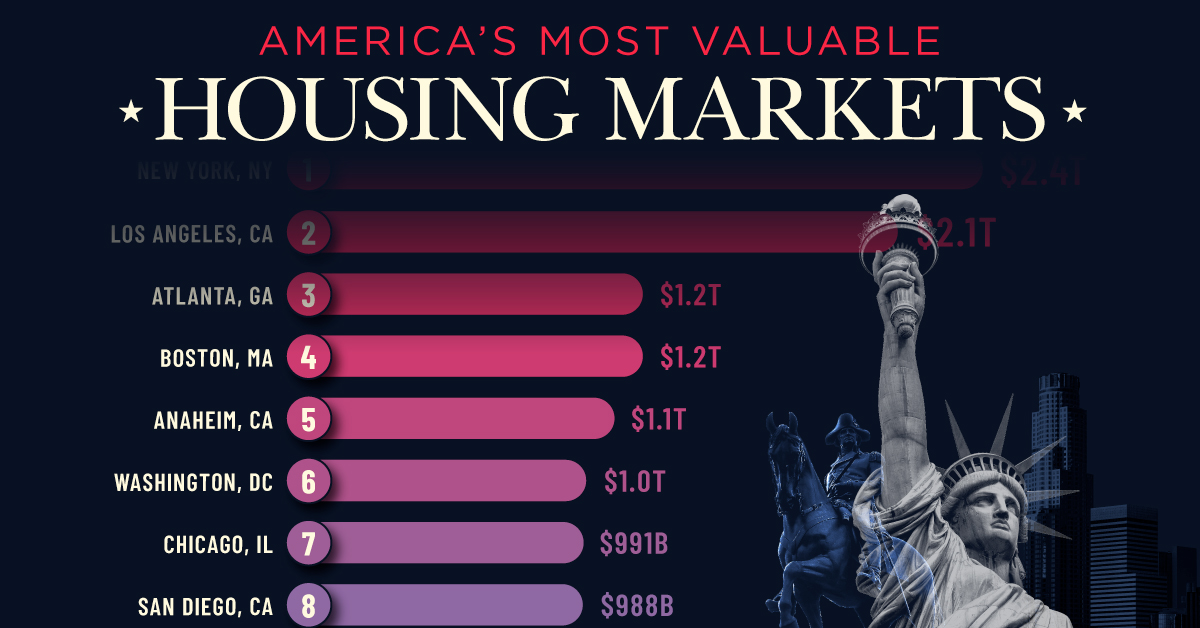
Ranked: The Most Valuable Housing Markets in America
The U.S. residential real estate market is worth a staggering $47.5 trillion. Here are the most valuable housing markets in the country.
The Most Valuable Housing Markets in America
This was originally posted on our Voronoi app. Download the app for free on iOS or Android and discover incredible data-driven charts from a variety of trusted sources.
The residential real estate market in the U.S. stands as one of the largest asset classes in the country, worth $47.5 trillion in 2023.
Despite a slowdown in home sales, the total value of homes increased $2.4 trillion last year as low inventory levels pushed up prices. Affordable metropolitan areas saw steady price growth, while expensive metros experienced slower price appreciation.
This graphic shows America’s most valuable housing markets, using data from Redfin.
Top U.S. Residential Real Estate Markets
To calculate the largest U.S. housing markets, Redfin analyzed 90 million properties covering single-family homes, townhouses, condos, and two-to four-unit multifamily properties.
Below, we show the most valuable residential markets as of December 2023:
| Rank | U.S. Metro | Total Value of Homes | Total Value of Homes YoY Change |
|---|---|---|---|
| 1 | New York, NY | $2.4T | -1.0% |
| 2 | Los Angeles, CA | $2.1T | +4.3% |
| 3 | Atlanta, GA | $1.2T | +6.2% |
| 4 | Boston, MA | $1.2T | +8.3% |
| 5 | Anaheim, CA | $1.1T | +8.0% |
| 6 | Washington, DC | $1.0T | +6.2% |
| 7 | Chicago, IL | $991B | +7.4% |
| 8 | San Diego, CA | $988B | +9.4% |
| 9 | Phoenix, AZ | $987B | +4.2% |
| 10 | Seattle, WA | $911B | +4.6% |
With a housing market worth $2.4 trillion, New York, NY tops the list.
Unlike the majority of large U.S. cities, the aggregate value of homes declined as buyers became increasingly priced out of the market. At the same time, homeowners hesitated to sell in order to lock in low mortgage rates. In fact, more than 80% of mortgage holders in New York City have interest rates that are 5% or lower.
Los Angeles, CA falls in second, with a residential real estate market worth $2.0 trillion. Last year, existing home sales tumbled 24.8%, falling to the lowest point since 2007. However, the housing shortage led prices to increase amid high demand. The median sale price climbed to $975,000 in February 2024, a 5.9% jump compared to the same time last year.
Atlanta, GA ranks third and is the most overpriced housing market in the country according to one countrywide analysis. Homes have been selling for 41.7% more than their worth as of the February 2024 data update.
People are flocking to the city for many reasons. General housing affordability is a major driver, along with its thriving tech center. Along with this, state tax credits have increasingly made it a hub for the TV and film industries, earning it the moniker “Y’allywood”. Another factor in Atlanta’s inflating housing market are large investment firms, which own a huge footprint of homes in the city.
Editor’s note: For those wondering about the Bay Area, the data groups cities like San Francisco ($657 billion), San Jose ($821 billion), and Oakland ($881 billion) as individual entities, which puts them outside the cutoff. See the Redfin data for the full list of cities.

-

 Science1 week ago
Visualizing the Average Lifespans of Mammals
-

 Markets2 weeks ago
The Top 10 States by Real GDP Growth in 2023
-

 Demographics2 weeks ago
The Smallest Gender Wage Gaps in OECD Countries
-

 United States2 weeks ago
Where U.S. Inflation Hit the Hardest in March 2024
-

 Green2 weeks ago
Top Countries By Forest Growth Since 2001
-

 United States2 weeks ago
Ranked: The Largest U.S. Corporations by Number of Employees
-

 Maps2 weeks ago
The Largest Earthquakes in the New York Area (1970-2024)
-

 Green2 weeks ago
Ranked: The Countries With the Most Air Pollution in 2023