Markets
Charted: U.S. Retail Investor Inflows (2014–2023)
Charted: U.S. Retail Investor Inflows (2014–2023)
U.S. retail investor sentiment hit a record breaking high at the start of 2023, buoyed by the sudden progress in AI capabilities.
Seen as a side show in the stock market for much of the last decade, retail investors are now an investing juggernaut to be considered with.
But how did they get there?
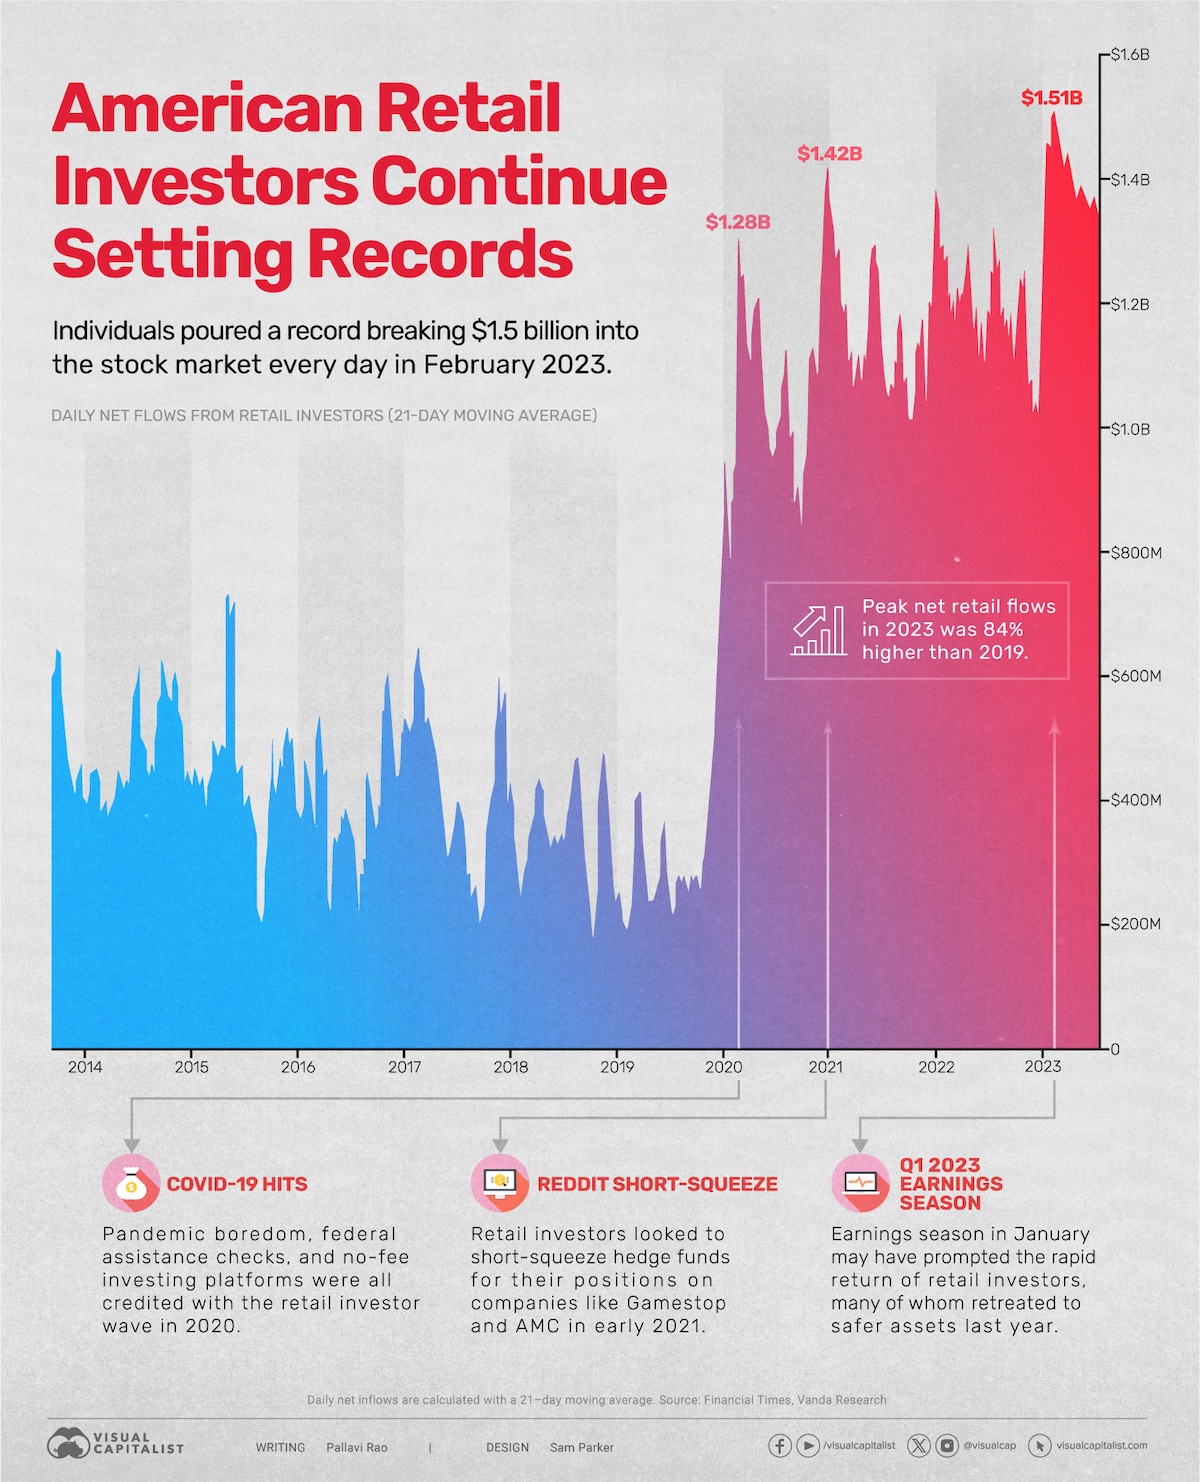
We look at data from Vanda Research, which tracks the daily net flows from U.S. retail investors (calculated using a 21-day moving average) between 2014 and 2023, visualized in the chart above.
Net Inflows from U.S. Retail Investors Break Records
Between 2014–2019, daily U.S. retail investor flows stayed range-bound, occasionally dipping below $200 million and peaking at around $700 million in 2015.
However, a series of factors propelled retail investors to new heights at the end of 2019.
No-fee investing platforms, along with pandemic-induced boredom from lockdowns, combined with federal assistance checks sent investors scurrying to the markets. By the first quarter of 2020, daily net flows hit $1.28 billion, nearly double the previous high in 2015.
| Year | Peak Daily Retail Flows |
|---|---|
| 2014 | $620M |
| 2015 | $730M |
| 2016 | $605M |
| 2017 | $640M |
| 2018 | $480M |
| 2019 | $820M |
| 2020 | $1.28B |
| 2021 | $1.42B |
| 2022 | $1.32B |
| 2023 | $1.51B |
Sentiment—and flows—trended downwards for the rest of 2020, but in 2021, courtesy of the r/wallstreetbets inspired hedge fund short-squeeze, daily flows hit $1.48 billion, as investors piled into video game retailer GameStop.
For the next two years flows stayed locked between $1-1.4 billion per day, as inflation reared its head and bond yields began to climb.
However, in the first few months of 2023, coinciding with Q1 earnings season, U.S. retail investors came roaring back, this time shattering yet another milestone, with daily net flows crossing $1.5 billion a day in February—yet another all-time high.
And instead of going for battered-down childhood nostalgia companies, this time the retail army snapped up several tech picks, like Apple, Amazon and Nvidia, as well as dividend-paying Coca-Cola and AT&T.
Are U.S. Retail Investors Here to Stay?
Part of what is sending retail investor flows up on average is how many more Americans have been involved in the stock market in the last four years.
After the 2008 recession, American stock ownership trended downwards with about 55% investing in the market between 2009–2019.
| Time Period | Average American Stock Ownership |
|---|---|
| 1998–2008 | 61% |
| 2009–2019 | 55% |
| 2020–2023 | 58% |
Source: Gallup poll.
This was less than both the previous decade (61%) and the beginning of the new decade, (58%).
And while a fair amount of younger investors came aboard the coordinated short-squeeze effort in 2021, many have stayed invested, diversifying their portfolios and aiming for long-term gains.
Where Does This Data Come From?
Sources: Vanda Research’s insights, published in the Financial Times and Gallup’s survey on American stock ownership.
Note: In the Gallup poll, surveyors were asked: “Do you, personally, or jointly with a spouse, have any money invested in the stock market right now—either in an individual stock, a stock mutual fund, or in a self-directed 401(k) or IRA?”


Markets
The European Stock Market: Attractive Valuations Offer Opportunities
On average, the European stock market has valuations that are nearly 50% lower than U.S. valuations. But how can you access the market?


European Stock Market: Attractive Valuations Offer Opportunities
Europe is known for some established brands, from L’Oréal to Louis Vuitton. However, the European stock market offers additional opportunities that may be lesser known.
The above infographic, sponsored by STOXX, outlines why investors may want to consider European stocks.
Attractive Valuations
Compared to most North American and Asian markets, European stocks offer lower or comparable valuations.
| Index | Price-to-Earnings Ratio | Price-to-Book Ratio |
|---|---|---|
| EURO STOXX 50 | 14.9 | 2.2 |
| STOXX Europe 600 | 14.4 | 2 |
| U.S. | 25.9 | 4.7 |
| Canada | 16.1 | 1.8 |
| Japan | 15.4 | 1.6 |
| Asia Pacific ex. China | 17.1 | 1.8 |
Data as of February 29, 2024. See graphic for full index names. Ratios based on trailing 12 month financials. The price to earnings ratio excludes companies with negative earnings.
On average, European valuations are nearly 50% lower than U.S. valuations, potentially offering an affordable entry point for investors.
Research also shows that lower price ratios have historically led to higher long-term returns.
Market Movements Not Closely Connected
Over the last decade, the European stock market had low-to-moderate correlation with North American and Asian equities.
The below chart shows correlations from February 2014 to February 2024. A value closer to zero indicates low correlation, while a value of one would indicate that two regions are moving in perfect unison.
| EURO STOXX 50 | STOXX EUROPE 600 | U.S. | Canada | Japan | Asia Pacific ex. China |
|
|---|---|---|---|---|---|---|
| EURO STOXX 50 | 1.00 | 0.97 | 0.55 | 0.67 | 0.24 | 0.43 |
| STOXX EUROPE 600 | 1.00 | 0.56 | 0.71 | 0.28 | 0.48 | |
| U.S. | 1.00 | 0.73 | 0.12 | 0.25 | ||
| Canada | 1.00 | 0.22 | 0.40 | |||
| Japan | 1.00 | 0.88 | ||||
| Asia Pacific ex. China | 1.00 |
Data is based on daily USD returns.
European equities had relatively independent market movements from North American and Asian markets. One contributing factor could be the differing sector weights in each market. For instance, technology makes up a quarter of the U.S. market, but health care and industrials dominate the broader European market.
Ultimately, European equities can enhance portfolio diversification and have the potential to mitigate risk for investors.
Tracking the Market
For investors interested in European equities, STOXX offers a variety of flagship indices:
| Index | Description | Market Cap |
|---|---|---|
| STOXX Europe 600 | Pan-regional, broad market | €10.5T |
| STOXX Developed Europe | Pan-regional, broad-market | €9.9T |
| STOXX Europe 600 ESG-X | Pan-regional, broad market, sustainability focus | €9.7T |
| STOXX Europe 50 | Pan-regional, blue-chip | €5.1T |
| EURO STOXX 50 | Eurozone, blue-chip | €3.5T |
Data is as of February 29, 2024. Market cap is free float, which represents the shares that are readily available for public trading on stock exchanges.
The EURO STOXX 50 tracks the Eurozone’s biggest and most traded companies. It also underlies one of the world’s largest ranges of ETFs and mutual funds. As of November 2023, there were €27.3 billion in ETFs and €23.5B in mutual fund assets under management tracking the index.
“For the past 25 years, the EURO STOXX 50 has served as an accurate, reliable and tradable representation of the Eurozone equity market.”
— Axel Lomholt, General Manager at STOXX
Partnering with STOXX to Track the European Stock Market
Are you interested in European equities? STOXX can be a valuable partner:
- Comprehensive, liquid and investable ecosystem
- European heritage, global reach
- Highly sophisticated customization capabilities
- Open architecture approach to using data
- Close partnerships with clients
- Part of ISS STOXX and Deutsche Börse Group
With a full suite of indices, STOXX can help you benchmark against the European stock market.
Learn how STOXX’s European indices offer liquid and effective market access.

-

 Economy2 days ago
Economic Growth Forecasts for G7 and BRICS Countries in 2024
The IMF has released its economic growth forecasts for 2024. How do the G7 and BRICS countries compare?
-

 Markets1 week ago
U.S. Debt Interest Payments Reach $1 Trillion
U.S. debt interest payments have surged past the $1 trillion dollar mark, amid high interest rates and an ever-expanding debt burden.
-

 United States2 weeks ago
Ranked: The Largest U.S. Corporations by Number of Employees
We visualized the top U.S. companies by employees, revealing the massive scale of retailers like Walmart, Target, and Home Depot.
-

 Markets2 weeks ago
The Top 10 States by Real GDP Growth in 2023
This graphic shows the states with the highest real GDP growth rate in 2023, largely propelled by the oil and gas boom.
-

 Markets2 weeks ago
Ranked: The World’s Top Flight Routes, by Revenue
In this graphic, we show the highest earning flight routes globally as air travel continued to rebound in 2023.
-

 Markets3 weeks ago
Ranked: The Most Valuable Housing Markets in America
The U.S. residential real estate market is worth a staggering $47.5 trillion. Here are the most valuable housing markets in the country.


-

 Education1 week ago
How Hard Is It to Get Into an Ivy League School?
-

 Technology2 weeks ago
Ranked: Semiconductor Companies by Industry Revenue Share
-
Markets2 weeks ago
Ranked: The World’s Top Flight Routes, by Revenue
-

 Demographics2 weeks ago
Population Projections: The World’s 6 Largest Countries in 2075
-
Markets2 weeks ago
The Top 10 States by Real GDP Growth in 2023
-

 Demographics2 weeks ago
The Smallest Gender Wage Gaps in OECD Countries
-

 Economy2 weeks ago
Where U.S. Inflation Hit the Hardest in March 2024
-

 Green2 weeks ago
Top Countries By Forest Growth Since 2001