

From complete overhauls to more subtle tweaks, these tech logos have had quite a journey. Featuring: Google, Apple, and more.


Nvidia is coming for Intel’s crown. Samsung is losing ground. AI is transforming the space. We break down revenue for semiconductor companies.


This graphic breaks down America's most preferred smartphone brands, according to a December 2023 consumer survey.


We compare America's top 10 companies by revenue in 1994 and 2023 to see how the business landscape has changed.


With trillion dollar valuations becoming more common, we've compared the five biggest companies by stock exchange.


We visualize the recent performance of the Magnificent Seven stocks, uncovering a clear divergence between the group's top and bottom names.


Foxconn produces roughly two out of every three iPhones.


The combined wealth of the 10 richest individuals in the world amounts to $1.44 trillion.
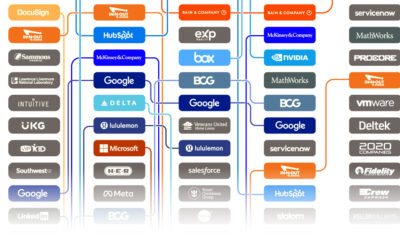

Glassdoor’s annual list is determined by an algorithm that converts reviews to ratings—here are America's 15 best places to work since 2020.


In 2023, iPhones accounted for more than half of Apple's revenue.


