Markets
Mapped: The Migration of the World’s Millionaires in 2023
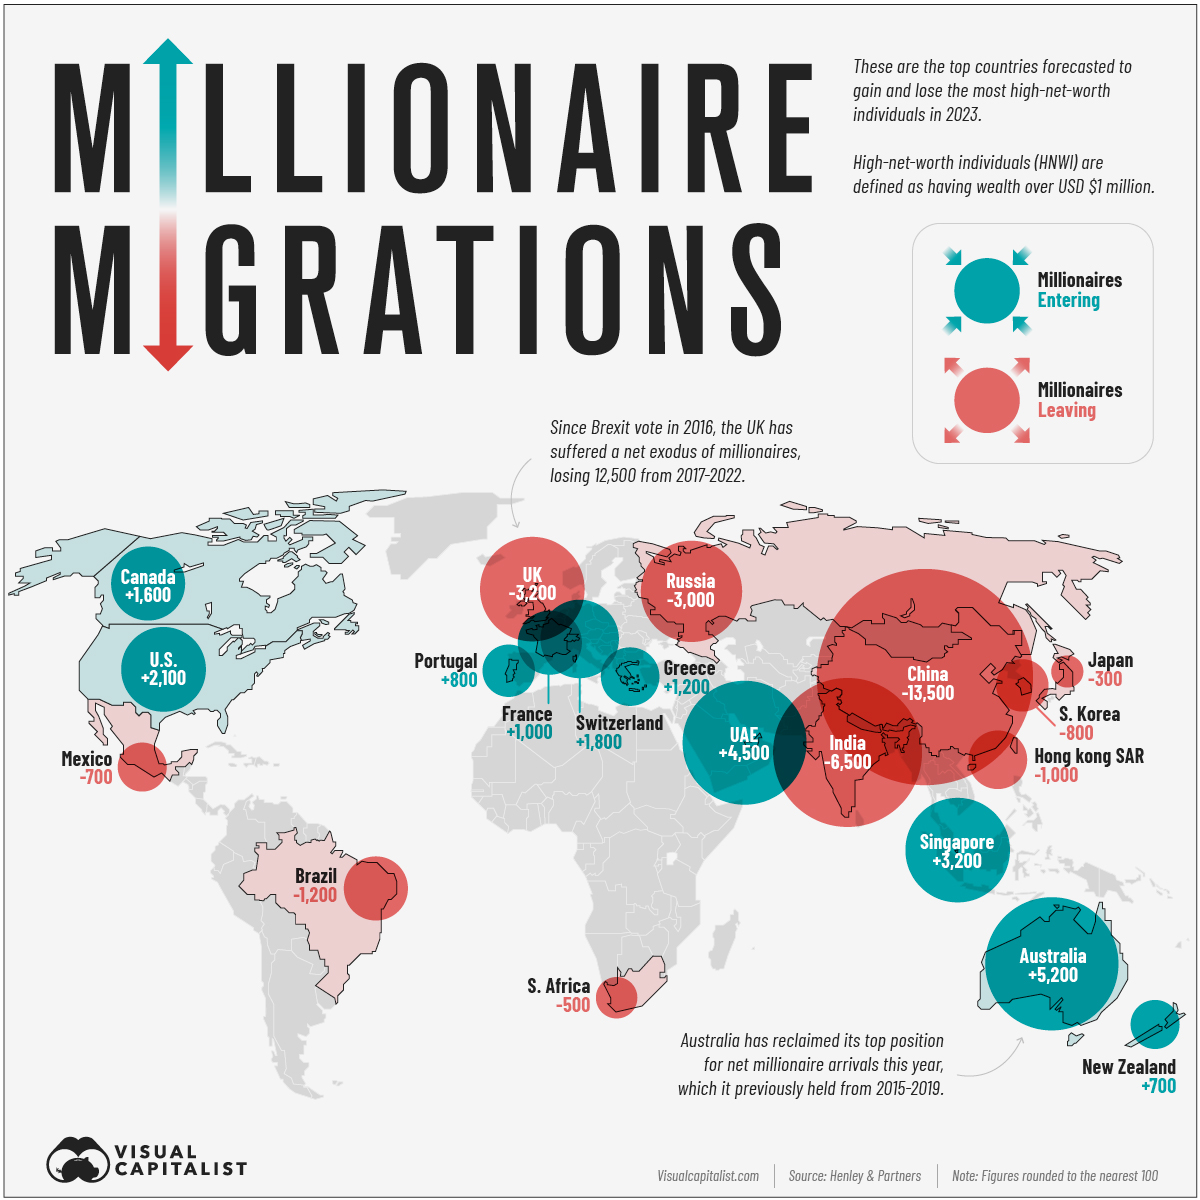


Mapping the Migration of the World’s Millionaires 2023
Just like everyone else, High Net Worth Individuals (HNWIs) traveled less than usual during the pandemic, and as a result their migration numbers trended downwards. But millionaires and billionaires are on the move again and it is anticipated that 122,000 HNWIs will move to a new country by the end of the year.
Henley & Partners’ Private Wealth Migration Report has tracked the countries HNWIs have moved from and to over the last 10 years; this map showcases the 2023 forecasts.
In this context, HNWIs are defined as individuals with a net worth of at least $1 million USD.
The Countries Welcoming New Millionaires
The top 10 countries which are likely to become home to the highest number of millionaires and billionaires in 2023 are scattered across the globe, with Australia reclaiming its top spot this year from the UAE.
Here’s a closer look at the data:
| Rank | Country | Projected HNWI Inflow 2023 |
|---|---|---|
| 1 | 🇦🇺 Australia | 5,200 |
| 2 | 🇦🇪 UAE | 4,500 |
| 3 | 🇸🇬 Singapore | 3,200 |
| 4 | 🇺🇸 U.S. | 2,100 |
| 5 | 🇨🇭 Switzerland | 1,800 |
| 6 | 🇨🇦 Canada | 1,600 |
| 7 | 🇬🇷 Greece | 1,200 |
| 8 | 🇫🇷 France | 1,000 |
| 9 | 🇵🇹 Portugal | 800 |
| 10 | 🇳🇿 New Zealand | 700 |
Only two Asian countries make the top 10, with the rest spread across Europe, North America, and Oceania.
Despite historic economic challenges, Greece is projected to gain 1,200 High Net Worth Individuals this year. One reason could be the country’s golden visa program, wherein wealthy individuals can easily obtain residence and eventually EU passports for the right price—currently a minimum real estate investment cost of 250,000 euros is all that’s required.
Many of the leading millionaire destinations are attractive for wealthy individuals because of higher levels of economic freedom, allowing for laxer tax burdens or ease of investment. Singapore, which expects to gain 3,200 millionaires, is the most economically free market in the world.
The Countries Losing the Most Millionaires
China is anticipated to lose 13,500 High Net Worth Individuals this year, more than double as many as the second place country, India (6,500).
Here’s a closer look at the bottom 10:
| Rank | Country | Projected HNWI Outflow 2023 |
|---|---|---|
| 1 | 🇨🇳 China | -13,500 |
| 2 | 🇮🇳 India | -6,500 |
| 3 | 🇬🇧 UK | -3,200 |
| 4 | 🇷🇺 Russia | -3,000 |
| 5 | 🇧🇷 Brazil | -1,200 |
| 6 | 🇭🇰 Hong Kong SAR | -1,000 |
| 7 | 🇰🇷 South Korea | -800 |
| 8 | 🇲🇽 Mexico | -700 |
| 9 | 🇿🇦 South Africa | -500 |
| 10 | 🇯🇵 Japan | -300 |
In a number of these countries, strict regulatory bodies and corrupt governments can hinder the ease with which HNWIs can manage their own money.
In Russia, many wealthy individuals are facing personal tariffs and trade restrictions from Western countries due to the war in Ukraine. China’s crackdowns on Hong Kong have made it a less attractive place for business. And finally, the UK’s exit from the EU has caused many businesses and individuals to lose the easy movement of labor, finances, and investment that made operations across European borders seamless.
Some of these countries may still be adding homegrown millionaires and billionaires, but losing thousands of HNWIs to net migration does have a considerable economic impact.
Overall, millionaires are increasingly on the move. In the 10 years of reporting—despite a dip during the pandemic—the number of HNWIs moving away from their countries of origin has been growing every year.
Here’s a look at the numbers:
| Year | Projected HNWI Migration |
|---|---|
| 2013 | 51,000 |
| 2014 | 57,000 |
| 2015 | 64,000 |
| 2016 | 82,000 |
| 2017 | 95,000 |
| 2018 | 108,000 |
| 2019 | 110,000 |
| 2020 | 12,000 |
| 2021 | 25,000 |
| 2022 | 84,000 |
| 2023 (forecast) | 122,000 |
In a geopolitically fragile but more connected world, it’s no surprise to see millionaires voting with their feet. As a result, governments are increasingly in competition to win the hearts and minds of the world’s economic elite to their side.


Markets
The European Stock Market: Attractive Valuations Offer Opportunities
On average, the European stock market has valuations that are nearly 50% lower than U.S. valuations. But how can you access the market?


European Stock Market: Attractive Valuations Offer Opportunities
Europe is known for some established brands, from L’Oréal to Louis Vuitton. However, the European stock market offers additional opportunities that may be lesser known.
The above infographic, sponsored by STOXX, outlines why investors may want to consider European stocks.
Attractive Valuations
Compared to most North American and Asian markets, European stocks offer lower or comparable valuations.
| Index | Price-to-Earnings Ratio | Price-to-Book Ratio |
|---|---|---|
| EURO STOXX 50 | 14.9 | 2.2 |
| STOXX Europe 600 | 14.4 | 2 |
| U.S. | 25.9 | 4.7 |
| Canada | 16.1 | 1.8 |
| Japan | 15.4 | 1.6 |
| Asia Pacific ex. China | 17.1 | 1.8 |
Data as of February 29, 2024. See graphic for full index names. Ratios based on trailing 12 month financials. The price to earnings ratio excludes companies with negative earnings.
On average, European valuations are nearly 50% lower than U.S. valuations, potentially offering an affordable entry point for investors.
Research also shows that lower price ratios have historically led to higher long-term returns.
Market Movements Not Closely Connected
Over the last decade, the European stock market had low-to-moderate correlation with North American and Asian equities.
The below chart shows correlations from February 2014 to February 2024. A value closer to zero indicates low correlation, while a value of one would indicate that two regions are moving in perfect unison.
| EURO STOXX 50 | STOXX EUROPE 600 | U.S. | Canada | Japan | Asia Pacific ex. China |
|
|---|---|---|---|---|---|---|
| EURO STOXX 50 | 1.00 | 0.97 | 0.55 | 0.67 | 0.24 | 0.43 |
| STOXX EUROPE 600 | 1.00 | 0.56 | 0.71 | 0.28 | 0.48 | |
| U.S. | 1.00 | 0.73 | 0.12 | 0.25 | ||
| Canada | 1.00 | 0.22 | 0.40 | |||
| Japan | 1.00 | 0.88 | ||||
| Asia Pacific ex. China | 1.00 |
Data is based on daily USD returns.
European equities had relatively independent market movements from North American and Asian markets. One contributing factor could be the differing sector weights in each market. For instance, technology makes up a quarter of the U.S. market, but health care and industrials dominate the broader European market.
Ultimately, European equities can enhance portfolio diversification and have the potential to mitigate risk for investors.
Tracking the Market
For investors interested in European equities, STOXX offers a variety of flagship indices:
| Index | Description | Market Cap |
|---|---|---|
| STOXX Europe 600 | Pan-regional, broad market | €10.5T |
| STOXX Developed Europe | Pan-regional, broad-market | €9.9T |
| STOXX Europe 600 ESG-X | Pan-regional, broad market, sustainability focus | €9.7T |
| STOXX Europe 50 | Pan-regional, blue-chip | €5.1T |
| EURO STOXX 50 | Eurozone, blue-chip | €3.5T |
Data is as of February 29, 2024. Market cap is free float, which represents the shares that are readily available for public trading on stock exchanges.
The EURO STOXX 50 tracks the Eurozone’s biggest and most traded companies. It also underlies one of the world’s largest ranges of ETFs and mutual funds. As of November 2023, there were €27.3 billion in ETFs and €23.5B in mutual fund assets under management tracking the index.
“For the past 25 years, the EURO STOXX 50 has served as an accurate, reliable and tradable representation of the Eurozone equity market.”
— Axel Lomholt, General Manager at STOXX
Partnering with STOXX to Track the European Stock Market
Are you interested in European equities? STOXX can be a valuable partner:
- Comprehensive, liquid and investable ecosystem
- European heritage, global reach
- Highly sophisticated customization capabilities
- Open architecture approach to using data
- Close partnerships with clients
- Part of ISS STOXX and Deutsche Börse Group
With a full suite of indices, STOXX can help you benchmark against the European stock market.
Learn how STOXX’s European indices offer liquid and effective market access.

-

 Economy3 days ago
Economic Growth Forecasts for G7 and BRICS Countries in 2024
The IMF has released its economic growth forecasts for 2024. How do the G7 and BRICS countries compare?
-

 Markets2 weeks ago
U.S. Debt Interest Payments Reach $1 Trillion
U.S. debt interest payments have surged past the $1 trillion dollar mark, amid high interest rates and an ever-expanding debt burden.
-

 United States2 weeks ago
Ranked: The Largest U.S. Corporations by Number of Employees
We visualized the top U.S. companies by employees, revealing the massive scale of retailers like Walmart, Target, and Home Depot.
-

 Markets2 weeks ago
The Top 10 States by Real GDP Growth in 2023
This graphic shows the states with the highest real GDP growth rate in 2023, largely propelled by the oil and gas boom.
-

 Markets3 weeks ago
Ranked: The World’s Top Flight Routes, by Revenue
In this graphic, we show the highest earning flight routes globally as air travel continued to rebound in 2023.
-

 Markets3 weeks ago
Ranked: The Most Valuable Housing Markets in America
The U.S. residential real estate market is worth a staggering $47.5 trillion. Here are the most valuable housing markets in the country.


-

 Debt1 week ago
How Debt-to-GDP Ratios Have Changed Since 2000
-

 Countries2 weeks ago
Population Projections: The World’s 6 Largest Countries in 2075
-
Markets2 weeks ago
The Top 10 States by Real GDP Growth in 2023
-

 Demographics2 weeks ago
The Smallest Gender Wage Gaps in OECD Countries
-

 United States2 weeks ago
Where U.S. Inflation Hit the Hardest in March 2024
-

 Green2 weeks ago
Top Countries By Forest Growth Since 2001
-
United States2 weeks ago
Ranked: The Largest U.S. Corporations by Number of Employees
-

 Maps2 weeks ago
The Largest Earthquakes in the New York Area (1970-2024)