Markets
Mapped: The State of Economic Freedom in 2023


Mapped: The State of Economic Freedom in 2023
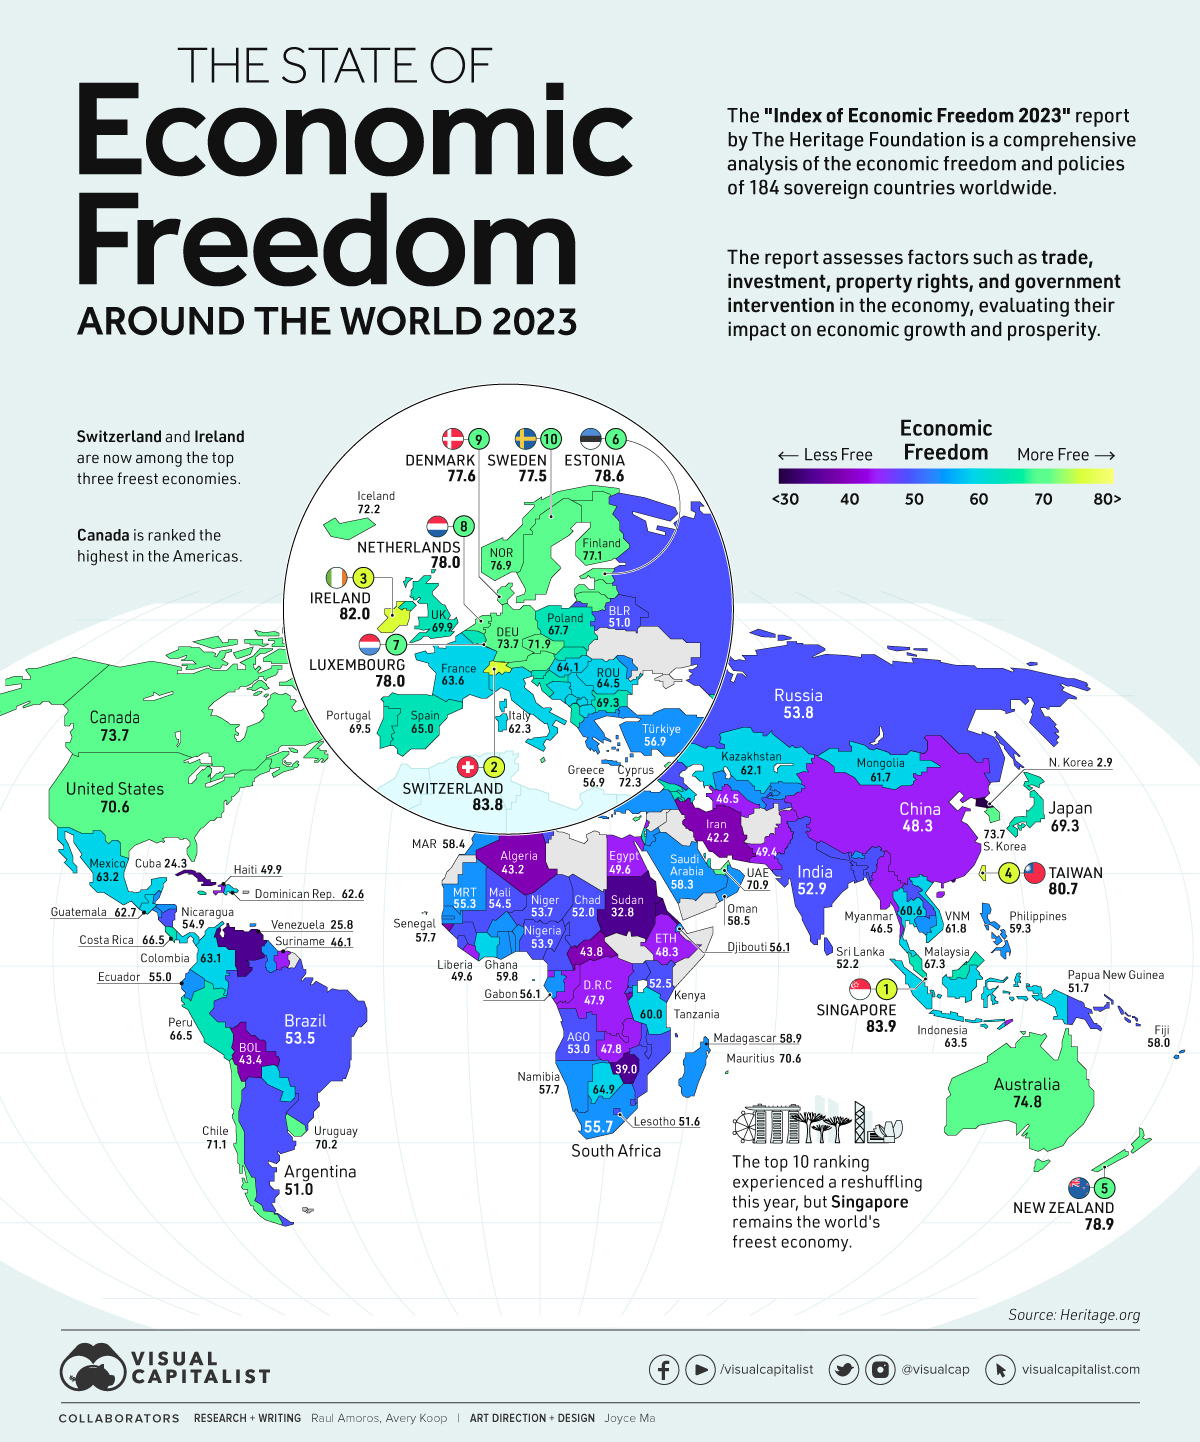
The concept of economic freedom serves as a vital framework for evaluating the extent to which individuals and businesses have the freedom to make economic decisions. In countries with low economic freedom, governments exert coercion and constraints on liberties, restricting choice for individuals and businesses, which can ultimately hinder prosperity.
The map above uses the annual Index of Economic Freedom from the Heritage Foundation to showcase the level of economic freedom in every country worldwide on a scale of 0-100, looking at factors like property rights, tax burdens, labor freedom, and so on.
The ranking categorizing scores of 80+ as free economies, 70-79.9 as mostly free, 60-69.9 as moderately free, 50-59.9 as mostly unfree, and 0-49.9 as repressed.
Measuring Economic Freedom
This ranking uses four broad categories with three key indicators each, both qualitative and quantitative, to measure economic freedom.
- Rule of law: property rights, judicial effectiveness, government integrity
- Size of government: tax burdens, fiscal health, government spending
- Regulatory efficiency: labor freedom, monetary freedom, business freedom
- Open markets: financial freedom, trade freedom, investment freedom
The 12 indicators are weighted equally and scored from 0-100. The overall score is then determined from the average of the 12 indicators.
Here’s a closer look at every country’s score:
| Rank | Country | 2023 Score |
|---|---|---|
| #1 | 🇸🇬 Singapore | 83.9 |
| #2 | 🇨🇭 Switzerland | 83.8 |
| #3 | 🇮🇪 Ireland | 82.0 |
| #4 | 🇹🇼 Taiwan | 80.7 |
| #5 | 🇳🇿 New Zealand | 78.9 |
| #6 | 🇪🇪 Estonia | 78.6 |
| #7 | 🇱🇺 Luxembourg | 78.4 |
| #8 | 🇳🇱 Netherlands | 78.0 |
| #9 | 🇩🇰 Denmark | 77.6 |
| #10 | 🇸🇪 Sweden | 77.5 |
| #11 | 🇫🇮 Finland | 77.1 |
| #12 | 🇳🇴 Norway | 76.9 |
| #13 | 🇦🇺 Australia | 74.8 |
| #14 | 🇩🇪 Germany | 73.7 |
| #15 | 🇰🇷 South Korea | 73.7 |
| #16 | 🇨🇦 Canada | 73.7 |
| #17 | 🇱🇻 Latvia | 72.8 |
| #18 | 🇨🇾 Cyprus | 72.3 |
| #19 | 🇮🇸 Iceland | 72.2 |
| #20 | 🇱🇹 Lithuania | 72.2 |
| #21 | 🇨🇿 Czechia | 71.9 |
| #22 | 🇨🇱 Chile | 71.1 |
| #23 | 🇦🇹 Austria | 71.1 |
| #24 | 🇦🇪 United Arab Emirates | 70.9 |
| #25 | 🇺🇸 United States | 70.6 |
| #26 | 🇲🇺 Mauritius | 70.6 |
| #27 | 🇺🇾 Uruguay | 70.2 |
| #28 | 🇬🇧 United Kingdom | 69.9 |
| #29 | 🇧🇧 Barbados | 69.8 |
| #30 | 🇵🇹 Portugal | 69.5 |
| #31 | 🇯🇵 Japan | 69.3 |
| #32 | 🇧🇬 Bulgaria | 69.3 |
| #33 | 🇸🇰 Slovakia | 69.0 |
| #34 | 🇮🇱 Israel | 68.9 |
| #35 | 🇬🇪 Georgia | 68.7 |
| #36 | 🇶🇦 Qatar | 68.6 |
| #37 | 🇸🇮 Slovenia | 68.5 |
| #38 | 🇼🇸 Samoa | 68.3 |
| #39 | 🇯🇲 Jamaica | 68.1 |
| #40 | 🇵🇱 Poland | 67.7 |
| #41 | 🇲🇹 Malta | 67.5 |
| #42 | 🇲🇾 Malaysia | 67.3 |
| #43 | 🇧🇪 Belgium | 67.1 |
| #44 | 🇵🇪 Peru | 66.5 |
| #45 | 🇨🇷 Costa Rica | 66.5 |
| #46 | 🇭🇷 Croatia | 66.4 |
| #47 | 🇨🇻 Cabo Verde | 65.8 |
| #48 | 🇧🇳 Brunei Darussalam | 65.7 |
| #49 | 🇦🇱 Albania | 65.3 |
| #50 | 🇦🇲 Armenia | 65.1 |
| #51 | 🇪🇸 Spain | 65.0 |
| #52 | 🇧🇼 Botswana | 64.9 |
| #53 | 🇷🇴 Romania | 64.5 |
| #54 | 🇭🇺 Hungary | 64.1 |
| #55 | 🇵🇦 Panama | 63.8 |
| #56 | 🇲🇰 North Macedonia | 63.7 |
| #57 | 🇫🇷 France | 63.6 |
| #58 | 🇷🇸 Serbia | 63.5 |
| #59 | 🇻🇨 Saint Vincent and the Grenadines | 63.5 |
| #60 | 🇮🇩 Indonesia | 63.5 |
| #61 | 🇲🇽 Mexico | 63.2 |
| #62 | 🇨🇴 Colombia | 63.1 |
| #63 | 🇧🇦 Bosnia and Herzegovina | 62.9 |
| #64 | 🇬🇹 Guatemala | 62.7 |
| #65 | 🇩🇴 Dominican Republic | 62.6 |
| #66 | 🇧🇸 The Bahamas | 62.6 |
| #67 | 🇫🇲 Micronesia | 62.6 |
| #68 | 🇧🇭 Bahrain | 62.5 |
| #69 | 🇮🇹 Italy | 62.3 |
| #70 | 🇻🇺 Vanuatu | 62.1 |
| #71 | 🇰🇿 Kazakhstan | 62.1 |
| #72 | 🇻🇳 Vietnam | 61.8 |
| #73 | 🇲🇳 Mongolia | 61.7 |
| #74 | 🇸🇹 São Tomé and Príncipe | 61.5 |
| #75 | 🇦🇿 Azerbaijan | 61.4 |
| #76 | 🇵🇾 Paraguay | 61.0 |
| #77 | 🇲🇪 Montenegro | 60.9 |
| #78 | 🇽🇰 Kosovo | 60.7 |
| #79 | 🇱🇨 Saint Lucia | 60.7 |
| #80 | 🇹🇭 Thailand | 60.6 |
| #81 | 🇨🇮 Côte d'Ivoire | 60.4 |
| #82 | 🇹🇴 Tonga | 60.0 |
| #83 | 🇹🇿 Tanzania | 60.0 |
| #84 | 🇧🇯 Benin | 59.8 |
| #85 | 🇧🇿 Belize | 59.8 |
| #86 | 🇩🇲 Dominica | 59.7 |
| #87 | 🇸🇨 Seychelles | 59.5 |
| #88 | 🇹🇹 Trinidad and Tobago | 59.5 |
| #89 | 🇵🇭 Philippines | 59.3 |
| #90 | 🇧🇹 Bhutan | 59.0 |
| #91 | 🇲🇬 Madagascar | 58.9 |
| #92 | 🇰🇮 Kiribati | 58.8 |
| #93 | 🇯🇴 Jordan | 58.8 |
| #94 | 🇭🇳 Honduras | 58.7 |
| #95 | 🇴🇲 Oman | 58.5 |
| #96 | 🇲🇩 Moldova | 58.5 |
| #97 | 🇲🇦 Morocco | 58.4 |
| #98 | 🇸🇦 Saudi Arabia | 58.3 |
| #99 | 🇬🇭 Ghana | 58.0 |
| #100 | 🇫🇯 Fiji | 58.0 |
| #101 | 🇬🇲 The Gambia | 57.9 |
| #102 | 🇳🇦 Namibia | 57.7 |
| #103 | 🇸🇳 Senegal | 57.7 |
| #104 | 🇹🇷 Türkiye | 56.9 |
| #105 | 🇬🇾 Guyana | 56.9 |
| #106 | 🇬🇷 Greece | 56.9 |
| #107 | 🇸🇧 Solomon Islands | 56.9 |
| #108 | 🇰🇼 Kuwait | 56.7 |
| #109 | 🇺🇿 Uzbekistan | 56.5 |
| #110 | 🇰🇭 Cambodia | 56.5 |
| #111 | 🇧🇫 Burkina Faso | 56.2 |
| #112 | 🇬🇦 Gabon | 56.1 |
| #113 | 🇩🇯 Djibouti | 56.1 |
| #114 | 🇸🇻 El Salvador | 56.0 |
| #115 | 🇰🇬 Kyrgyzstan | 55.8 |
| #116 | 🇿🇦 South Africa | 55.7 |
| #117 | 🇲🇷 Mauritania | 55.3 |
| #118 | 🇹🇬 Togo | 55.3 |
| #119 | 🇪🇨 Ecuador | 55.0 |
| #120 | 🇸🇿 Eswatini | 54.9 |
| #121 | 🇳🇮 Nicaragua | 54.9 |
| #122 | 🇲🇱 Mali | 54.5 |
| #123 | 🇧🇩 Bangladesh | 54.4 |
| #124 | 🇳🇬 Nigeria | 53.9 |
| #125 | 🇷🇺 Russia | 53.8 |
| #126 | 🇳🇪 Niger | 53.7 |
| #127 | 🇧🇷 Brazil | 53.5 |
| #128 | 🇰🇲 Comoros | 53.5 |
| #129 | 🇬🇳 Guinea | 53.2 |
| #130 | 🇦🇴 Angola | 53.0 |
| #131 | 🇮🇳 India | 52.9 |
| #132 | 🇹🇳 Tunisia | 52.9 |
| #133 | 🇲🇼 Malawi | 52.8 |
| #134 | 🇲🇿 Mozambique | 52.5 |
| #135 | 🇰🇪 Kenya | 52.5 |
| #136 | 🇱🇰 Sri Lanka | 52.2 |
| #137 | 🇷🇼 Rwanda | 52.2 |
| #138 | 🇹🇩 Chad | 52.0 |
| #139 | 🇨🇲 Cameroon | 51.9 |
| #140 | 🇵🇬 Papua New Guinea | 51.7 |
| #141 | 🇱🇸 Lesotho | 51.6 |
| #142 | 🇳🇵 Nepal | 51.4 |
| #143 | 🇺🇬 Uganda | 51.4 |
| #144 | 🇦🇷 Argentina | 51.0 |
| #145 | 🇧🇾 Belarus | 51.0 |
| #146 | 🇹🇯 Tajikistan | 50.6 |
| #147 | 🇱🇦 Laos | 50.3 |
| #148 | 🇸🇱 Sierra Leone | 50.2 |
| #149 | 🇭🇹 Haiti | 49.9 |
| #150 | 🇱🇷 Liberia | 49.6 |
| #151 | 🇪🇬 Egypt | 49.6 |
| #152 | 🇵🇰 Pakistan | 49.4 |
| #153 | 🇬🇶 Equatorial Guinea | 48.3 |
| #154 | 🇨🇳 China | 48.3 |
| #155 | 🇪🇹 Ethiopia | 48.3 |
| #156 | 🇨🇬 Congo | 48.1 |
| #157 | 🇨🇩 Democratic Republic of the Congo | 47.9 |
| #158 | 🇿🇲 Zambia | 47.8 |
| #159 | 🇹🇱 Timor-Leste | 47.2 |
| #160 | 🇲🇻 Maldives | 46.6 |
| #161 | 🇹🇲 Turkmenistan | 46.5 |
| #162 | 🇲🇲 Myanmar | 46.5 |
| #163 | 🇸🇷 Suriname | 46.1 |
| #164 | 🇱🇧 Lebanon | 45.6 |
| #165 | 🇬🇼 Guinea-Bissau | 44.6 |
| #166 | 🇨🇫 Central African Republic | 43.8 |
| #167 | 🇧🇴 Bolivia | 43.4 |
| #168 | 🇩🇿 Algeria | 43.2 |
| #169 | 🇮🇷 Iran | 42.2 |
| #170 | 🇧🇮 Burundi | 41.9 |
| #171 | 🇪🇷 Eritrea | 39.5 |
| #172 | 🇿🇼 Zimbabwe | 39.0 |
| #173 | 🇸🇩 Sudan | 32.8 |
| #174 | 🇻🇪 Venezuela | 25.8 |
| #175 | 🇨🇺 Cuba | 24.3 |
| #176 | 🇰🇵 North Korea | 2.9 |
| - | 🇮🇶 Iraq | N/A |
| - | 🇱🇾 Libya | N/A |
| - | 🇱🇮 Liechtenstein | N/A |
| - | Afghanistan | N/A |
Only four countries in the world have a score of 80 or above, Ireland, Singapore, Switzerland, and Taiwan, categorizing them as completely free economically.
Let’s now look at things from a more regional perspective.
Europe
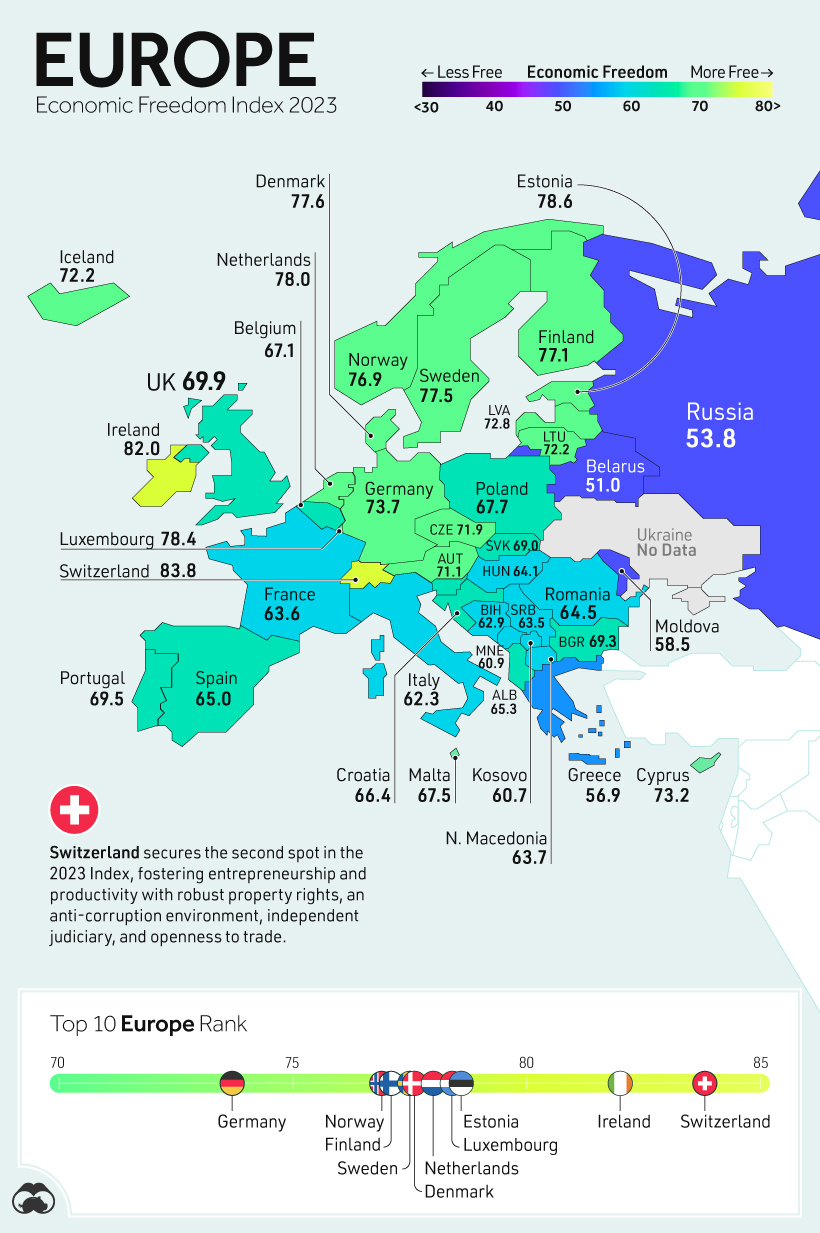
From a regional perspective, Europe ranks the strongest in economic freedom.
Despite being a powerhouse within Europe, Germany ranks 10th in the continent, with a score of 73.7. One of the categories Germany scored the weakest in was government spending (28.3/100). Over the last three years, government spending has averaged 49% of GDP.
Ireland ranks third globally, scoring particularly high in categories like property rights and judicial effectiveness. The country also has no minimum capital requirement—which is typically a banking regulation and corporate law issue determining how many assets an organization must hold—making it attractive for businesses to set up shop on the Emerald Isle.
Africa
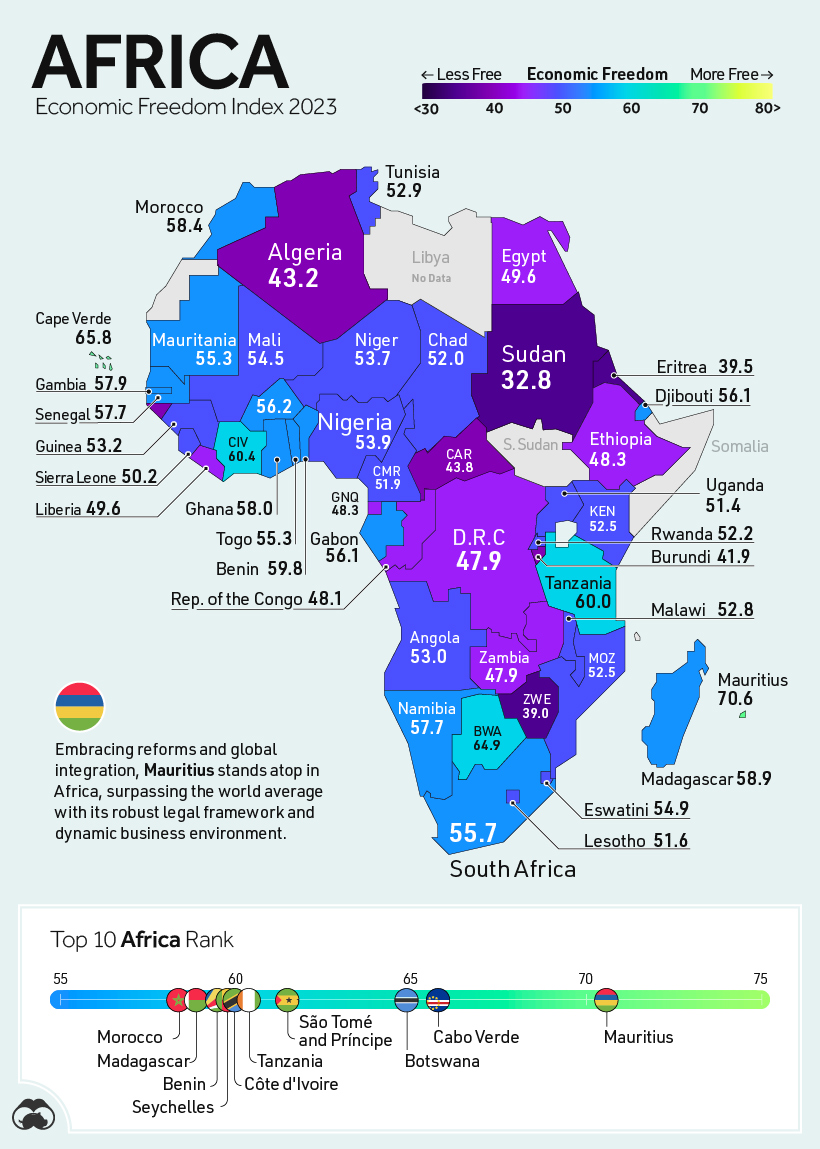
Currently, Africa is the continent with the least economic freedom in the world, however, it is also the region with the highest potential for economic growth. A booming population, and thus, labor force, are promising for future innovation. In fact, it’s anticipated that Africa will see an increase of 2.5 billion people by the end of the century.
The lowest scoring country in Africa is Sudan, a country under further strain thanks to rife civil conflict. Historically, economic development has been constrained by rampant corruption and a lack of institutional capacity.
Conversely, Botswana registered the highest score on continental Africa (64.9), ranking higher than countries like France and Italy.
The Americas
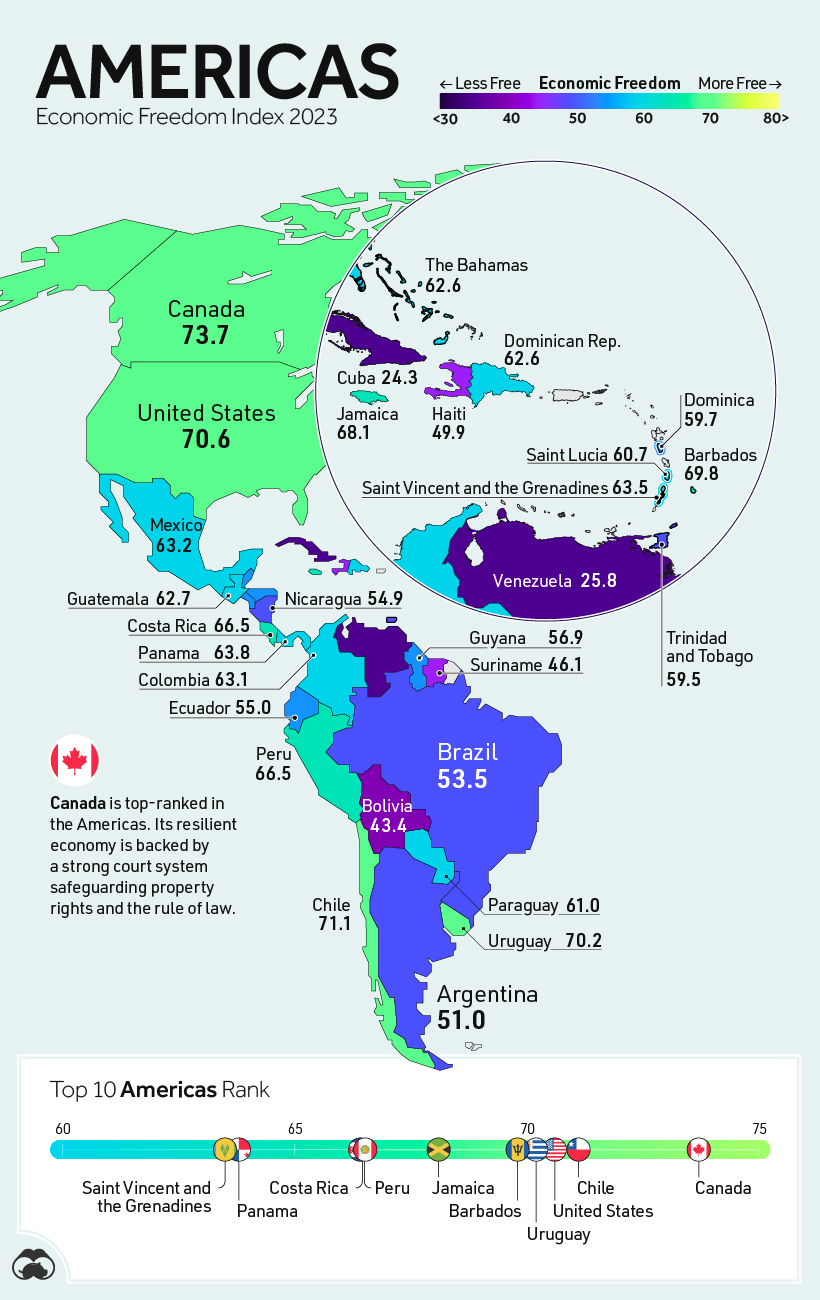
In the Americas, the United States ranks 3rd regionally—25th overall—with a score of 70.6. The report attributes the categorization of U.S. as only “mostly free” to issues like inflation, increasing government debt, and unchecked deficit spending. Public debt currently sits at a figure equivalent to more than 128% of GDP.
In South America, Chile comes out on top, ranking above many other economic powerhouses like the U.S., the UK, and Japan. However, the 2021 election of a new Constitutional Assembly could risk the current economic state, as it favors a much more socialist approach to the economy.
East Asia and Oceania
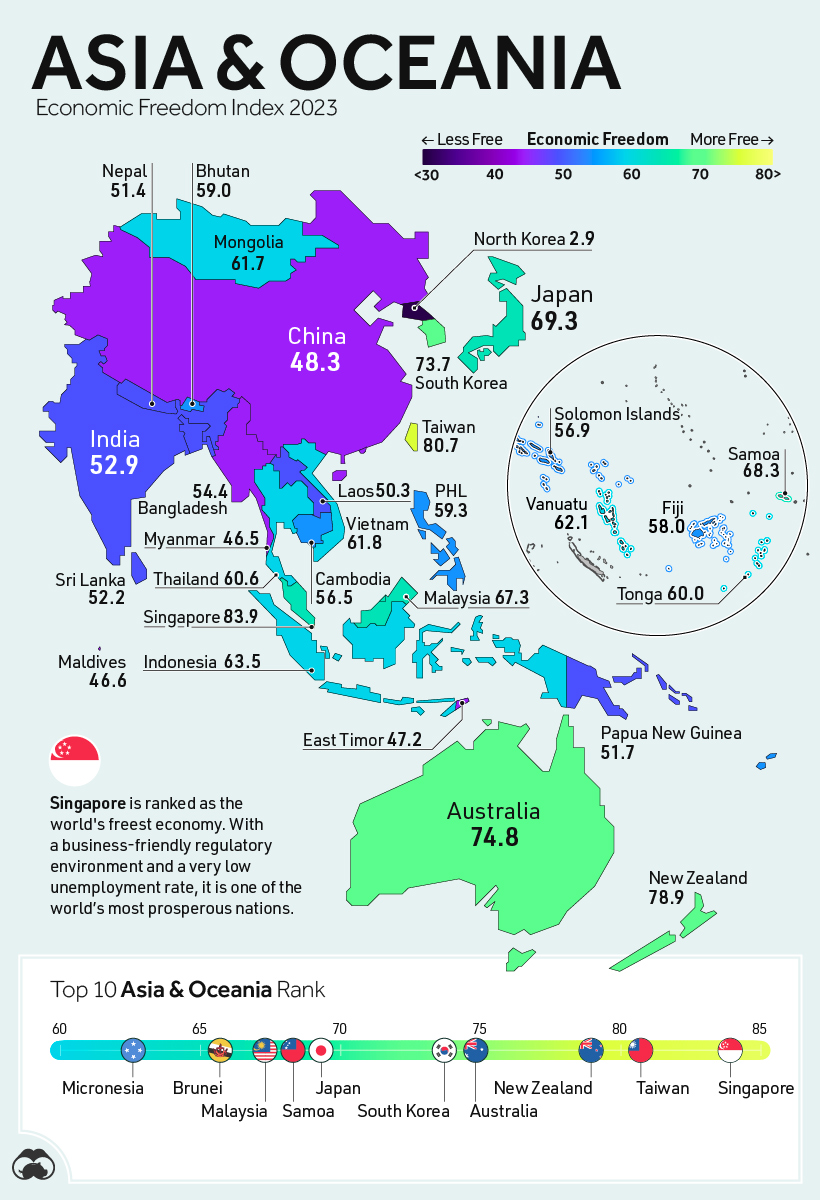
China’s score is among the lowest in East Asia & Oceania, ranking 154th in the world categorizing it as a repressed economy. The ruling Chinese Communist Party routinely exercises direct control over economic activity. China’s protectionist stance towards foreign investment and a plethora of trade tariffs imposed by other nations also factor in here.
In India, where public debt is equivalent to about 84% of GDP, fiscal health is the worst-scoring category. Additionally, much of the economy remains quite informal; a large share of people work in jobs without tax slips, recorded income, or formal contracts protecting them, which challenges labor freedoms.
The Middle East and Central Asia
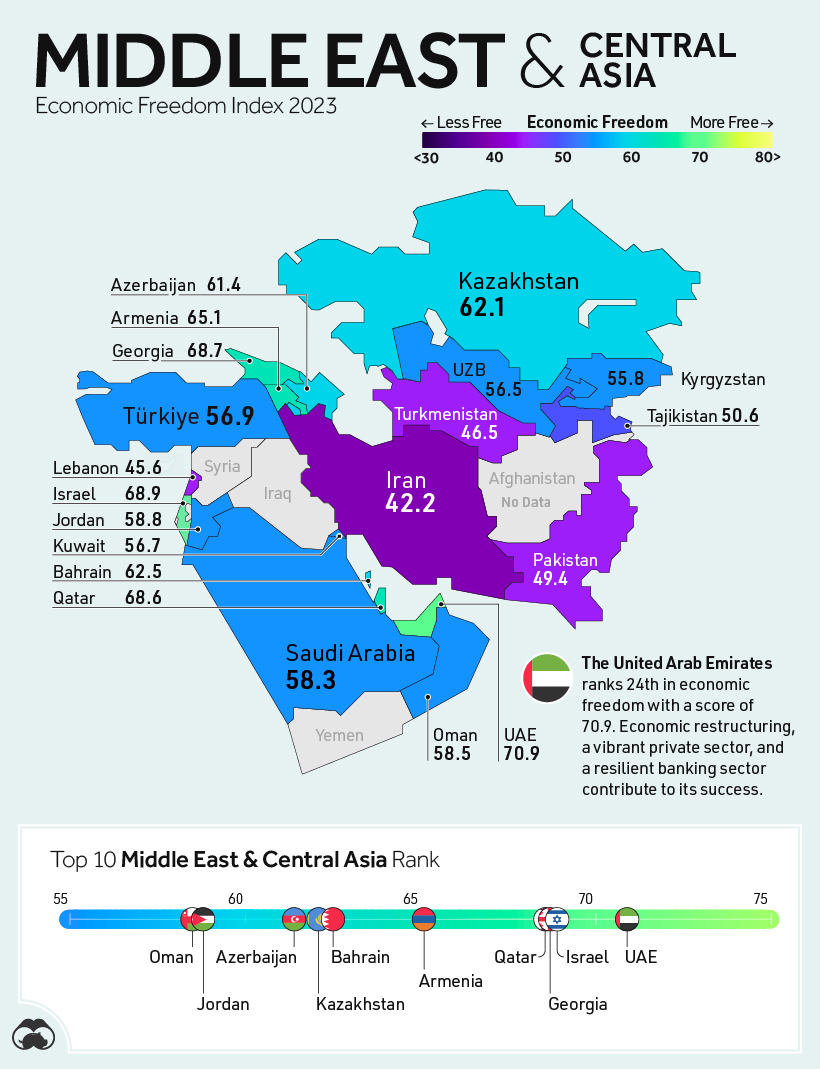
It may come as no surprise that the United Arab Emirates has the highest score in the Middle East. The UAE has implemented various measures and initiatives, such as tax exemptions, duty-free zones, streamlined business registration processes, and flexible regulatory frameworks to encourage entrepreneurship and foreign direct investment. As well, the top individual and corporate tax rates in the country are 0%.
Türkiye’s lowest scoring category relates to judiciary effectiveness and the rule of law. President Recep Tayyip Erdoğan, who has already been in power for two decades, recently won the country’s election, again cementing his authority over Turkish politics. This makes it unlikely that Türkiye’s economic freedom score will recover in the short to medium term.
Where Does This Data Come From?
Source: The Index of Economic Freedom from the Heritage Foundation
Data notes: A number of countries were not ranked due to unavailable data or other factors, like ongoing war, that made it difficult to properly assess the economy. These countries include: Ukraine, Afghanistan, Iraq, Libya, Liechtenstein, Somalia, Syria, and Yemen.


Markets
Visualizing Global Inflation Forecasts (2024-2026)
Here are IMF forecasts for global inflation rates up to 2026, highlighting a slow descent of price pressures amid resilient global growth.


Visualizing Global Inflation Forecasts (2024-2026)
Global inflation rates are gradually descending, but progress has been slow.
Today, the big question is if inflation will decline far enough to trigger easing monetary policy. So far, the Federal Reserve has held rates for nine months amid stronger than expected core inflation, which excludes volatile energy and food prices.
Yet looking further ahead, inflation forecasts from the International Monetary Fund (IMF) suggest that inflation will decline as price pressures ease, but the path of disinflation is not without its unknown risks.
This graphic shows global inflation forecasts, based on data from the April 2024 IMF World Economic Outlook.
Get the Key Insights of the IMF’s World Economic Outlook
Want a visual breakdown of the insights from the IMF’s 2024 World Economic Outlook report?
This visual is part of a special dispatch of the key takeaways exclusively for VC+ members.
Get the full dispatch of charts by signing up to VC+.
The IMF’s Inflation Outlook
Below, we show the IMF’s latest projections for global inflation rates through to 2026:
| Year | Global Inflation Rate (%) | Advanced Economies Inflation Rate (%) | Emerging Market and Developing Economies Inflation Rate (%) |
|---|---|---|---|
| 2019 | 3.5 | 1.4 | 5.1 |
| 2020 | 3.2 | 0.7 | 5.2 |
| 2021 | 4.7 | 3.1 | 5.9 |
| 2022 | 8.7 | 7.3 | 9.8 |
| 2023 | 6.8 | 4.6 | 8.3 |
| 2024 | 5.9 | 2.6 | 8.3 |
| 2025 | 4.5 | 2.0 | 6.2 |
| 2026 | 3.7 | 2.0 | 4.9 |
After hitting a peak of 8.7% in 2022, global inflation is projected to fall to 5.9% in 2024, reflecting promising inflation trends amid resilient global growth.
While inflation has largely declined due to falling energy and goods prices, persistently high services inflation poses challenges to mitigating price pressures. In addition, the IMF highlights the potential risk of an escalating conflict in the Middle East, which could lead to energy price shocks and higher shipping costs.
These developments could negatively affect inflation scenarios and prompt central banks to adopt tighter monetary policies. Overall, by 2026, global inflation is anticipated to decline to 3.7%—still notably above the 2% target set by several major economies.
Adding to this, we can see divergences in the path of inflation between advanced and emerging economies. While affluent nations are forecast to see inflation edge closer to the 2% target by 2026, emerging economies are projected to have inflation rates reach 4.9%—falling closer to their pre-pandemic averages.
Get the Full Analysis of the IMF’s Outlook on VC+
This visual is part of an exclusive special dispatch for VC+ members which breaks down the key takeaways from the IMF’s 2024 World Economic Outlook.
For the full set of charts and analysis, sign up for VC+.

-

 Culture7 days ago
The World’s Top Media Franchises by All-Time Revenue
-

 Science2 weeks ago
Visualizing the Average Lifespans of Mammals
-

 Brands2 weeks ago
How Tech Logos Have Evolved Over Time
-

 Energy2 weeks ago
Ranked: The Top 10 EV Battery Manufacturers in 2023
-

 Countries2 weeks ago
Countries With the Largest Happiness Gains Since 2010
-

 Economy2 weeks ago
VC+: Get Our Key Takeaways From the IMF’s World Economic Outlook
-

 Demographics2 weeks ago
The Countries That Have Become Sadder Since 2010
-

 Money2 weeks ago
Charted: Who Has Savings in This Economy?