Markets
America’s Most Valuable Company Every Year Since 1995
![]() See this visualization first on the Voronoi app.
See this visualization first on the Voronoi app.
America’s Most Valuable Company Every Year Since 1995
This was originally posted on our Voronoi app. Download the app for free on iOS or Android and discover incredible data-driven charts from a variety of trusted sources.
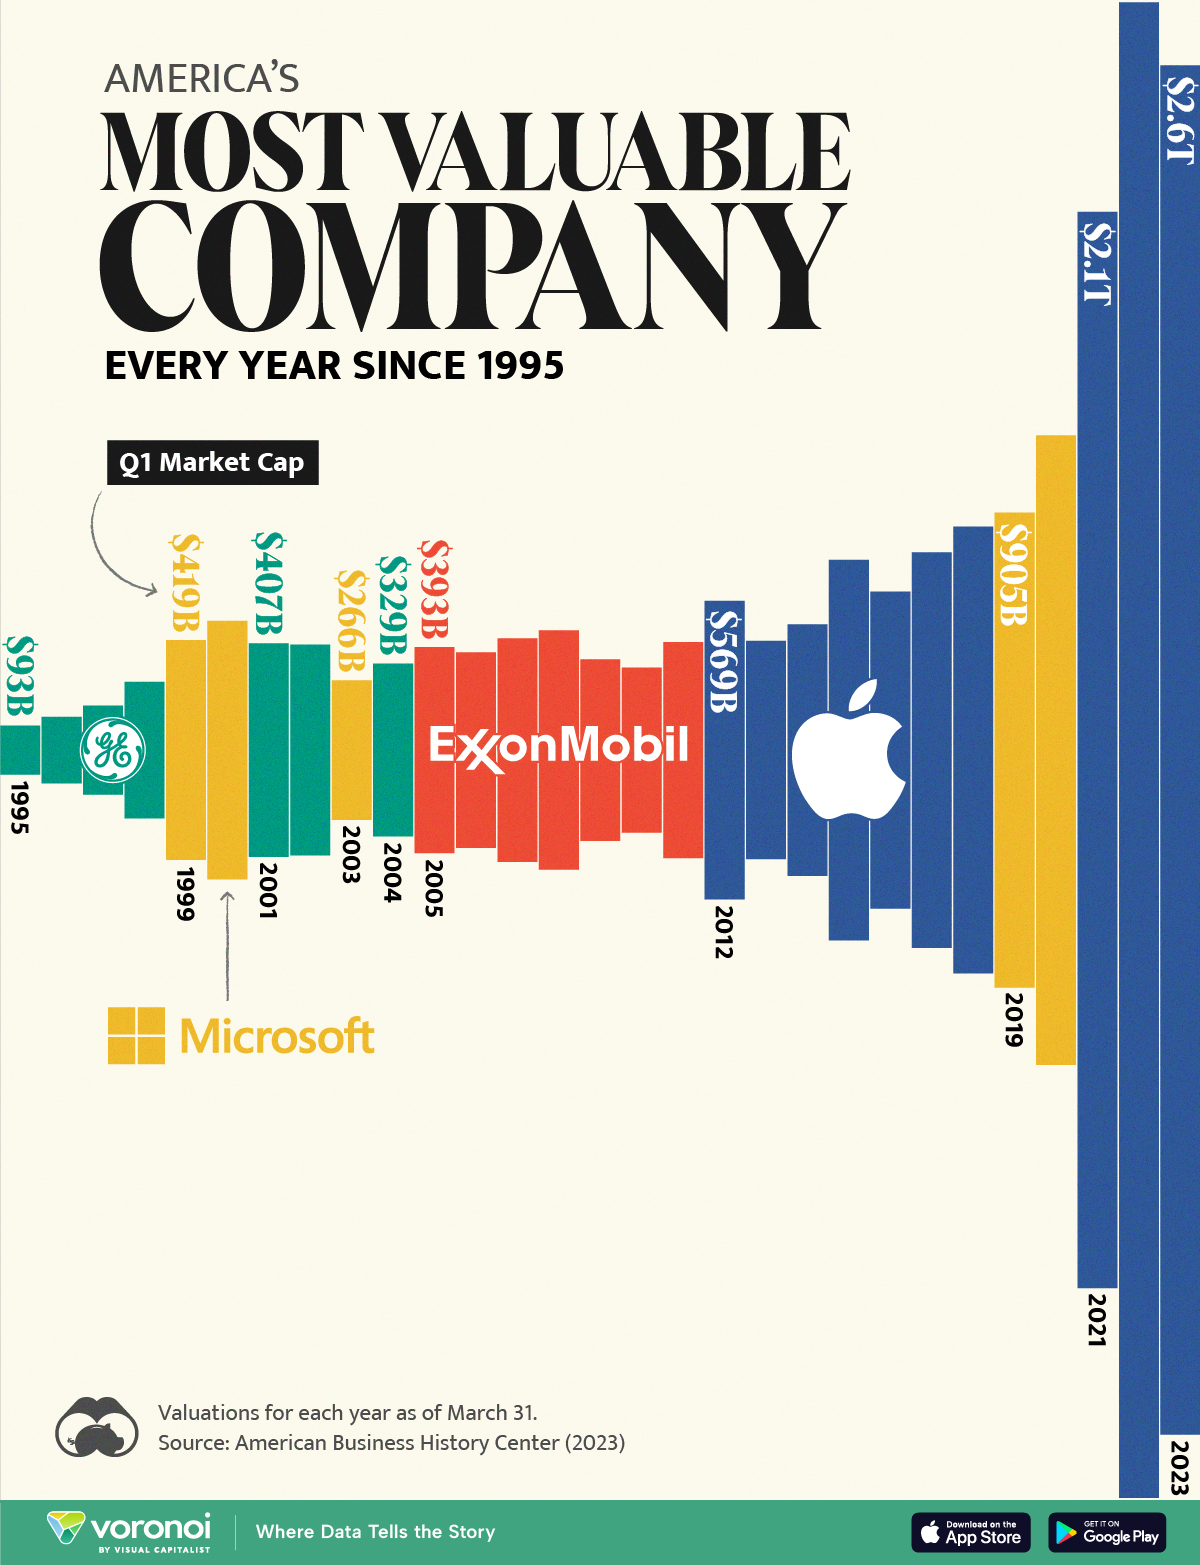
Over the last three decades, the growth of tech companies has driven a shift in the ranking of the most valuable companies in the United States.
In this graphic, we utilize data from the American Business History Center to present the history of America’s most valuable public company from 1995 to 2023. Valuations are for March 31 of that year, and are not adjusted for inflation.
The Surge of Tech Giants
In the early 1990s, the top rank was dominated by General Electric. The centenary company held a significant presence in the market with its various divisions, encompassing aerospace, power, renewable energy, digital industry, and finance.
In 1999, however, GE was surpassed by Microsoft. In that year, Bill Gates’ company launched its first online store, and Internet Explorer 5.0 was introduced, followed by more than 1 million downloads of the new version in less than a week.
| Year | Company | Market Cap (as of Q1) |
|---|---|---|
| 1995 | General Electric | $93,322 billion |
| 1996 | General Electric | $126,523 billion |
| 1997 | General Electric | $169,388 billion |
| 1998 | General Electric | $260,147 billion |
| 1999 | Microsoft | $418,579 billion |
| 2000 | Microsoft | $492,462 billion |
| 2001 | General Electric | $407,054 billion |
| 2002 | General Electric | $401,499 billion |
| 2003 | Microsoft | $266,037 billion |
| 2004 | General Electric | $329,240 billion |
| 2005 | ExxonMobil | $392,636 billion |
| 2006 | ExxonMobil | $372,792 billion |
| 2007 | ExxonMobil | $425,795 billion |
| 2008 | ExxonMobil | $455,929 billion |
| 2009 | ExxonMobil | $345,815 billion |
| 2010 | ExxonMobil | $314,154 billion |
| 2011 | ExxonMobil | $411,638 billion |
| 2012 | Apple | $568,615 billion |
| 2013 | Apple | $415,683 billion |
| 2014 | Apple | $479,069 billion |
| 2015 | Apple | $724,773 billion |
| 2016 | Apple | $604,304 billion |
| 2017 | Apple | $753,718 billion |
| 2018 | Apple | $851,318 billion |
| 2019 | Microsoft | $904,861 billion |
| 2020 | Microsoft | $1.199 trillion |
| 2021 | Apple | $2.050 trillion |
| 2022 | Apple | $2.849 trillion |
| 2023 | Apple | $2.609 trillion |
Both Microsoft and GE competed for the top spot from 2000 to 2004. However, after 2005, ExxonMobil held the position for seven years. Following the 1998 Exxon and Mobil $74 billion merger agreement, the largest oil company in the world benefited from increasing gas prices over that period.
Since 2012, however, the ranking has been dominated by Apple. Boosted by the success of its iPhone line, its biggest cash cow, the company was only behind Microsoft in 2019 and 2020 when concerns about COVID-driven supply chain shortages affected the iPhone maker’s stock price.
More recently, Microsoft briefly overtook Apple as the world’s most valuable company in January 2024, after the iPhone maker’s shares had a weak start to the year due to growing concerns over demand in China.
Meanwhile, Microsoft’s shares rose sharply thanks to the early lead the company had taken in generative artificial intelligence through an investment in ChatGPT-maker OpenAI.


Markets
The European Stock Market: Attractive Valuations Offer Opportunities
On average, the European stock market has valuations that are nearly 50% lower than U.S. valuations. But how can you access the market?


European Stock Market: Attractive Valuations Offer Opportunities
Europe is known for some established brands, from L’Oréal to Louis Vuitton. However, the European stock market offers additional opportunities that may be lesser known.
The above infographic, sponsored by STOXX, outlines why investors may want to consider European stocks.
Attractive Valuations
Compared to most North American and Asian markets, European stocks offer lower or comparable valuations.
| Index | Price-to-Earnings Ratio | Price-to-Book Ratio |
|---|---|---|
| EURO STOXX 50 | 14.9 | 2.2 |
| STOXX Europe 600 | 14.4 | 2 |
| U.S. | 25.9 | 4.7 |
| Canada | 16.1 | 1.8 |
| Japan | 15.4 | 1.6 |
| Asia Pacific ex. China | 17.1 | 1.8 |
Data as of February 29, 2024. See graphic for full index names. Ratios based on trailing 12 month financials. The price to earnings ratio excludes companies with negative earnings.
On average, European valuations are nearly 50% lower than U.S. valuations, potentially offering an affordable entry point for investors.
Research also shows that lower price ratios have historically led to higher long-term returns.
Market Movements Not Closely Connected
Over the last decade, the European stock market had low-to-moderate correlation with North American and Asian equities.
The below chart shows correlations from February 2014 to February 2024. A value closer to zero indicates low correlation, while a value of one would indicate that two regions are moving in perfect unison.
| EURO STOXX 50 | STOXX EUROPE 600 | U.S. | Canada | Japan | Asia Pacific ex. China |
|
|---|---|---|---|---|---|---|
| EURO STOXX 50 | 1.00 | 0.97 | 0.55 | 0.67 | 0.24 | 0.43 |
| STOXX EUROPE 600 | 1.00 | 0.56 | 0.71 | 0.28 | 0.48 | |
| U.S. | 1.00 | 0.73 | 0.12 | 0.25 | ||
| Canada | 1.00 | 0.22 | 0.40 | |||
| Japan | 1.00 | 0.88 | ||||
| Asia Pacific ex. China | 1.00 |
Data is based on daily USD returns.
European equities had relatively independent market movements from North American and Asian markets. One contributing factor could be the differing sector weights in each market. For instance, technology makes up a quarter of the U.S. market, but health care and industrials dominate the broader European market.
Ultimately, European equities can enhance portfolio diversification and have the potential to mitigate risk for investors.
Tracking the Market
For investors interested in European equities, STOXX offers a variety of flagship indices:
| Index | Description | Market Cap |
|---|---|---|
| STOXX Europe 600 | Pan-regional, broad market | €10.5T |
| STOXX Developed Europe | Pan-regional, broad-market | €9.9T |
| STOXX Europe 600 ESG-X | Pan-regional, broad market, sustainability focus | €9.7T |
| STOXX Europe 50 | Pan-regional, blue-chip | €5.1T |
| EURO STOXX 50 | Eurozone, blue-chip | €3.5T |
Data is as of February 29, 2024. Market cap is free float, which represents the shares that are readily available for public trading on stock exchanges.
The EURO STOXX 50 tracks the Eurozone’s biggest and most traded companies. It also underlies one of the world’s largest ranges of ETFs and mutual funds. As of November 2023, there were €27.3 billion in ETFs and €23.5B in mutual fund assets under management tracking the index.
“For the past 25 years, the EURO STOXX 50 has served as an accurate, reliable and tradable representation of the Eurozone equity market.”
— Axel Lomholt, General Manager at STOXX
Partnering with STOXX to Track the European Stock Market
Are you interested in European equities? STOXX can be a valuable partner:
- Comprehensive, liquid and investable ecosystem
- European heritage, global reach
- Highly sophisticated customization capabilities
- Open architecture approach to using data
- Close partnerships with clients
- Part of ISS STOXX and Deutsche Börse Group
With a full suite of indices, STOXX can help you benchmark against the European stock market.
Learn how STOXX’s European indices offer liquid and effective market access.

-

 Economy3 days ago
Economic Growth Forecasts for G7 and BRICS Countries in 2024
The IMF has released its economic growth forecasts for 2024. How do the G7 and BRICS countries compare?
-

 Markets2 weeks ago
U.S. Debt Interest Payments Reach $1 Trillion
U.S. debt interest payments have surged past the $1 trillion dollar mark, amid high interest rates and an ever-expanding debt burden.
-

 United States2 weeks ago
Ranked: The Largest U.S. Corporations by Number of Employees
We visualized the top U.S. companies by employees, revealing the massive scale of retailers like Walmart, Target, and Home Depot.
-

 Markets2 weeks ago
The Top 10 States by Real GDP Growth in 2023
This graphic shows the states with the highest real GDP growth rate in 2023, largely propelled by the oil and gas boom.
-

 Markets3 weeks ago
Ranked: The World’s Top Flight Routes, by Revenue
In this graphic, we show the highest earning flight routes globally as air travel continued to rebound in 2023.
-

 Markets3 weeks ago
Ranked: The Most Valuable Housing Markets in America
The U.S. residential real estate market is worth a staggering $47.5 trillion. Here are the most valuable housing markets in the country.

-

 Sports1 week ago
The Highest Earning Athletes in Seven Professional Sports
-

 Countries2 weeks ago
Population Projections: The World’s 6 Largest Countries in 2075
-
Markets2 weeks ago
The Top 10 States by Real GDP Growth in 2023
-

 Demographics2 weeks ago
The Smallest Gender Wage Gaps in OECD Countries
-

 United States2 weeks ago
Where U.S. Inflation Hit the Hardest in March 2024
-

 Green2 weeks ago
Top Countries By Forest Growth Since 2001
-
United States2 weeks ago
Ranked: The Largest U.S. Corporations by Number of Employees
-

 Maps2 weeks ago
The Largest Earthquakes in the New York Area (1970-2024)