Energy
Explainer: What Drives Gasoline Prices?
![]() Subscribe to the Elements free mailing list for more like this
Subscribe to the Elements free mailing list for more like this
What Drives Gasoline Prices?
This was originally posted on Elements. Sign up to the free mailing list to get beautiful visualizations on natural resource megatrends in your email every week.
Across the United States, the cost of gas has been a hot topic of conversation lately, as prices reach record-breaking highs.
The national average now sits at $5.00 per gallon, and by the end of summer, this figure could grow to $6 per gallon, according to estimates by JPMorgan.
But before we can have an understanding of what’s happening at the pump, it’s important to first know what key factors influence gasoline prices.
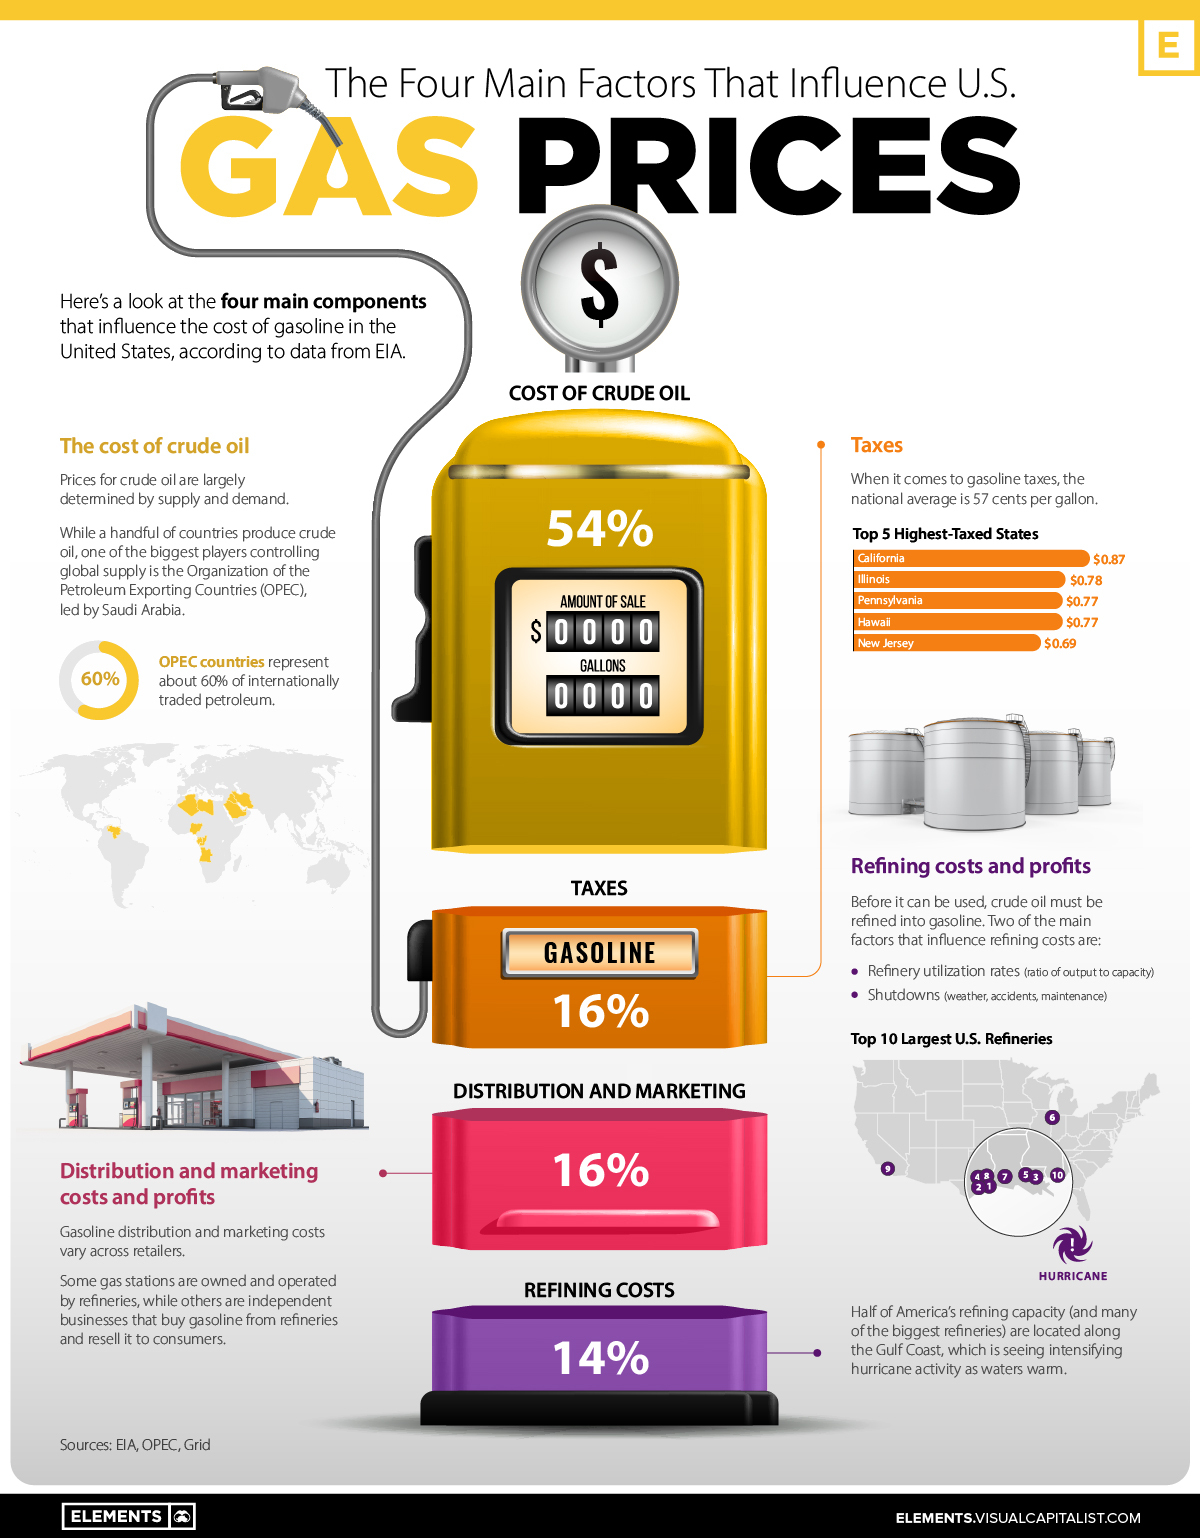
This graphic, using data from the U.S. Energy Information Administration (EIA), outlines the main components that influence gasoline prices, providing each factor’s proportional impact on price.
The Four Main Factors
According to the EIA, there are four main factors that influence the price of gas:
- Crude oil prices (54%)
- Refining costs (14%)
- Taxes (16%)
- Distribution, and marketing costs (16%)
More than half the cost of filling your tank is influenced by the price of crude oil. Meanwhile, the rest of the price at the pump is split fairly equally between refining costs, marketing and distribution, and taxes.
Let’s look at each factor in more depth.
Crude Oil Prices
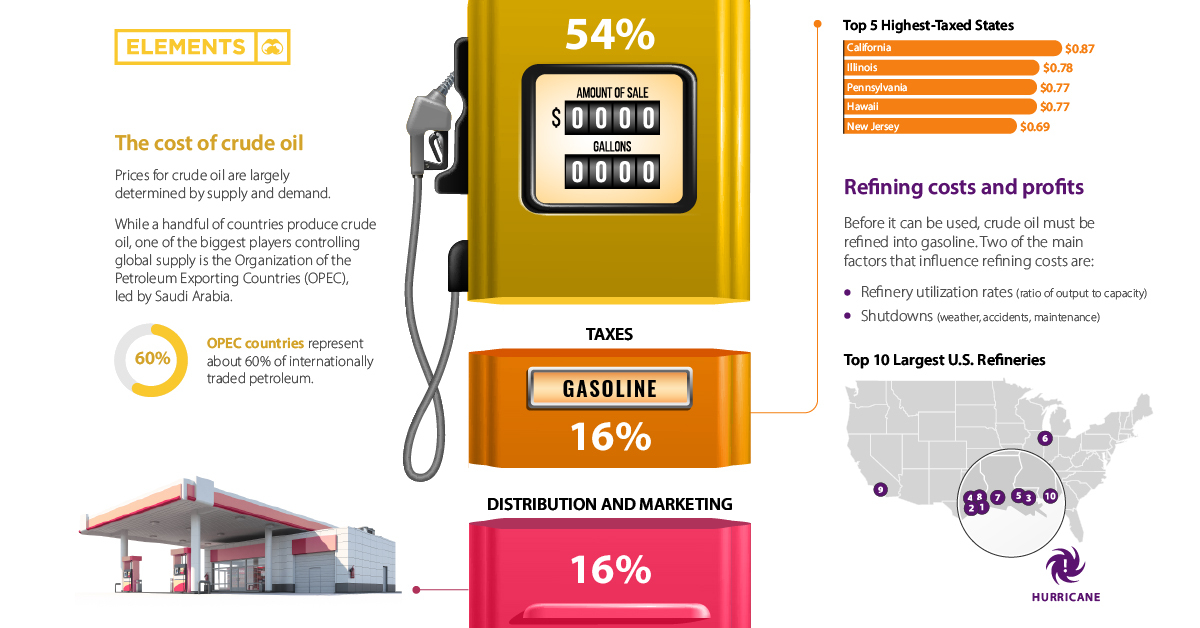
The most influential factor is the cost of crude oil, which is largely dictated by international supply and demand.
Despite being the world’s largest oil producer, the U.S. remains a net importer of crude oil, with the majority coming from Canada, Mexico, and Saudi Arabia. Because of America’s reliance on imports, U.S. gas prices are largely influenced by the global crude oil market.
A number of geopolitical factors can influence the crude oil market, but one of the biggest influences is the Organization of the Petroleum Exporting Countries (OPEC), led by Saudi Arabia.
Established in 1960, OPEC was created to combat U.S. dominance of the global oil market. OPEC sets production targets for its 13 member countries, and historically, oil prices have been linked to changes in OPEC production. Today, OPEC countries are responsible for about 60% of internationally traded petroleum.
Refining Costs
Oil needs to be refined into gasoline before it can be used by consumers, which is why refining costs are factored into the price of gas.
The U.S. has hundreds of refineries across the country. The country’s largest refinery, owned by the Saudi Arabian company Saudi Aramco, processes around 607,000 barrels of oil per day.
The exact cost of refining varies, depending on a number of factors such as the type of crude oil used, the processing technology available at the refinery, and the gasoline requirements in specific parts of the country.
In general, refining capacity in the U.S. has not been keeping up with oil demand. Several refineries shut down throughout the pandemic, but even before COVID-19, refining capacity in the U.S. was lagging behind demand. Incredibly, there haven’t been any brand-new refining facilities built in the country since 1977.
Taxes
In the U.S., taxes also play a critical role in determining the price of gas.
Across America, the average gasoline tax is $0.57 per gallon, however, the exact amount fluctuates from state to state. Here’s a look at the top five states with the highest gas taxes:
| Rank | State | Gas tax (per gallon) |
|---|---|---|
| 1 | California | $0.87 |
| 2 | Illinois | $0.78 |
| 3 | Pennsylvania | $0.77 |
| 4 | Hawaii | $0.77 |
| 5 | New Jersey | $0.69 |
*Note: figures include both state and federal tax
States with high gas taxes usually spend the extra money on improvements to their infrastructure or local transportation. For instance, Illinois doubled its gas taxes in 2019 as part of a $45 billion infrastructure plan.
California, the state with the highest tax on gas, is expecting to see a rate increase this July, which will drive gas prices up by around three cents per gallon.
Distribution and Marketing Costs
Lastly, the costs of distribution and marketing have an impact on the price of gas.
Gasoline is typically shipped from refineries to local terminals via pipelines. From there, the gasoline is processed further to ensure it meets market requirements or local government standards.
Gas stations then distribute the final product to the consumer. The cost of running a gas station varies—some gas stations are owned and operated by brand-name refineries like Chevron, while others are smaller-scale operations owned by independent merchants.
The big-name brands run a lot of advertisements. According to Morning Consult, Chevron, BP PLC, Exxon Mobil Corp., and Royal Dutch Shell PLC aired TV advertisements in the U.S. more than 44,495 times between June 1, 2020, and Aug. 31, 2021.
How Does the Russia-Ukraine Conflict Impact U.S. Gas Prices?
If only a fraction of America’s oil comes from Russia, why is the Russia-Ukraine conflict impacting prices in the U.S.?
Because oil is bought and sold on a global commodities market. So, when countries imposed sanctions on Russian oil, that put a squeeze on global supply, which ultimately drove up prices.
This supply shock could keep prices high for a while unless the U.S. falls into a recession, which is a growing possibility based on how recent data is trending.


Energy
Charted: 4 Reasons Why Lithium Could Be the Next Gold Rush
Visual Capitalist has partnered with EnergyX to show why drops in prices and growing demand may make now the right time to invest in lithium.


4 Reasons Why You Should Invest in Lithium
Lithium’s importance in powering EVs makes it a linchpin of the clean energy transition and one of the world’s most precious minerals.
In this graphic, Visual Capitalist partnered with EnergyX to explore why now may be the time to invest in lithium.
1. Lithium Prices Have Dropped
One of the most critical aspects of evaluating an investment is ensuring that the asset’s value is higher than its price would indicate. Lithium is integral to powering EVs, and, prices have fallen fast over the last year:
| Date | LiOH·H₂O* | Li₂CO₃** |
|---|---|---|
| Feb 2023 | $76 | $71 |
| March 2023 | $71 | $61 |
| Apr 2023 | $43 | $33 |
| May 2023 | $43 | $33 |
| June 2023 | $47 | $45 |
| July 2023 | $44 | $40 |
| Aug 2023 | $35 | $35 |
| Sept 2023 | $28 | $27 |
| Oct 2023 | $24 | $23 |
| Nov 2023 | $21 | $21 |
| Dec 2023 | $17 | $16 |
| Jan 2024 | $14 | $15 |
| Feb 2024 | $13 | $14 |
Note: Monthly spot prices were taken as close to the 14th of each month as possible.
*Lithium hydroxide monohydrate MB-LI-0033
**Lithium carbonate MB-LI-0029
2. Lithium-Ion Battery Prices Are Also Falling
The drop in lithium prices is just one reason to invest in the metal. Increasing economies of scale, coupled with low commodity prices, have caused the cost of lithium-ion batteries to drop significantly as well.
In fact, BNEF reports that between 2013 and 2023, the price of a Li-ion battery dropped by 82%.
| Year | Price per KWh |
|---|---|
| 2023 | $139 |
| 2022 | $161 |
| 2021 | $150 |
| 2020 | $160 |
| 2019 | $183 |
| 2018 | $211 |
| 2017 | $258 |
| 2016 | $345 |
| 2015 | $448 |
| 2014 | $692 |
| 2013 | $780 |

3. EV Adoption is Sustainable
One of the best reasons to invest in lithium is that EVs, one of the main drivers behind the demand for lithium, have reached a price point similar to that of traditional vehicle.
According to the Kelly Blue Book, Tesla’s average transaction price dropped by 25% between 2022 and 2023, bringing it in line with many other major manufacturers and showing that EVs are a realistic transport option from a consumer price perspective.
| Manufacturer | September 2022 | September 2023 |
|---|---|---|
| BMW | $69,000 | $72,000 |
| Ford | $54,000 | $56,000 |
| Volkswagon | $54,000 | $56,000 |
| General Motors | $52,000 | $53,000 |
| Tesla | $68,000 | $51,000 |
4. Electricity Demand in Transport is Growing
As EVs become an accessible transport option, there’s an investment opportunity in lithium. But possibly the best reason to invest in lithium is that the IEA reports global demand for the electricity in transport could grow dramatically by 2030:
| Transport Type | 2022 | 2025 | 2030 |
|---|---|---|---|
| Buses 🚌 | 23,000 GWh | 50,000 GWh | 130,000 GWh |
| Cars 🚙 | 65,000 GWh | 200,000 GWh | 570,000 GWh |
| Trucks 🛻 | 4,000 GWh | 15,000 GWh | 94,000 GWh |
| Vans 🚐 | 6,000 GWh | 16,000 GWh | 72,000 GWh |
The Lithium Investment Opportunity
Lithium presents a potentially classic investment opportunity. Lithium and battery prices have dropped significantly, and recently, EVs have reached a price point similar to other vehicles. By 2030, the demand for clean energy, especially in transport, will grow dramatically.
With prices dropping and demand skyrocketing, now is the time to invest in lithium.
EnergyX is poised to exploit lithium demand with cutting-edge lithium extraction technology capable of extracting 300% more lithium than current processes.

-

 Lithium5 days ago
Ranked: The Top 10 EV Battery Manufacturers in 2023
Asia dominates this ranking of the world’s largest EV battery manufacturers in 2023.
-

 Energy1 week ago
The World’s Biggest Nuclear Energy Producers
China has grown its nuclear capacity over the last decade, now ranking second on the list of top nuclear energy producers.
-

 Energy1 month ago
The World’s Biggest Oil Producers in 2023
Just three countries accounted for 40% of global oil production last year.
-

 Energy1 month ago
How Much Does the U.S. Depend on Russian Uranium?
Currently, Russia is the largest foreign supplier of nuclear power fuel to the U.S.
-

 Uranium2 months ago
Charted: Global Uranium Reserves, by Country
We visualize the distribution of the world’s uranium reserves by country, with 3 countries accounting for more than half of total reserves.
-

 Energy3 months ago
Visualizing the Rise of the U.S. as Top Crude Oil Producer
Over the last decade, the United States has established itself as the world’s top producer of crude oil, surpassing Saudi Arabia and Russia.


-

 Science1 week ago
Visualizing the Average Lifespans of Mammals
-

 Markets2 weeks ago
The Top 10 States by Real GDP Growth in 2023
-

 Demographics2 weeks ago
The Smallest Gender Wage Gaps in OECD Countries
-

 United States2 weeks ago
Where U.S. Inflation Hit the Hardest in March 2024
-

 Green2 weeks ago
Top Countries By Forest Growth Since 2001
-

 United States2 weeks ago
Ranked: The Largest U.S. Corporations by Number of Employees
-

 Maps2 weeks ago
The Largest Earthquakes in the New York Area (1970-2024)
-

 Green2 weeks ago
Ranked: The Countries With the Most Air Pollution in 2023