Energy
What Are the Five Major Types of Renewable Energy?
![]() Subscribe to the Elements free mailing list for more like this
Subscribe to the Elements free mailing list for more like this
 Can I share this graphic?
 When do I need a license?
 Interested in this piece?
The Renewable Energy Age
This was originally posted on Elements. Sign up to the free mailing list to get beautiful visualizations on natural resource megatrends in your email every week.
Awareness around climate change is shaping the future of the global economy in several ways.
Governments are planning how to reduce emissions, investors are scrutinizing companies’ environmental performance, and consumers are becoming conscious of their carbon footprints. But no matter the stakeholder, energy generation and consumption from fossil fuels is one of the biggest contributors to emissions.
Therefore, renewable energy sources have never been more top-of-mind than they are today.
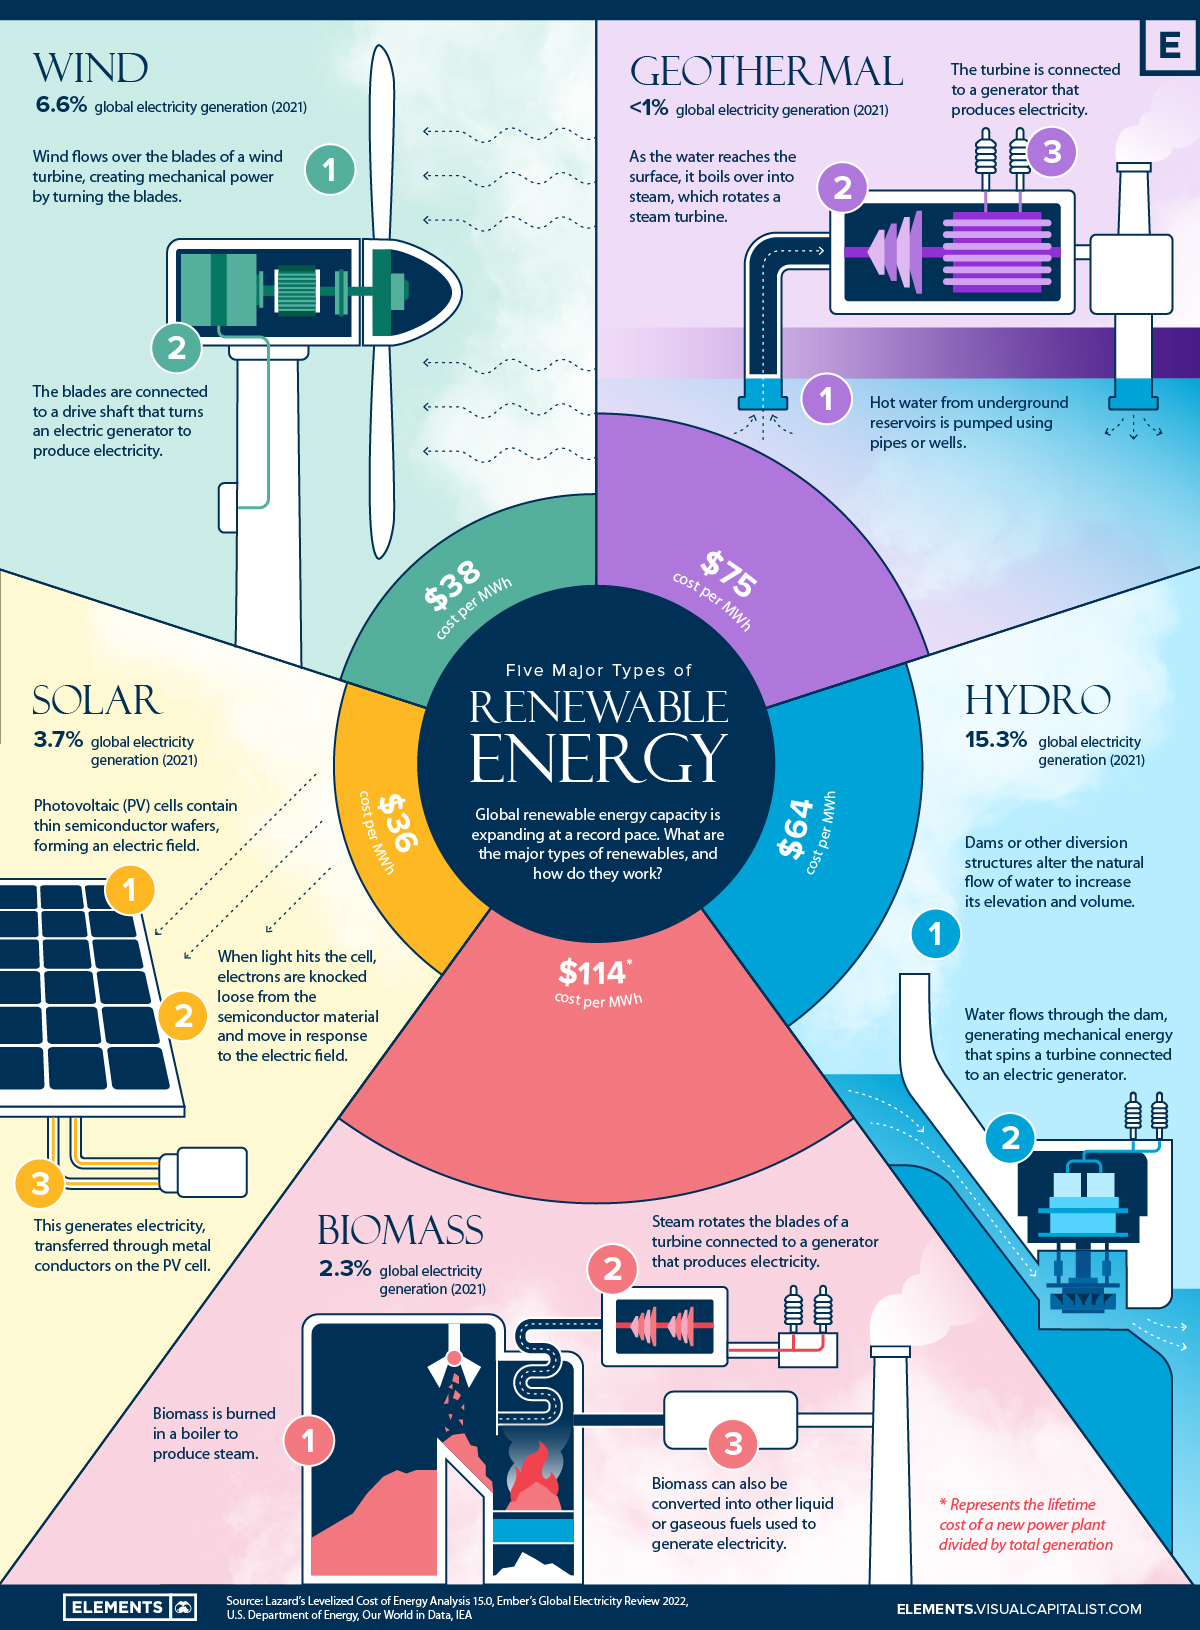
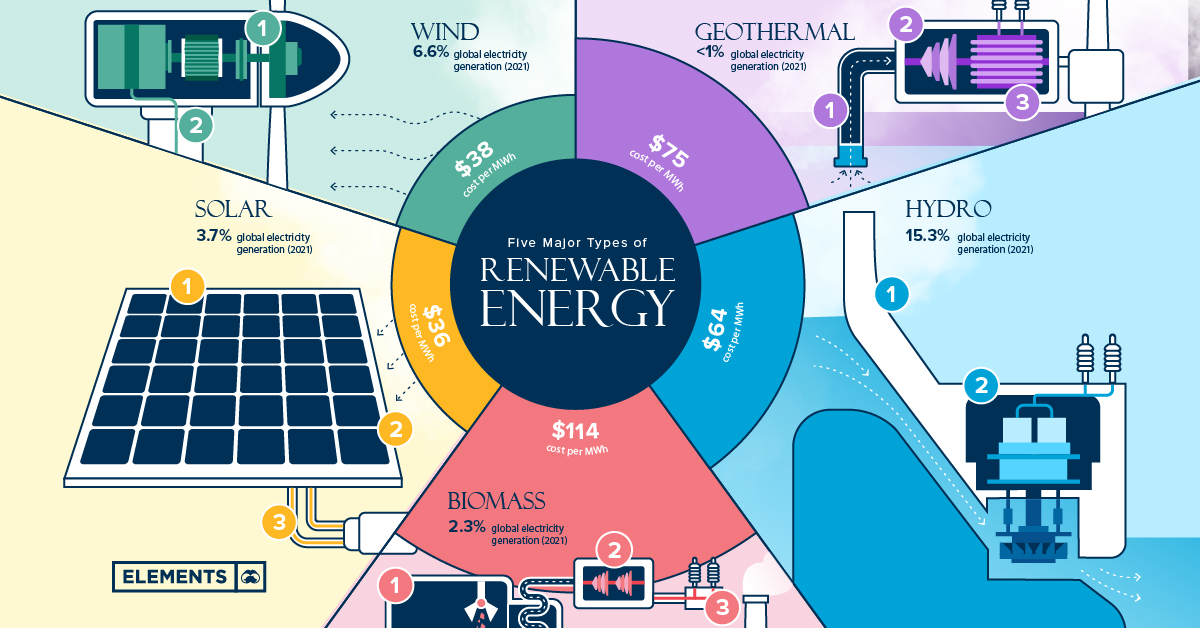
The Five Types of Renewable Energy
Renewable energy technologies harness the power of the sun, wind, and heat from the Earth’s core, and then transforms it into usable forms of energy like heat, electricity, and fuel.
The above infographic uses data from Lazard, Ember, and other sources to outline everything you need to know about the five key types of renewable energy:
| Energy Source | % of 2021 Global Electricity Generation | Avg. levelized cost of energy per MWh |
|---|---|---|
| Hydro 💧 | 15.3% | $64 |
| Wind 🌬 | 6.6% | $38 |
| Solar ☀️ | 3.7% | $36 |
| Biomass 🌱 | 2.3% | $114 |
| Geothermal ♨️ | <1% | $75 |
Editor’s note: We have excluded nuclear from the mix here, because although it is often defined as a sustainable energy source, it is not technically renewable (i.e. there are finite amounts of uranium).
Though often out of the limelight, hydro is the largest renewable electricity source, followed by wind and then solar.
Together, the five main sources combined for roughly 28% of global electricity generation in 2021, with wind and solar collectively breaking the 10% share barrier for the first time.
The levelized cost of energy (LCOE) measures the lifetime costs of a new utility-scale plant divided by total electricity generation. The LCOE of solar and wind is almost one-fifth that of coal ($167/MWh), meaning that new solar and wind plants are now much cheaper to build and operate than new coal plants over a longer time horizon.
With this in mind, here’s a closer look at the five types of renewable energy and how they work.
1. Wind
Wind turbines use large rotor blades, mounted at tall heights on both land and sea, to capture the kinetic energy created by wind.
When wind flows across the blade, the air pressure on one side of the blade decreases, pulling it down with a force described as the lift. The difference in air pressure across the two sides causes the blades to rotate, spinning the rotor.
The rotor is connected to a turbine generator, which spins to convert the wind’s kinetic energy into electricity.
2. Solar (Photovoltaic)
Solar technologies capture light or electromagnetic radiation from the sun and convert it into electricity.
Photovoltaic (PV) solar cells contain a semiconductor wafer, positive on one side and negative on the other, forming an electric field. When light hits the cell, the semiconductor absorbs the sunlight and transfers the energy in the form of electrons. These electrons are captured by the electric field in the form of an electric current.
A solar system’s ability to generate electricity depends on the semiconductor material, along with environmental conditions like heat, dirt, and shade.
3. Geothermal
Geothermal energy originates straight from the Earth’s core—heat from the core boils underground reservoirs of water, known as geothermal resources.
Geothermal plants typically use wells to pump hot water from geothermal resources and convert it into steam for a turbine generator. The extracted water and steam can then be reinjected, making it a renewable energy source.
4. Hydropower
Similar to wind turbines, hydropower plants channel the kinetic energy from flowing water into electricity by using a turbine generator.
Hydro plants are typically situated near bodies of water and use diversion structures like dams to change the flow of water. Power generation depends on the volume and change in elevation or head of the flowing water.
Greater water volumes and higher heads produce more energy and electricity, and vice versa.
5. Biomass
Humans have likely used energy from biomass or bioenergy for heat ever since our ancestors learned how to build fires.
Biomass—organic material like wood, dry leaves, and agricultural waste—is typically burned but considered renewable because it can be regrown or replenished. Burning biomass in a boiler produces high-pressure steam, which rotates a turbine generator to produce electricity.
Biomass is also converted into liquid or gaseous fuels for transportation. However, emissions from biomass vary with the material combusted and are often higher than other clean sources.
When Will Renewable Energy Take Over?
Despite the recent growth of renewables, fossil fuels still dominate the global energy mix.
Most countries are in the early stages of the energy transition, and only a handful get significant portions of their electricity from clean sources. However, the ongoing decade might see even more growth than recent record-breaking years.
The IEA forecasts that, by 2026, global renewable electricity capacity is set to grow by 60% from 2020 levels to over 4,800 gigawatts—equal to the current power output of fossil fuels and nuclear combined. So, regardless of when renewables will take over, it’s clear that the global energy economy will continue changing.


Energy
Charted: 4 Reasons Why Lithium Could Be the Next Gold Rush
Visual Capitalist has partnered with EnergyX to show why drops in prices and growing demand may make now the right time to invest in lithium.


4 Reasons Why You Should Invest in Lithium
Lithium’s importance in powering EVs makes it a linchpin of the clean energy transition and one of the world’s most precious minerals.
In this graphic, Visual Capitalist partnered with EnergyX to explore why now may be the time to invest in lithium.
1. Lithium Prices Have Dropped
One of the most critical aspects of evaluating an investment is ensuring that the asset’s value is higher than its price would indicate. Lithium is integral to powering EVs, and, prices have fallen fast over the last year:
| Date | LiOH·H₂O* | Li₂CO₃** |
|---|---|---|
| Feb 2023 | $76 | $71 |
| March 2023 | $71 | $61 |
| Apr 2023 | $43 | $33 |
| May 2023 | $43 | $33 |
| June 2023 | $47 | $45 |
| July 2023 | $44 | $40 |
| Aug 2023 | $35 | $35 |
| Sept 2023 | $28 | $27 |
| Oct 2023 | $24 | $23 |
| Nov 2023 | $21 | $21 |
| Dec 2023 | $17 | $16 |
| Jan 2024 | $14 | $15 |
| Feb 2024 | $13 | $14 |
Note: Monthly spot prices were taken as close to the 14th of each month as possible.
*Lithium hydroxide monohydrate MB-LI-0033
**Lithium carbonate MB-LI-0029
2. Lithium-Ion Battery Prices Are Also Falling
The drop in lithium prices is just one reason to invest in the metal. Increasing economies of scale, coupled with low commodity prices, have caused the cost of lithium-ion batteries to drop significantly as well.
In fact, BNEF reports that between 2013 and 2023, the price of a Li-ion battery dropped by 82%.
| Year | Price per KWh |
|---|---|
| 2023 | $139 |
| 2022 | $161 |
| 2021 | $150 |
| 2020 | $160 |
| 2019 | $183 |
| 2018 | $211 |
| 2017 | $258 |
| 2016 | $345 |
| 2015 | $448 |
| 2014 | $692 |
| 2013 | $780 |

3. EV Adoption is Sustainable
One of the best reasons to invest in lithium is that EVs, one of the main drivers behind the demand for lithium, have reached a price point similar to that of traditional vehicle.
According to the Kelly Blue Book, Tesla’s average transaction price dropped by 25% between 2022 and 2023, bringing it in line with many other major manufacturers and showing that EVs are a realistic transport option from a consumer price perspective.
| Manufacturer | September 2022 | September 2023 |
|---|---|---|
| BMW | $69,000 | $72,000 |
| Ford | $54,000 | $56,000 |
| Volkswagon | $54,000 | $56,000 |
| General Motors | $52,000 | $53,000 |
| Tesla | $68,000 | $51,000 |
4. Electricity Demand in Transport is Growing
As EVs become an accessible transport option, there’s an investment opportunity in lithium. But possibly the best reason to invest in lithium is that the IEA reports global demand for the electricity in transport could grow dramatically by 2030:
| Transport Type | 2022 | 2025 | 2030 |
|---|---|---|---|
| Buses 🚌 | 23,000 GWh | 50,000 GWh | 130,000 GWh |
| Cars 🚙 | 65,000 GWh | 200,000 GWh | 570,000 GWh |
| Trucks 🛻 | 4,000 GWh | 15,000 GWh | 94,000 GWh |
| Vans 🚐 | 6,000 GWh | 16,000 GWh | 72,000 GWh |
The Lithium Investment Opportunity
Lithium presents a potentially classic investment opportunity. Lithium and battery prices have dropped significantly, and recently, EVs have reached a price point similar to other vehicles. By 2030, the demand for clean energy, especially in transport, will grow dramatically.
With prices dropping and demand skyrocketing, now is the time to invest in lithium.
EnergyX is poised to exploit lithium demand with cutting-edge lithium extraction technology capable of extracting 300% more lithium than current processes.

-

 Lithium5 days ago
Ranked: The Top 10 EV Battery Manufacturers in 2023
Asia dominates this ranking of the world’s largest EV battery manufacturers in 2023.
-

 Energy1 week ago
The World’s Biggest Nuclear Energy Producers
China has grown its nuclear capacity over the last decade, now ranking second on the list of top nuclear energy producers.
-

 Energy1 month ago
The World’s Biggest Oil Producers in 2023
Just three countries accounted for 40% of global oil production last year.
-

 Energy1 month ago
How Much Does the U.S. Depend on Russian Uranium?
Currently, Russia is the largest foreign supplier of nuclear power fuel to the U.S.
-

 Uranium2 months ago
Charted: Global Uranium Reserves, by Country
We visualize the distribution of the world’s uranium reserves by country, with 3 countries accounting for more than half of total reserves.
-

 Energy3 months ago
Visualizing the Rise of the U.S. as Top Crude Oil Producer
Over the last decade, the United States has established itself as the world’s top producer of crude oil, surpassing Saudi Arabia and Russia.

-

 Science1 week ago
Visualizing the Average Lifespans of Mammals
-

 Markets2 weeks ago
The Top 10 States by Real GDP Growth in 2023
-

 Demographics2 weeks ago
The Smallest Gender Wage Gaps in OECD Countries
-

 United States2 weeks ago
Where U.S. Inflation Hit the Hardest in March 2024
-

 Green2 weeks ago
Top Countries By Forest Growth Since 2001
-

 United States2 weeks ago
Ranked: The Largest U.S. Corporations by Number of Employees
-

 Maps2 weeks ago
The Largest Earthquakes in the New York Area (1970-2024)
-

 Green2 weeks ago
Ranked: The Countries With the Most Air Pollution in 2023