

Global clean energy spending is projected to reach $5.6 trillion by 2030. Which renewable sources are forecast to see the most investment?


This infographic lists the top energy priorities in 28 countries, based on an Ipsos survey involving 24,000 people.


With more renewables and EVs plugging into the grid, copper and nickel are essential building blocks for the energy transition.


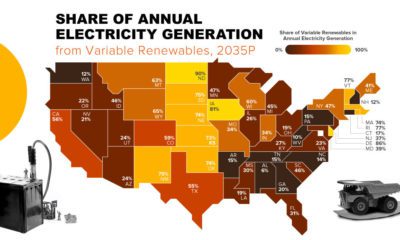
This graphic describes new U.S. renewable energy installations by state along with nameplate capacity, planned to come online in 2023.
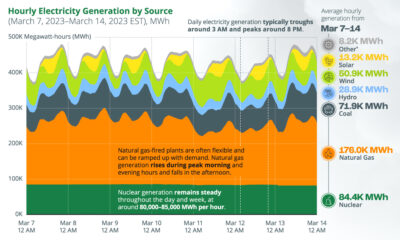

This chart tracks U.S. hourly electricity generation over one week, with various sources producing electricity at different times of the day.


As the market for low-emission solutions expands, China dominates the production of clean energy technologies and their components.


As Europe and the EU shift away from fossil fuels, which energy sources are European countries depending on for their electricity generation?
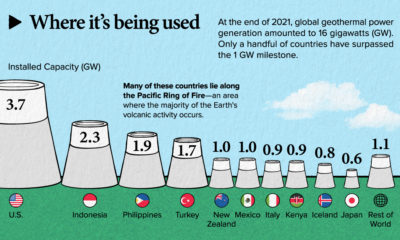

This infographic teaches you everything you need to know about geothermal energy in less than 5 minutes.

As the U.S. transitions to clean energy, investing in battery metals like lithium and cobalt can help secure an energy-independent future.


Wind is a great renewable energy source, but the spread of potential power is uneven. This graphic maps the average wind speed of the continental U.S.


 Creator Program