Energy
Mapped: Renewable Energy and Battery Installations in the U.S. in 2023
![]() Subscribe to the Elements free mailing list for more like this
Subscribe to the Elements free mailing list for more like this
Renewable and Battery Installations in the U.S. in 2023
This was originally posted on Elements. Sign up to the free mailing list to get beautiful visualizations on real assets and resource megatrends each week.
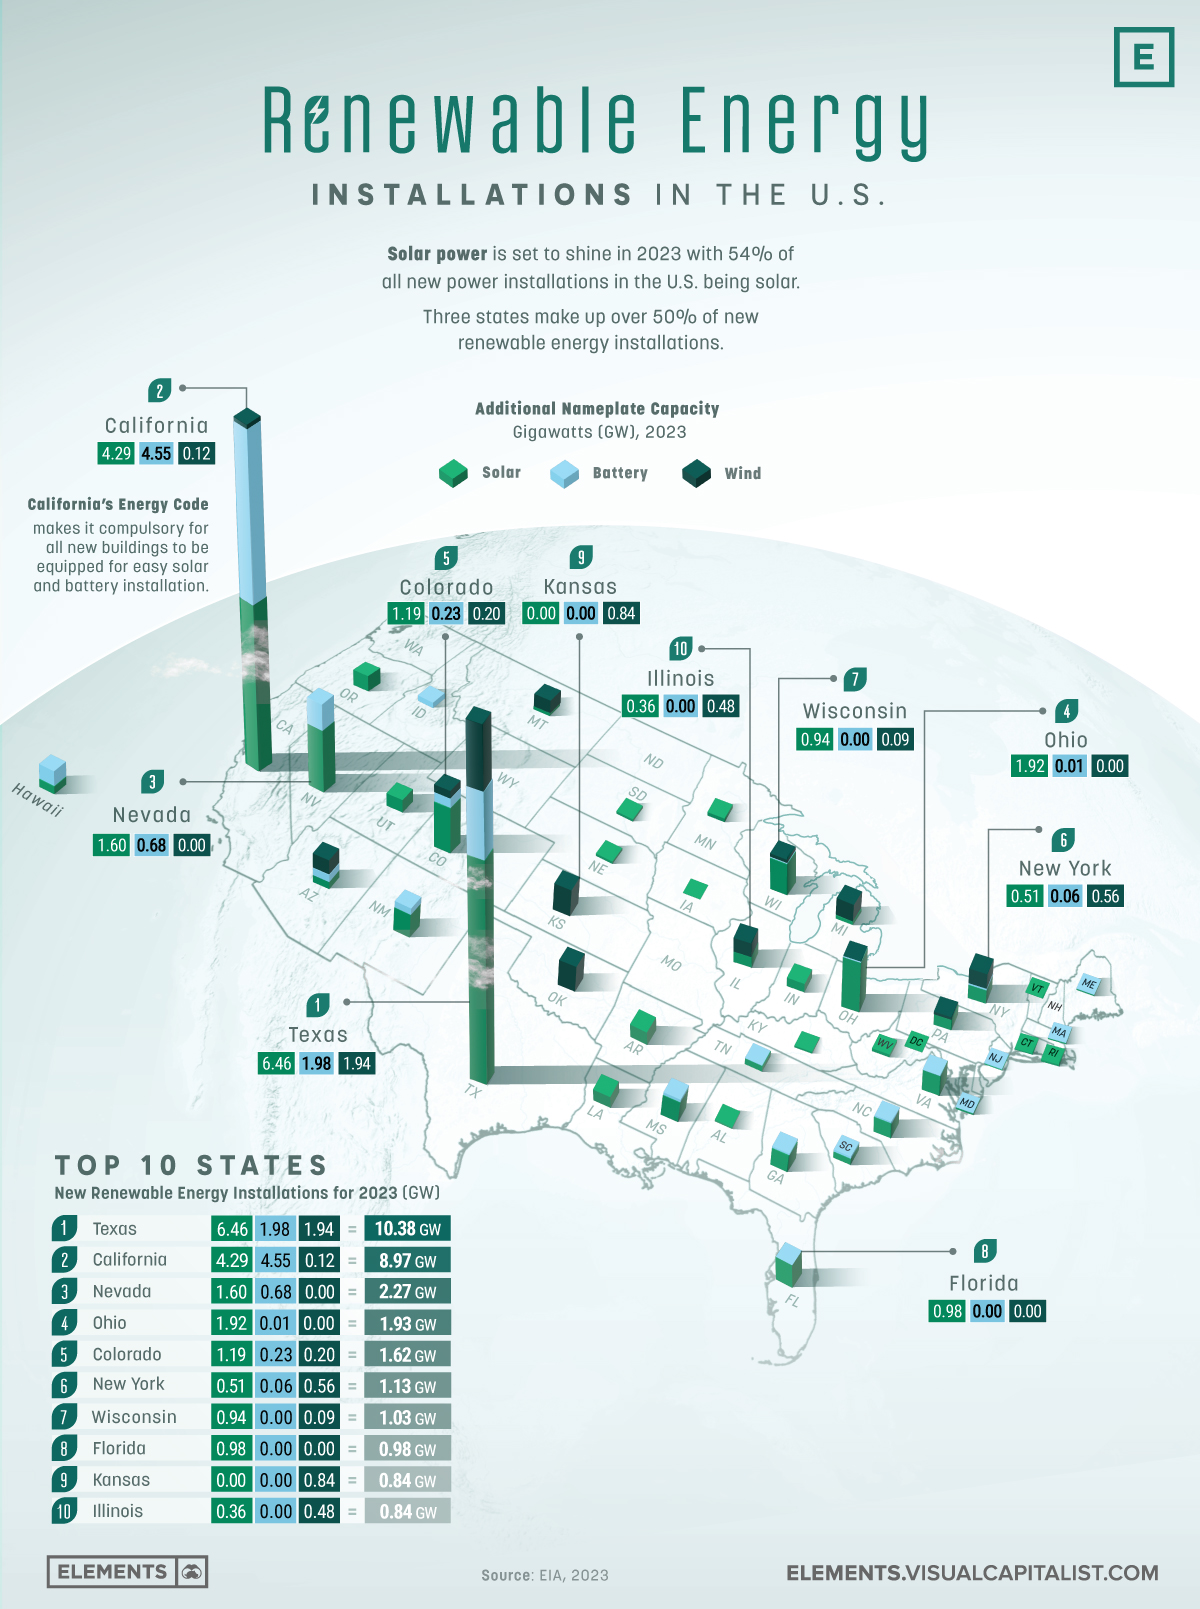
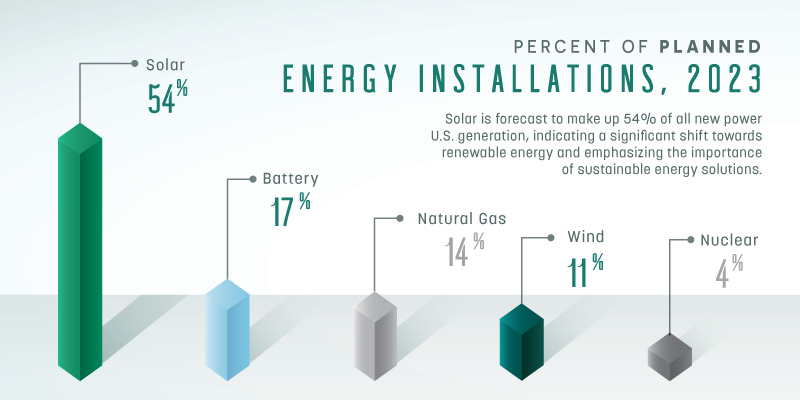
Renewable energy, in particular solar power, is set to shine in 2023. This year, the U.S. plans to get over 80% of its new energy installations from sources like battery, solar, and wind.
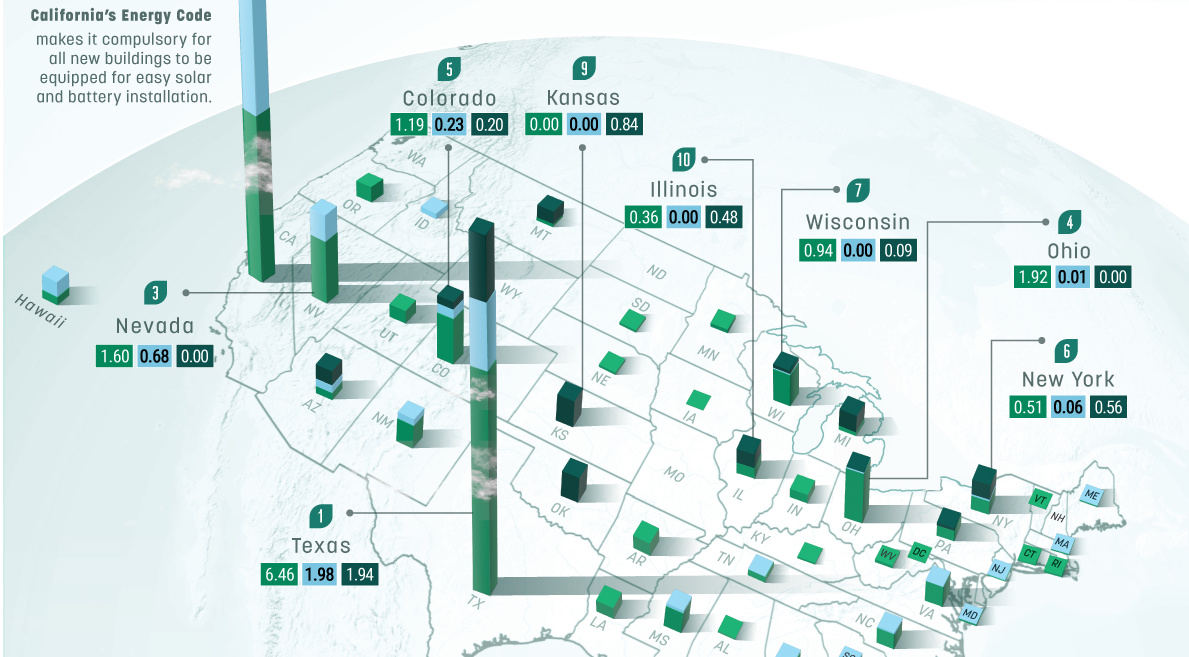
The above map uses data from EIA to highlight planned U.S. renewable energy and battery storage installations by state for 2023.
Texas and California Leading in Renewable Energy
Nearly every state in the U.S. has plans to produce new clean energy in 2023, but it’s not a surprise to see the two most populous states in the lead of the pack.
Even though the majority of its power comes from natural gas, Texas currently leads the U.S. in planned renewable energy installations. The state also has plans to power nearly 900,000 homes using new wind energy.
California is second, which could be partially attributable to the passing of Title 24, an energy code that makes it compulsory for new buildings to have the equipment necessary to allow the easy installation of solar panels, battery storage, and EV charging.
New solar power in the U.S. isn’t just coming from places like Texas and California. In 2023, Ohio will add 1,917 MW of new nameplate solar capacity, with Nevada and Colorado not far behind.
| Top 10 States | Battery (MW) | Solar (MW) | Wind (MW) | Total (MW) |
|---|---|---|---|---|
| Texas | 1,981 | 6,462 | 1,941 | 10,385 |
| California | 4,555 | 4,293 | 123 | 8,970 |
| Nevada | 678 | 1,596 | 0 | 2,274 |
| Ohio | 12 | 1,917 | 5 | 1,934 |
| Colorado | 230 | 1,187 | 200 | 1,617 |
| New York | 58 | 509 | 559 | 1,125 |
| Wisconsin | 4 | 939 | 92 | 1,034 |
| Florida | 3 | 978 | 0 | 980 |
| Kansas | 0 | 0 | 843 | 843 |
| Illinois | 0 | 363 | 477 | 840 |
The state of New York is also looking to become one of the nation’s leading renewable energy providers. The New York State Energy Research & Development Authority (NYSERDA) is making real strides towards this objective with 11% of the nation’s new wind power projects expected to come online in 2023.
According to the data, New Hampshire is the only state in the U.S. that has no new utility-scale renewable energy installations planned for 2023. However, the state does have plans for a massive hydroelectric plant that should come online in 2024.
Decarbonizing Energy
Renewable energy is considered essential to reduce global warming and CO2 emissions.
In line with the efforts by each state to build new renewable installations, the Biden administration has set a goal of achieving a carbon pollution-free power sector by 2035 and a net zero emissions economy by no later than 2050.
The EIA forecasts the share of U.S. electricity generation from renewable sources rising from 22% in 2022 to 23% in 2023 and to 26% in 2024.


Energy
Charted: 4 Reasons Why Lithium Could Be the Next Gold Rush
Visual Capitalist has partnered with EnergyX to show why drops in prices and growing demand may make now the right time to invest in lithium.


4 Reasons Why You Should Invest in Lithium
Lithium’s importance in powering EVs makes it a linchpin of the clean energy transition and one of the world’s most precious minerals.
In this graphic, Visual Capitalist partnered with EnergyX to explore why now may be the time to invest in lithium.
1. Lithium Prices Have Dropped
One of the most critical aspects of evaluating an investment is ensuring that the asset’s value is higher than its price would indicate. Lithium is integral to powering EVs, and, prices have fallen fast over the last year:
| Date | LiOH·H₂O* | Li₂CO₃** |
|---|---|---|
| Feb 2023 | $76 | $71 |
| March 2023 | $71 | $61 |
| Apr 2023 | $43 | $33 |
| May 2023 | $43 | $33 |
| June 2023 | $47 | $45 |
| July 2023 | $44 | $40 |
| Aug 2023 | $35 | $35 |
| Sept 2023 | $28 | $27 |
| Oct 2023 | $24 | $23 |
| Nov 2023 | $21 | $21 |
| Dec 2023 | $17 | $16 |
| Jan 2024 | $14 | $15 |
| Feb 2024 | $13 | $14 |
Note: Monthly spot prices were taken as close to the 14th of each month as possible.
*Lithium hydroxide monohydrate MB-LI-0033
**Lithium carbonate MB-LI-0029
2. Lithium-Ion Battery Prices Are Also Falling
The drop in lithium prices is just one reason to invest in the metal. Increasing economies of scale, coupled with low commodity prices, have caused the cost of lithium-ion batteries to drop significantly as well.
In fact, BNEF reports that between 2013 and 2023, the price of a Li-ion battery dropped by 82%.
| Year | Price per KWh |
|---|---|
| 2023 | $139 |
| 2022 | $161 |
| 2021 | $150 |
| 2020 | $160 |
| 2019 | $183 |
| 2018 | $211 |
| 2017 | $258 |
| 2016 | $345 |
| 2015 | $448 |
| 2014 | $692 |
| 2013 | $780 |

3. EV Adoption is Sustainable
One of the best reasons to invest in lithium is that EVs, one of the main drivers behind the demand for lithium, have reached a price point similar to that of traditional vehicle.
According to the Kelly Blue Book, Tesla’s average transaction price dropped by 25% between 2022 and 2023, bringing it in line with many other major manufacturers and showing that EVs are a realistic transport option from a consumer price perspective.
| Manufacturer | September 2022 | September 2023 |
|---|---|---|
| BMW | $69,000 | $72,000 |
| Ford | $54,000 | $56,000 |
| Volkswagon | $54,000 | $56,000 |
| General Motors | $52,000 | $53,000 |
| Tesla | $68,000 | $51,000 |
4. Electricity Demand in Transport is Growing
As EVs become an accessible transport option, there’s an investment opportunity in lithium. But possibly the best reason to invest in lithium is that the IEA reports global demand for the electricity in transport could grow dramatically by 2030:
| Transport Type | 2022 | 2025 | 2030 |
|---|---|---|---|
| Buses 🚌 | 23,000 GWh | 50,000 GWh | 130,000 GWh |
| Cars 🚙 | 65,000 GWh | 200,000 GWh | 570,000 GWh |
| Trucks 🛻 | 4,000 GWh | 15,000 GWh | 94,000 GWh |
| Vans 🚐 | 6,000 GWh | 16,000 GWh | 72,000 GWh |
The Lithium Investment Opportunity
Lithium presents a potentially classic investment opportunity. Lithium and battery prices have dropped significantly, and recently, EVs have reached a price point similar to other vehicles. By 2030, the demand for clean energy, especially in transport, will grow dramatically.
With prices dropping and demand skyrocketing, now is the time to invest in lithium.
EnergyX is poised to exploit lithium demand with cutting-edge lithium extraction technology capable of extracting 300% more lithium than current processes.

-

 Lithium5 days ago
Ranked: The Top 10 EV Battery Manufacturers in 2023
Asia dominates this ranking of the world’s largest EV battery manufacturers in 2023.
-

 Energy1 week ago
The World’s Biggest Nuclear Energy Producers
China has grown its nuclear capacity over the last decade, now ranking second on the list of top nuclear energy producers.
-

 Energy1 month ago
The World’s Biggest Oil Producers in 2023
Just three countries accounted for 40% of global oil production last year.
-

 Energy1 month ago
How Much Does the U.S. Depend on Russian Uranium?
Currently, Russia is the largest foreign supplier of nuclear power fuel to the U.S.
-

 Uranium2 months ago
Charted: Global Uranium Reserves, by Country
We visualize the distribution of the world’s uranium reserves by country, with 3 countries accounting for more than half of total reserves.
-

 Energy3 months ago
Visualizing the Rise of the U.S. as Top Crude Oil Producer
Over the last decade, the United States has established itself as the world’s top producer of crude oil, surpassing Saudi Arabia and Russia.


-

 Debt1 week ago
How Debt-to-GDP Ratios Have Changed Since 2000
-

 Demographics2 weeks ago
Population Projections: The World’s 6 Largest Countries in 2075
-

 Markets2 weeks ago
The Top 10 States by Real GDP Growth in 2023
-

 Demographics2 weeks ago
The Smallest Gender Wage Gaps in OECD Countries
-

 Economy2 weeks ago
Where U.S. Inflation Hit the Hardest in March 2024
-

 Green2 weeks ago
Top Countries By Forest Growth Since 2001
-

 United States2 weeks ago
Ranked: The Largest U.S. Corporations by Number of Employees
-

 Maps2 weeks ago
The Largest Earthquakes in the New York Area (1970-2024)