Money
Charted: Public Trust in the Federal Reserve


The Briefing
- Gallup conducts an annual poll to gauge the U.S. public’s trust in the Federal Reserve
- After rising during the COVID-19 pandemic, public trust has fallen to a 20-year low
Charted: Public Trust in the Federal Reserve
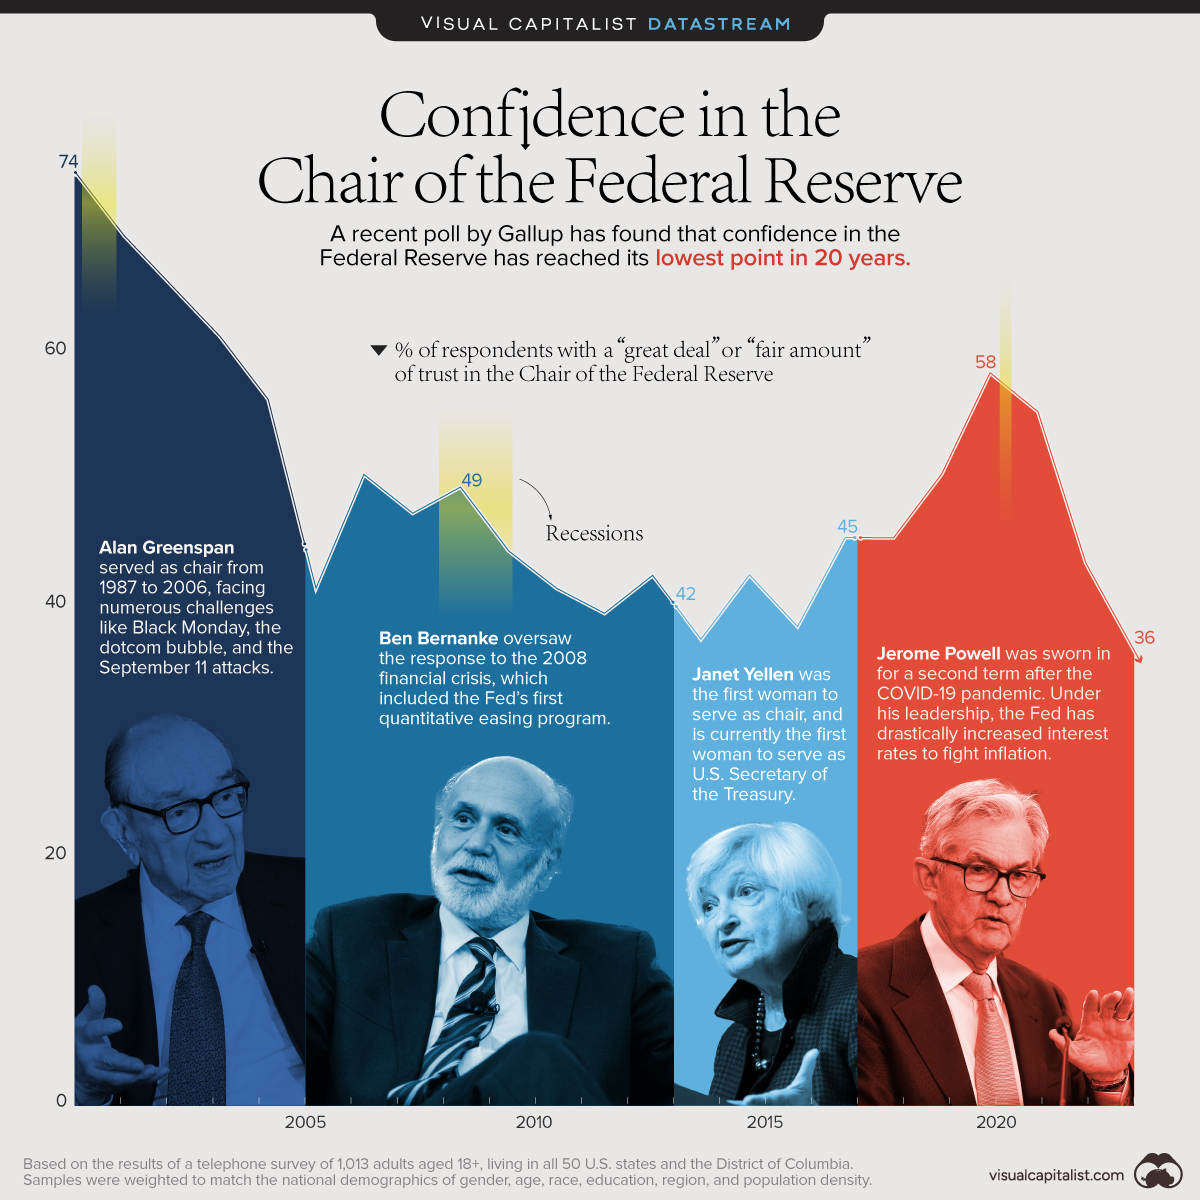
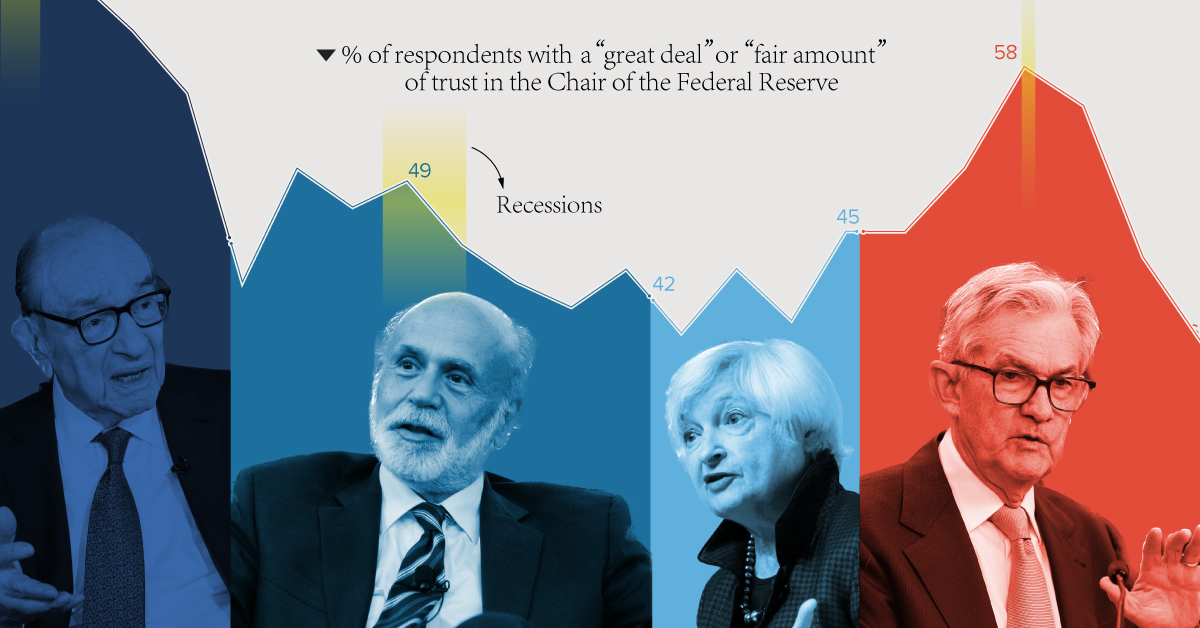
Each year, Gallup conducts a survey of American adults on various economic topics, including the country’s central bank, the Federal Reserve.
More specifically, respondents are asked how much confidence they have in the current Fed chairman to do or recommend the right thing for the U.S. economy. We’ve visualized these results from 2001 to 2023 to see how confidence levels have changed over time.
Methodology and Results
The data used in this infographic is also listed in the table below. Percentages reflect the share of respondents that have either a “great deal” or “fair amount” of confidence.
| Year | Fed chair | % Great deal or Fair amount |
|---|---|---|
| 2023 | Jerome Powell | 36% |
| 2022 | Jerome Powell | 43% |
| 2021 | Jerome Powell | 55% |
| 2020 | Jerome Powell | 58% |
| 2019 | Jerome Powell | 50% |
| 2018 | Jerome Powell | 45% |
| 2017 | Janet Yellen | 45% |
| 2016 | Janet Yellen | 38% |
| 2015 | Janet Yellen | 42% |
| 2014 | Janet Yellen | 37% |
| 2013 | Ben Bernanke | 42% |
| 2012 | Ben Bernanke | 39% |
| 2011 | Ben Bernanke | 41% |
| 2010 | Ben Bernanke | 44% |
| 2009 | Ben Bernanke | 49% |
| 2008 | Ben Bernanke | 47% |
| 2007 | Ben Bernanke | 50% |
| 2006 | Ben Bernanke | 41% |
| 2005 | Alan Greenspan | 56% |
| 2004 | Alan Greenspan | 61% |
| 2003 | Alan Greenspan | 65% |
| 2002 | Alan Greenspan | 69% |
| 2001 | Alan Greenspan | 74% |
Data for 2023 collected April 3-25, with this statement put to respondents: “Please tell me how much confidence you have [in the Fed chair] to recommend the right thing for the economy.”
We can see that trust in the Federal Reserve has fluctuated significantly in recent years.
For example, under Alan Greenspan, trust was initially high due to the relative stability of the economy. The burst of the dotcom bubble—which some attribute to Greenspan’s easy credit policies—resulted in a sharp decline.
On the flip side, public confidence spiked during the COVID-19 pandemic. This was likely due to Jerome Powell’s decisive actions to provide support to the U.S. economy throughout the crisis.
Measures implemented by the Fed include bringing interest rates to near zero, quantitative easing (buying government bonds with newly-printed money), and emergency lending programs to businesses.
Confidence Now on the Decline
After peaking at 58%, those with a “great deal” or “fair amount” of trust in the Fed chair have tumbled to 36%, the lowest number in 20 years.
This is likely due to Powell’s hard stance on fighting post-pandemic inflation, which has involved raising interest rates at an incredible speed. While these rate hikes may be necessary, they also have many adverse effects:
- Negative impact on the stock market
- Increases the burden for those with variable-rate debts
- Makes mortgages and home buying less affordable
Higher rates have also prompted many U.S. tech companies to shrink their workforces, and have been a factor in the regional banking crisis, including the collapse of Silicon Valley Bank.
Where does this data come from?
Source: Gallup (2023)
Data Notes: Results are based on telephone interviews conducted April 3-25, 2023, with a random sample of –1,013—adults, ages 18+, living in all 50 U.S. states and the District of Columbia. For results based on this sample of national adults, the margin of sampling error is ±4 percentage points at the 95% confidence level. See source for details.


Money
Charted: Which City Has the Most Billionaires in 2024?
Just two countries account for half of the top 20 cities with the most billionaires. And the majority of the other half are found in Asia.


Charted: Which Country Has the Most Billionaires in 2024?
This was originally posted on our Voronoi app. Download the app for free on iOS or Android and discover incredible data-driven charts from a variety of trusted sources.
Some cities seem to attract the rich. Take New York City for example, which has 340,000 high-net-worth residents with investable assets of more than $1 million.
But there’s a vast difference between being a millionaire and a billionaire. So where do the richest of them all live?
Using data from the Hurun Global Rich List 2024, we rank the top 20 cities with the highest number of billionaires in 2024.
A caveat to these rich lists: sources often vary on figures and exact rankings. For example, in last year’s reports, Forbes had New York as the city with the most billionaires, while the Hurun Global Rich List placed Beijing at the top spot.
Ranked: Top 20 Cities with the Most Billionaires in 2024
The Chinese economy’s doldrums over the course of the past year have affected its ultra-wealthy residents in key cities.
Beijing, the city with the most billionaires in 2023, has not only ceded its spot to New York, but has dropped to #4, overtaken by London and Mumbai.
| Rank | City | Billionaires | Rank Change YoY |
|---|---|---|---|
| 1 | 🇺🇸 New York | 119 | +1 |
| 2 | 🇬🇧 London | 97 | +3 |
| 3 | 🇮🇳 Mumbai | 92 | +4 |
| 4 | 🇨🇳 Beijing | 91 | -3 |
| 5 | 🇨🇳 Shanghai | 87 | -2 |
| 6 | 🇨🇳 Shenzhen | 84 | -2 |
| 7 | 🇭🇰 Hong Kong | 65 | -1 |
| 8 | 🇷🇺 Moscow | 59 | No Change |
| 9 | 🇮🇳 New Delhi | 57 | +6 |
| 10 | 🇺🇸 San Francisco | 52 | No Change |
| 11 | 🇹🇭 Bangkok | 49 | +2 |
| 12 | 🇹🇼 Taipei | 45 | +2 |
| 13 | 🇫🇷 Paris | 44 | -2 |
| 14 | 🇨🇳 Hangzhou | 43 | -5 |
| 15 | 🇸🇬 Singapore | 42 | New to Top 20 |
| 16 | 🇨🇳 Guangzhou | 39 | -4 |
| 17T | 🇮🇩 Jakarta | 37 | +1 |
| 17T | 🇧🇷 Sao Paulo | 37 | No Change |
| 19T | 🇺🇸 Los Angeles | 31 | No Change |
| 19T | 🇰🇷 Seoul | 31 | -3 |
In fact all Chinese cities on the top 20 list have lost billionaires between 2023–24. Consequently, they’ve all lost ranking spots as well, with Hangzhou seeing the biggest slide (-5) in the top 20.
Where China lost, all other Asian cities—except Seoul—in the top 20 have gained ranks. Indian cities lead the way, with New Delhi (+6) and Mumbai (+3) having climbed the most.
At a country level, China and the U.S combine to make up half of the cities in the top 20. They are also home to about half of the world’s 3,200 billionaire population.
In other news of note: Hurun officially counts Taylor Swift as a billionaire, estimating her net worth at $1.2 billion.

-

 Science1 week ago
Visualizing the Average Lifespans of Mammals
-

 Markets2 weeks ago
The Top 10 States by Real GDP Growth in 2023
-

 Demographics2 weeks ago
The Smallest Gender Wage Gaps in OECD Countries
-

 United States2 weeks ago
Where U.S. Inflation Hit the Hardest in March 2024
-

 Green2 weeks ago
Top Countries By Forest Growth Since 2001
-

 United States2 weeks ago
Ranked: The Largest U.S. Corporations by Number of Employees
-

 Maps2 weeks ago
The Largest Earthquakes in the New York Area (1970-2024)
-

 Green2 weeks ago
Ranked: The Countries With the Most Air Pollution in 2023