Business
Visualizing Tech Company Layoffs in 2022


Visualizing Tech Company Layoffs in 2022
Layoffs are happening so frequently in 2022 that everyone from Crunchbase to Indian tech website Inc42 are now keeping track.
There is even a standalone website tracking all tech layoffs in the United States.
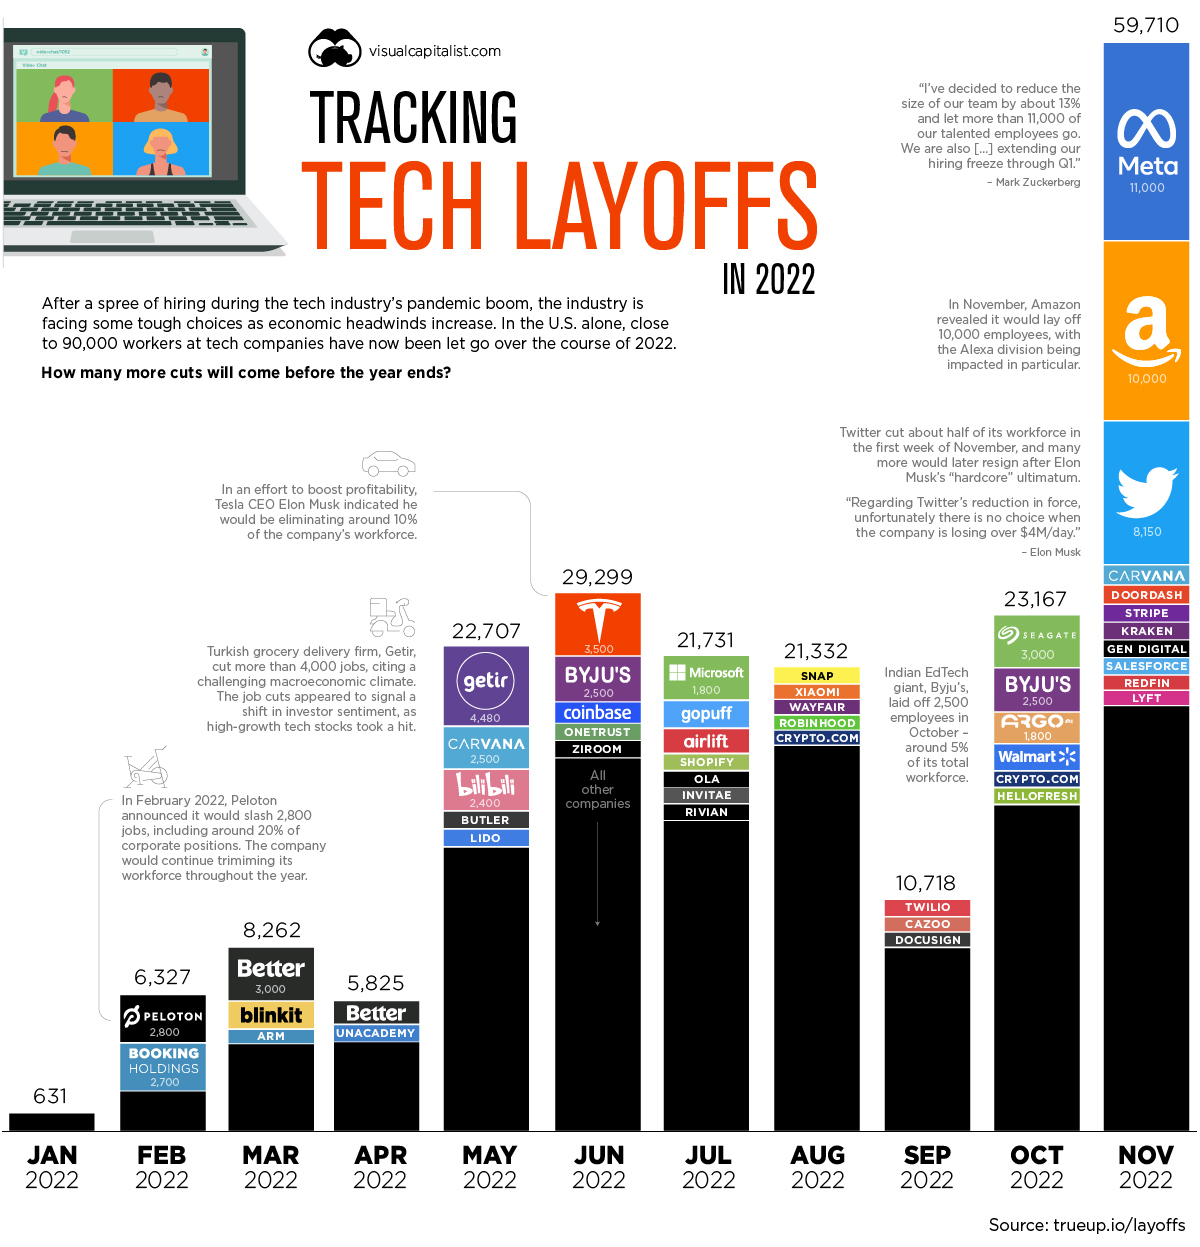
For the purposes of this infographic, we’ve used data from trueup.io which includes a mix of U.S. and international tech companies that have let workers go in 2022.
A Thousand Cuts: Mass Layoffs by Tech Companies
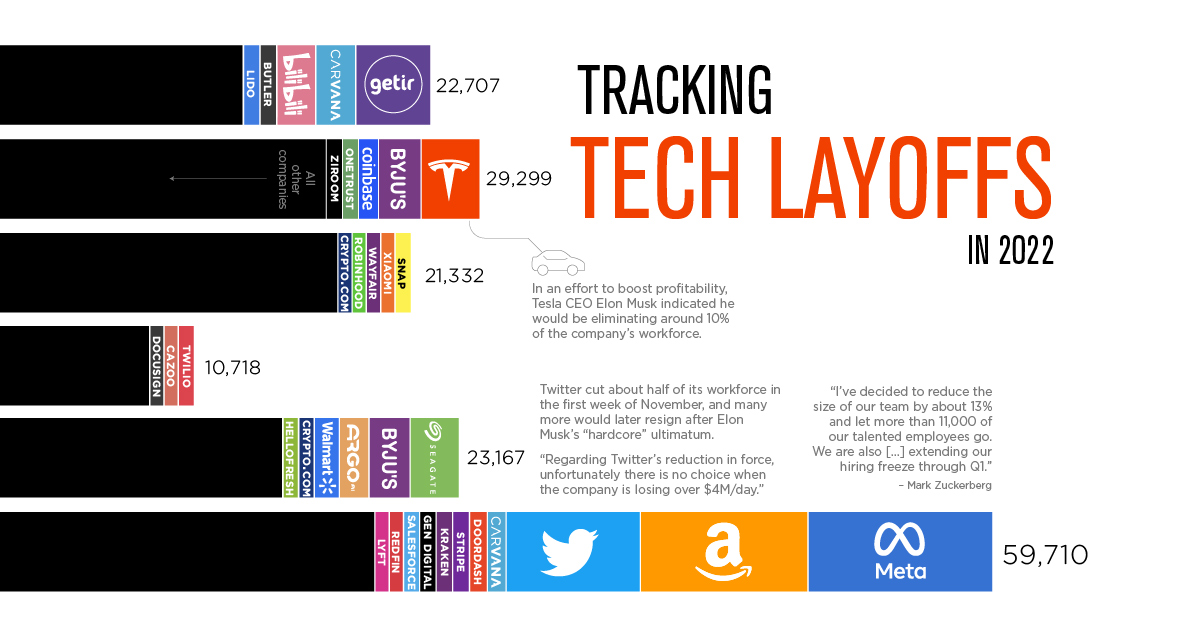
Layoffs are having an impact on the entire tech industry, and the phenomenon is global. Here are some of the most high-profile examples of mass layoffs in 2022:
Meta: The social media giant faces competition from upstarts like TikTok, as well as a pool of ad dollars that is shrinking in the face of a faltering economy. Although this reduction in headcount is painful for Meta, it’s worth considering a more broad perspective. In close to two decades of doing business, these will be the company’s first wide-scale job cuts.
Twitter: Though Meta wins with sheer volume of cuts, Twitter’s mass layoffs are surely the most dramatic. In early November, the company’s iconoclastic new owner, Elon Musk, slashed 50% of the workforce, and soon after, thousands of contractors also suddenly lost their jobs. Estimating how many employees remain at the company will remain a challenge until the dust settles.
Byju’s: Layoffs are not just confined to the United States. India’s sizable tech sector is also facing cuts. EdTech giant, Byju’s, laid off 2,500 employees in October—around 5% of its total workforce.
Peloton: The high-end workout equipment company has been dropping its headcount throughout the year. In the visualization above, companies like Meta stand out as they eliminated thousands of employees all at once. Peloton, however, executed its layoffs in stages throughout the year. After strong growth during the pandemic began to stagnate, the company is slimming down to regain profitability.
Why are Tech Companies Laying Off so Many People?
The stated reasons for letting so many workers go are economic uncertainty (external factors) and poor performance (internal factors).
Goldman Sachs Research points out that “higher interest rates and tighter financial conditions disproportionately impact the sector because tech company profits are typically expected further out in the future and therefore subject to greater duration risk.”
Shrinking advertising budgets and the implosion of the cryptocurrency market are also factors that may have influenced the decision to cut headcounts. Twitter and Snapchat fall into the former bucket, while Coinbase and Kraken fall into the latter.
What Do These Job Cuts Mean for the Economy?
At face value, widespread layoffs in the tech sector might appear to be a bad omen for the wider economy—especially given the outsize influence tech companies have on the markets.
Thankfully, this does not appear to be the case. Payroll and wage data from the U.S. government have exceeded expectations, and the country’s unemployment rate is close to a half-century low.
So, why the disconnect?
First off, tech jobs only account for less than 3% of total employment in America. As well, tech workers who’ve lost their jobs have a high likelihood of securing a new job in short order.
It remains to be seen whether November will be the peak of job cuts. Employers generally try to avoid letting people go right before the holiday season. One week into December, Trueup.io has tracked 7,600 more layoffs.


Markets
Ranked: The Largest U.S. Corporations by Number of Employees
We visualized the top U.S. companies by employees, revealing the massive scale of retailers like Walmart, Target, and Home Depot.


The Largest U.S. Corporations by Number of Employees
This was originally posted on our Voronoi app. Download the app for free on Apple or Android and discover incredible data-driven charts from a variety of trusted sources.
Revenue and profit are common measures for measuring the size of a business, but what about employee headcount?
To see how big companies have become from a human perspective, we’ve visualized the top U.S. companies by employees. These figures come from companiesmarketcap.com, and were accessed in March 2024. Note that this ranking includes publicly-traded companies only.
Data and Highlights
The data we used to create this list of largest U.S. corporations by number of employees can be found in the table below.
| Company | Sector | Number of Employees |
|---|---|---|
| Walmart | Consumer Staples | 2,100,000 |
| Amazon | Consumer Discretionary | 1,500,000 |
| UPS | Industrials | 500,000 |
| Home Depot | Consumer Discretionary | 470,000 |
| Concentrix | Information Technology | 440,000 |
| Target | Consumer Staples | 440,000 |
| Kroger | Consumer Staples | 430,000 |
| UnitedHealth | Health Care | 400,000 |
| Berkshire Hathaway | Financials | 383,000 |
| Starbucks | Consumer Discretionary | 381,000 |
| Marriott International | Consumer Discretionary | 377,000 |
| Cognizant | Information Technology | 346,600 |
Retail and Logistics Top the List
Companies like Walmart, Target, and Kroger have a massive headcount due to having many locations spread across the country, which require everything from cashiers to IT professionals.
Moving goods around the world is also highly labor intensive, explaining why UPS has half a million employees globally.
Below the Radar?
Two companies that rank among the largest U.S. corporations by employees which may be less familiar to the public include Concentrix and Cognizant. Both of these companies are B2B brands, meaning they primarily work with other companies rather than consumers. This contrasts with brands like Amazon or Home Depot, which are much more visible among average consumers.
A Note on Berkshire Hathaway
Warren Buffett’s company doesn’t directly employ 383,000 people. This headcount actually includes the employees of the firm’s many subsidiaries, such as GEICO (insurance), Dairy Queen (retail), and Duracell (batteries).
If you’re curious to see how Buffett’s empire has grown over the years, check out this animated graphic that visualizes the growth of Berkshire Hathaway’s portfolio from 1994 to 2022.

-

 Real Estate2 weeks ago
Visualizing America’s Shortage of Affordable Homes
-

 Technology1 week ago
Ranked: Semiconductor Companies by Industry Revenue Share
-

 Money1 week ago
Which States Have the Highest Minimum Wage in America?
-

 Real Estate1 week ago
Ranked: The Most Valuable Housing Markets in America
-

 Business2 weeks ago
Charted: Big Four Market Share by S&P 500 Audits
-

 AI2 weeks ago
The Stock Performance of U.S. Chipmakers So Far in 2024
-

 Misc2 weeks ago
Almost Every EV Stock is Down After Q1 2024
-

 Money2 weeks ago
Where Does One U.S. Tax Dollar Go?