Misc
Ranked: The Cities with the Most Skyscrapers in 2023


Ranked: The Cities with the Most Skyscrapers in 2023
When it comes to soaring skylines and architectural marvels, no country has embraced the vertical revolution quite like China.
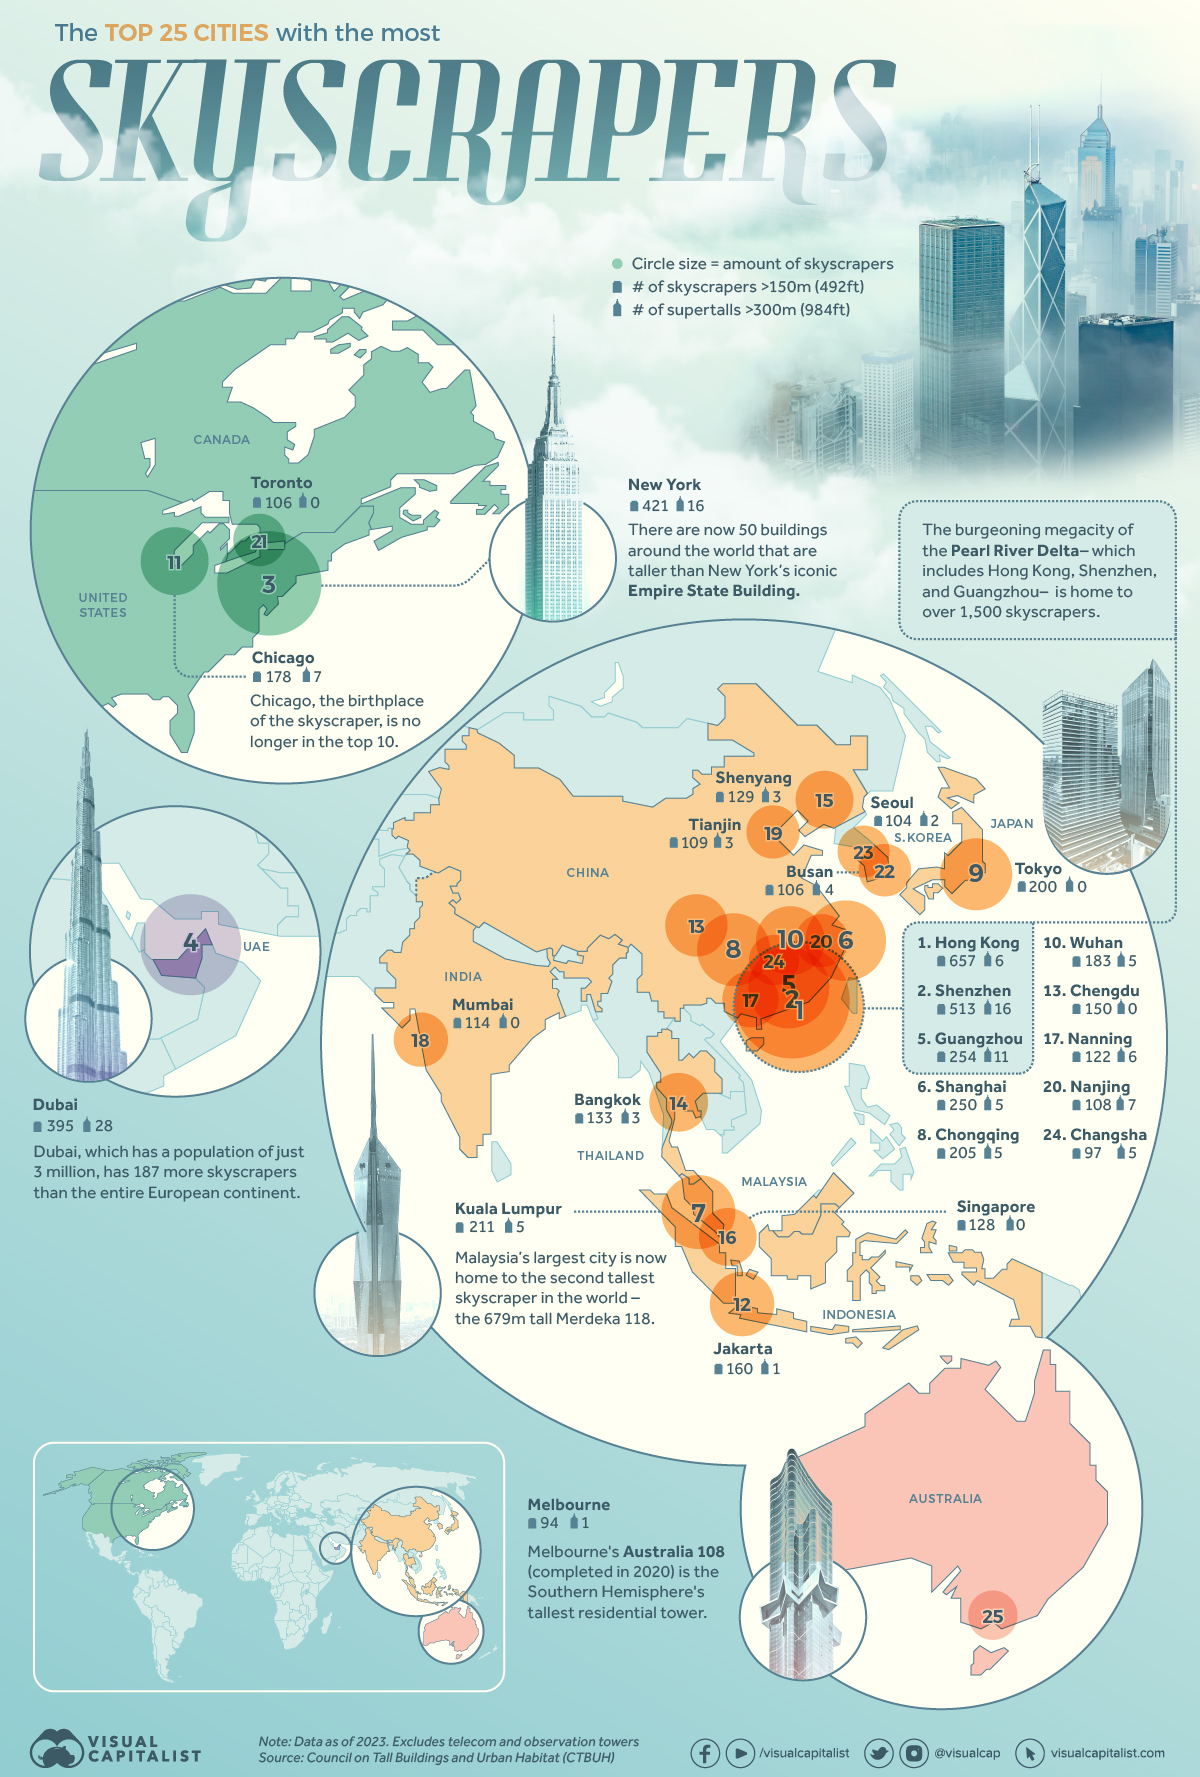
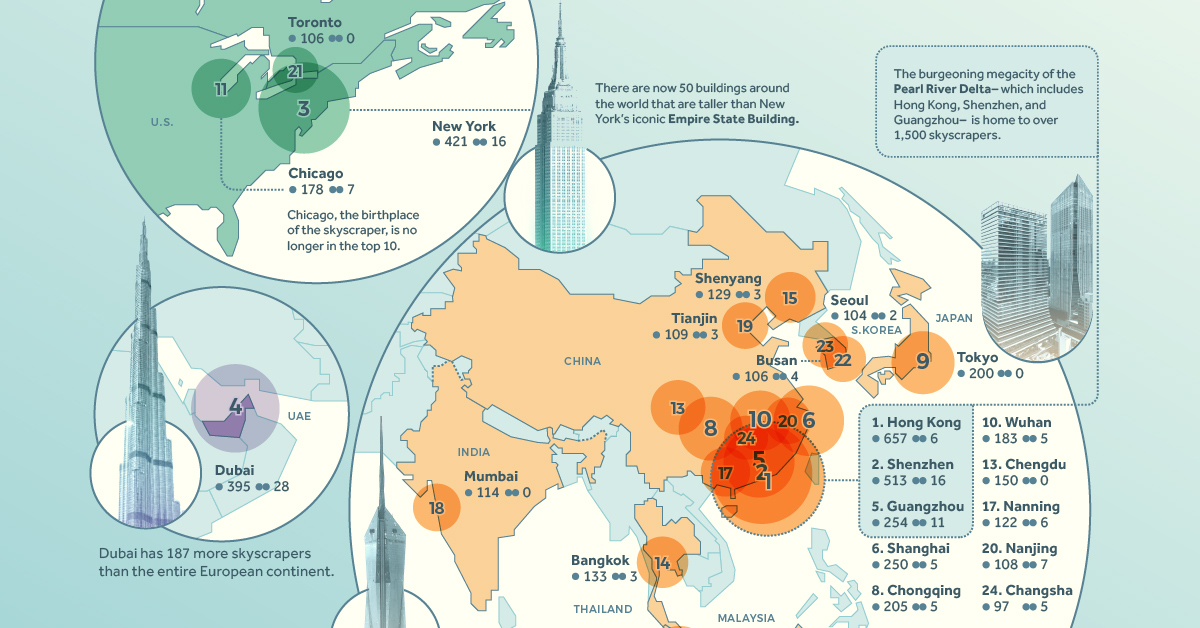
In this graphic, which uses data from the Council on Tall Buildings and Urban Habitat (CTBUH), we reveal the 25 cities with the most skyscrapers and supertall buildings globally.
Unsurprisingly, China’s cities dominate the list, solidifying the country’s reputation as a global powerhouse of tall buildings.
The 25 Top Cities by Skyscraper Count
Topping the charts is Hong Kong, with an impressive 657 skyscrapers, including six supertalls (buildings over 300 meters tall).
| Rank | City | Country | Skyscrapers (>150m) | Supertalls (>300m) |
|---|---|---|---|---|
| 1 | Hong Kong | 🇨🇳 China | 657 | 6 |
| 2 | Shenzhen | 🇨🇳 China | 513 | 16 |
| 3 | New York City | 🇺🇸 United States | 421 | 16 |
| 4 | Dubai | 🇦🇪 United Arab Emirates | 395 | 28 |
| 5 | Guangzhou | 🇨🇳 China | 254 | 11 |
| 6 | Shanghai | 🇨🇳 China | 250 | 5 |
| 7 | Kuala Lumpur | 🇲🇾 Malaysia | 211 | 5 |
| 8 | Chongqing | 🇨🇳 China | 205 | 5 |
| 9 | Tokyo | 🇯🇵 Japan | 200 | 0 |
| 10 | Wuhan | 🇨🇳 China | 183 | 5 |
| 11 | Chicago | 🇺🇸 United States | 178 | 7 |
| 12 | Jakarta | 🇮🇩 Indonesia | 160 | 1 |
| 13 | Chengdu | 🇨🇳 China | 150 | 0 |
| 14 | Bangkok | 🇹🇭 Thailand | 133 | 3 |
| 15 | Shenyang | 🇨🇳 China | 129 | 3 |
| 16 | Singapore | 🇸🇬 Singapore | 128 | 0 |
| 17 | Nanning | 🇨🇳 China | 122 | 6 |
| 18 | Mumbai | 🇮🇳 India | 114 | 0 |
| 19 | Tianjin | 🇨🇳 China | 109 | 3 |
| 20 | Nanjing | 🇨🇳 China | 108 | 7 |
| 21 | Toronto | 🇨🇦 Canada | 106 | 0 |
| 22 | Busan | 🇰🇷 South Korea | 106 | 4 |
| 23 | Seoul | 🇰🇷 South Korea | 104 | 2 |
| 24 | Changsha | 🇨🇳 China | 97 | 5 |
| 25 | Melbourne | 🇦🇺 Australia | 94 | 1 |
Hong Kong, along with Shenzhen (#2), and Guangzhou (#5) are part of the burgeoning megacity known as the Pearl River Delta, which is home to over 1,500 skyscrapers. This is even more impressive when considering that Shenzhen was a small fishing village until the 1970s.
New York City secures the third position on the list, boasting an impressive tally of 421 skyscrapers. Although it may have relinquished its title to Chinese cities, the city’s skyline endures as a globally renowned symbol, prominently featuring the iconic Empire State Building. Notably, while the Empire State Building enjoys widespread familiarity, it no longer ranks among the world’s 50 tallest structures.
Rounding out the top five is Dubai in the United Arab Emirates, which grabs the fourth position with 395 skyscrapers, a staggering 28 of which are supertalls. This desert oasis has become synonymous with grandiose architecture and record-breaking structures, exemplified by the Burj Khalifa, which is the world’s current tallest building at 828 meters (2,715 ft).
China’s Numbers in Context
Looking at this data from another perspective, China actually has more skyscrapers on this list than the rest of the world combined.
| Country | Cities in Top 25 | Skyscrapers | Supertalls |
|---|---|---|---|
| 🇨🇳 China | 12 | 2777 | 72 |
| 🌐 Rest of World | 13 | 2350 | 67 |
China’s rapid urbanization, economic growth, and ambitious construction projects have fueled this impressive feat. There’s no doubt that the country’s relentless pursuit of vertical development, coupled with its booming population and thriving cities, has positioned China as the unrivaled leader in the global skyscraper race.
The Future of the Global Skyline
As the world continues to reach new heights in architectural marvels, there are even more supertall skyscrapers in the pipeline that will reshape skylines across the globe.
From the soaring Jeddah Tower in Saudi Arabia, poised to surpass the Burj Khalifa as the world’s tallest building, to the remarkable Merdeka 118 in Kuala Lumpur, which is set to claim the title of the world’s second-tallest structure when it opens in June 2023, these projects will captivate city dwellers for years to come.
Even as these new monumental buildings rise, China’s prominence in the world of skyscrapers—with three cities in the top five globally—is likely to remain unchallenged.


VC+
VC+: Get Our Key Takeaways From the IMF’s World Economic Outlook
A sneak preview of the exclusive VC+ Special Dispatch—your shortcut to understanding IMF’s World Economic Outlook report.

Have you read IMF’s latest World Economic Outlook yet? At a daunting 202 pages, we don’t blame you if it’s still on your to-do list.
But don’t worry, you don’t need to read the whole April release, because we’ve already done the hard work for you.
To save you time and effort, the Visual Capitalist team has compiled a visual analysis of everything you need to know from the report—and our VC+ Special Dispatch is available exclusively to VC+ members. All you need to do is log into the VC+ Archive.
If you’re not already subscribed to VC+, make sure you sign up now to access the full analysis of the IMF report, and more (we release similar deep dives every week).
For now, here’s what VC+ members get to see.
Your Shortcut to Understanding IMF’s World Economic Outlook
With long and short-term growth prospects declining for many countries around the world, this Special Dispatch offers a visual analysis of the key figures and takeaways from the IMF’s report including:
- The global decline in economic growth forecasts
- Real GDP growth and inflation forecasts for major nations in 2024
- When interest rate cuts will happen and interest rate forecasts
- How debt-to-GDP ratios have changed since 2000
- And much more!

Get the Full Breakdown in the Next VC+ Special Dispatch
VC+ members can access the full Special Dispatch by logging into the VC+ Archive, where you can also check out previous releases.
Make sure you join VC+ now to see exclusive charts and the full analysis of key takeaways from IMF’s World Economic Outlook.
Don’t miss out. Become a VC+ member today.
What You Get When You Become a VC+ Member
VC+ is Visual Capitalist’s premium subscription. As a member, you’ll get the following:
- Special Dispatches: Deep dive visual briefings on crucial reports and global trends
- Markets This Month: A snappy summary of the state of the markets and what to look out for
- The Trendline: Weekly curation of the best visualizations from across the globe
- Global Forecast Series: Our flagship annual report that covers everything you need to know related to the economy, markets, geopolitics, and the latest tech trends
- VC+ Archive: Hundreds of previously released VC+ briefings and reports that you’ve been missing out on, all in one dedicated hub
You can get all of the above, and more, by joining VC+ today.

-

 Debt1 week ago
How Debt-to-GDP Ratios Have Changed Since 2000
-

 Markets2 weeks ago
Ranked: The World’s Top Flight Routes, by Revenue
-

 Countries2 weeks ago
Population Projections: The World’s 6 Largest Countries in 2075
-

 Markets2 weeks ago
The Top 10 States by Real GDP Growth in 2023
-

 Demographics2 weeks ago
The Smallest Gender Wage Gaps in OECD Countries
-

 United States2 weeks ago
Where U.S. Inflation Hit the Hardest in March 2024
-

 Green2 weeks ago
Top Countries By Forest Growth Since 2001
-

 United States2 weeks ago
Ranked: The Largest U.S. Corporations by Number of Employees