Misc
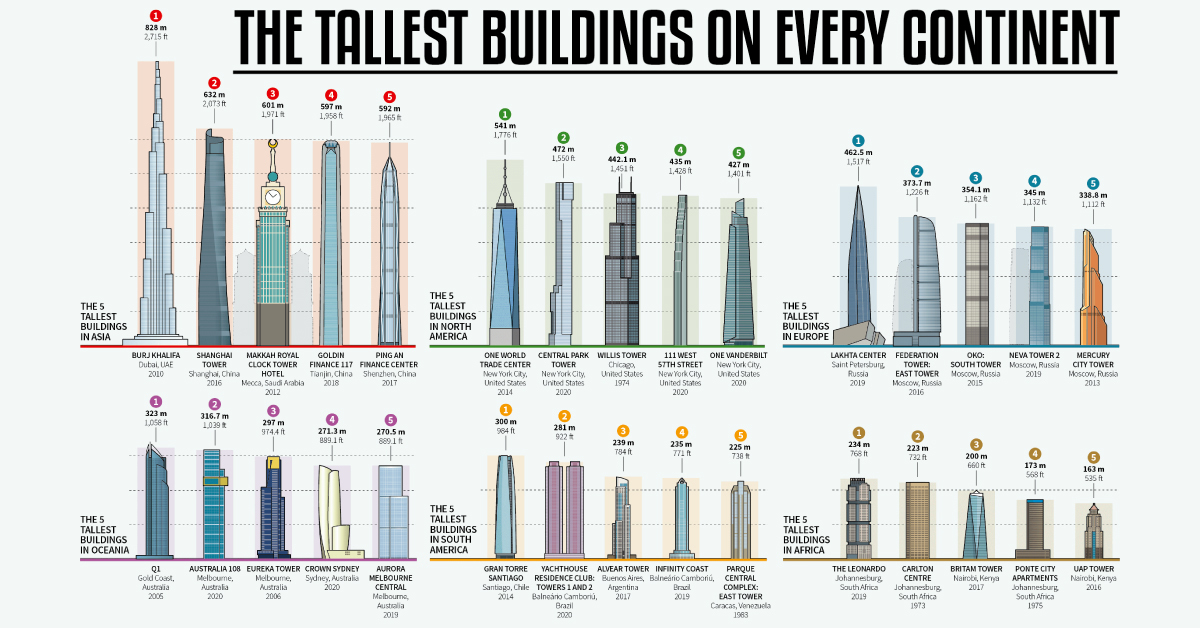
Such Great Heights: Where Are the World’s Tallest Buildings?
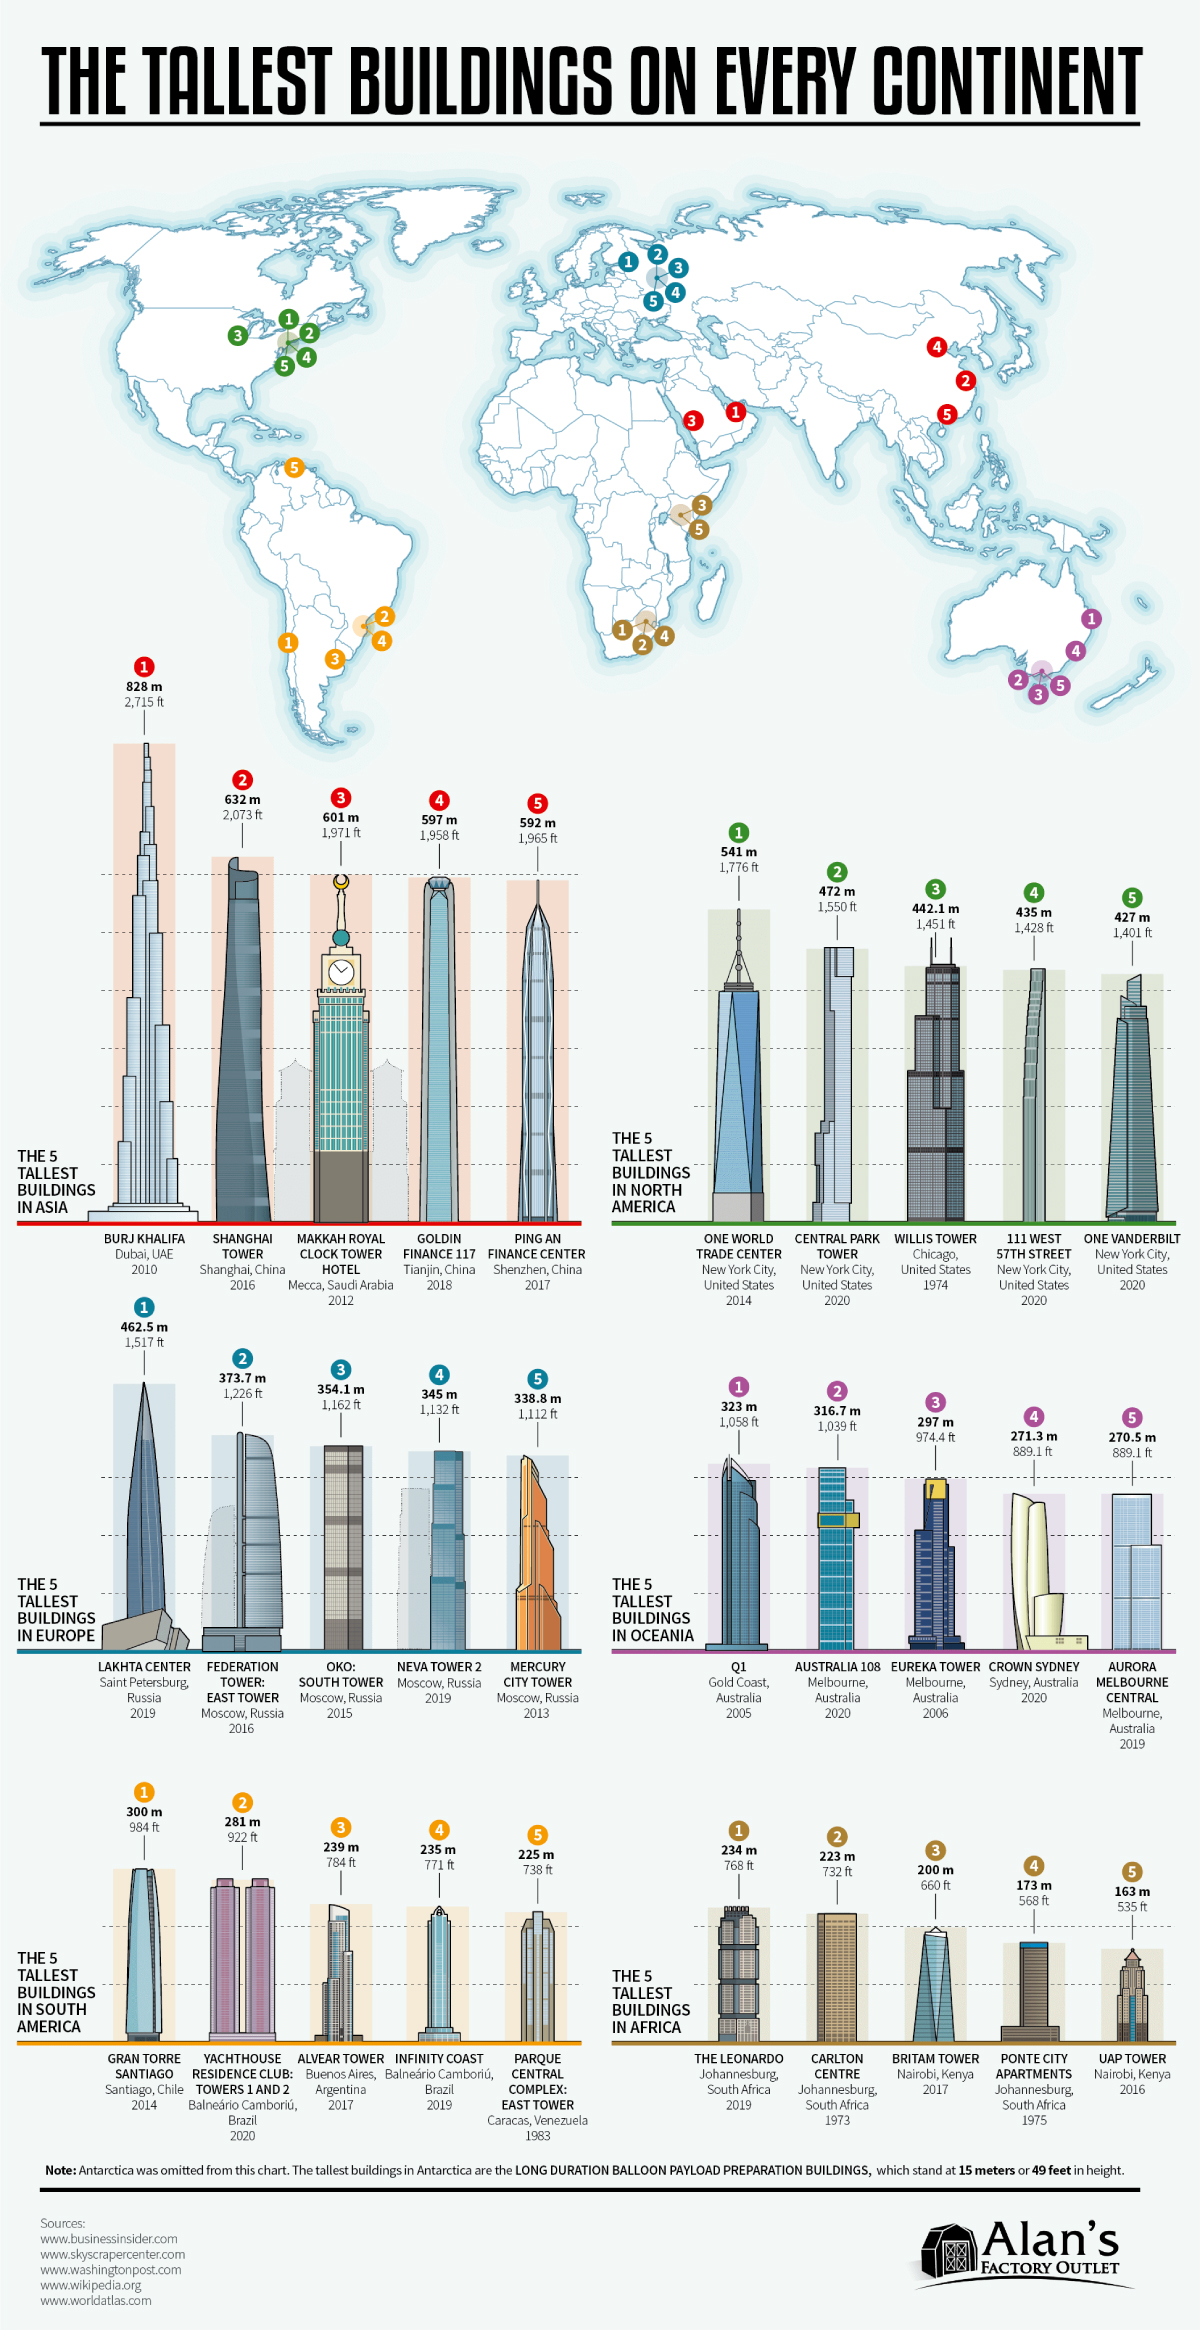
Such Great Heights: The World’s Tallest Buildings
It seems that humanity is always vying to exceed our past accomplishments, and nowhere is the evidence clearer than in the tallest buildings that make up our cities.
We’ve previously looked at how the architectural feats of humanity have simply grown in magnitude over time, tracing this progress as far back as the Stone Age.
The question now is, how much higher and further into the skies can we reach? This infographic by Alan’s Factory Outlet looks at the glittering urban skyscrapers on every continent. We also examine some interesting facts about each region.
Asia: Growing Ever Upwards
The first name on this list certainly needs no introduction. Dubai’s Burj Khalifa is one of the most popular tourist attractions in the Middle East. With just a one minute elevator ride to the Burj Khalifa’s pinnacle, it must seem like even the sky is no longer the limit.
| Building | City, Country | Height | # Floors |
|---|---|---|---|
| Burj Khalifa | 🇦🇪 Dubai, UAE | 828m / 2,715ft | 163 |
| Shanghai Tower | 🇨🇳 Shanghai, China | 632m / 2,073ft | 128 |
| Makkah Royal Clock Tower Hotel | 🇸🇦 Mecca, Saudi Arabia | 601m / 1,971ft | 120 |
| Goldin Finance 117 | 🇨🇳 Tianjin, China | 597m / 1,958ft | 128 |
| Ping An Finance Center | 🇨🇳 Shenzhen, China | 592m / 1,965ft | 115 |
Ping An Finance Center from Shenzhen edges into fifth place on the list, and it’s worth mentioning the speed of change occurring in the city. China’s hi-tech capital will see the completed construction of approximately 51 buildings over 145m (476ft) by the end of 2020.
North America: Concrete Jungle
The One World Trade Center, built to memorialize the loss of the Twin Towers after September 11th, 2001, is also informally called the “Freedom Tower”. It’s exactly 1,776ft high—symbolizing the year the U.S. Declaration of Independence was adopted.
| Building | City, Country | Height | # Floors |
|---|---|---|---|
| One World Trade Center | 🇺🇸 New York City, U.S. | 541m / 1,776ft | 104 |
| Central Park Tower | 🇺🇸 New York City, U.S. | 472m / 1,550ft | 98 |
| Willis Tower | 🇺🇸 Chicago, U.S. | 442.1m / 1,451ft | 110 |
| 111 West 57th Street | 🇺🇸 New York City, U.S. | 435m / 1,428ft | 82 |
| One Vanderbilt | 🇺🇸 New York City, U.S. | 427m / 1,401ft | 67 |
While the Central Park Tower has reached its full height, parts of the interior are still undergoing construction. The price of luxury apartments in the complex start at $7 million for a two-bedroom, just in case you had any extra change lying around.
In fact, the illustrious New York City holds four of the top five buildings on the continent. However, a nod also goes to the Willis Tower (formerly Sears Tower) in Chicago, an imposing office building which held the title of world’s tallest building for 25 years, until the Petronas Towers were erected in Kuala Lumpur.
Europe: Russia’s Reign
The top five tallest buildings in Europe can all be found in Russia. What’s more, those from Moscow are all clustered within a single towering business district known as “Moscow-City”.
| Building | City, Country | Height | # Floors |
|---|---|---|---|
| Lakhta Center | 🇷🇺 Saint Petersburg, Russia | 462.5m / 1,517ft | 87 |
| Federation Tower: East Tower | 🇷🇺 Moscow, Russia | 373.7m / 1,226ft | 101 |
| OKO: South Tower | 🇷🇺 Moscow, Russia | 354.1m / 1,161ft | 85 |
| Neva Tower 2 | 🇷🇺 Moscow, Russia | 345m / 1,132ft | 79 |
| Mercury City Tower | 🇷🇺 Moscow, Russia | 338.8m / 1,112ft | 75 |
This begs the question—why doesn’t Europe build more skyscrapers? There’s an interesting historical reasoning behind this. As North America’s new age ideals and influence on the world stage grew, European cultural values focused on preserving heritage.
Of course, with globalization, things have changed somewhat, and major financial centers of London, Paris and more boast unique skylines of their own.
Oceania: The Views Down Under
Australia’s buildings unsurprisingly dominate the tallest ones in the region. In the surfer’s paradise, Q1 on the Gold Coast has a twist in its design—literally. Its architecture is loosely based on studies of ribbons moving in the wind, as they wrap around the tower.
| Building | City, Country | Height | # Floors |
|---|---|---|---|
| Q1 | 🇦🇺 Gold Coast, Australia | 323m / 1,058 ft | 78 |
| Australia 108 | 🇦🇺 Melbourne, Australia | 316.7m / 1,039 ft | 100 |
| Eureka Tower | 🇦🇺 Melbourne, Australia | 297m / 974.4ft | 91 |
| Crown Sydney | 🇦🇺 Sydney, Australia | 271.3m / 889.1ft | 75 |
| Aurora Melbourne Central | 🇦🇺 Melbourne, Australia | 270.5m / 889.1 ft | 92 |
The Eureka Tower has a fascinating story behind it, too. It’s named after the 1854 Victorian gold rush, with elements of the building reflecting this history—from a gold crown to a red stripe for revolutionary bloodshed.
South America: Views From the Top
The tallest buildings in South America are mainly residential, and often found in Brazil, Argentina, and Venezuela—but Chile is the one standout exception to this rule.
| Building | City, Country | Height | # Floors |
|---|---|---|---|
| Gran Torre Santiago | 🇨🇱 Santiago, Chile | 300m / 984ft | 62 |
| Yachthouse Residence Club Towers 1 and 2 | 🇧🇷 Balneário Camboriú, Brazil | 281m / 922ft | 81 |
| Alvear Tower | 🇦🇷 Buenos Aires, Argentina | 239m / 784ft | 54 |
| Infinity Coast | 🇧🇷 Balneário Camboriú, Brazil | 235m / 771ft | 66 |
| Parque Central Complex: East Tower | 🇻🇪 Caracas, Venezuela | 225m / 738ft | 59 |
Gran Torre Santiago is a retail and office complex, and the largest shopping mall across Latin America. It’s often considered the heart of Chile, and built to hold its ground steadfastly in the earthquake-prone country.
Africa: Budding Buildings
Located in South Africa’s largest city, The Leonardo is the jewel of Johannesburg. The tallest building in Africa was also designed by an architectural team of mostly women.
| Building | City, Country | Height | # Floors |
|---|---|---|---|
| The Leonardo | 🇿🇦 Johannesburg, South Africa | 234m / 768ft | 55 |
| Carlton Center | 🇿🇦 Johannesburg, South Africa | 223m / 732ft | 50 |
| Britam Tower | 🇰🇪 Nairobi, Kenya | 200m / 660ft | 31 |
| Ponte City Apartments | 🇿🇦 Johannesburg, South Africa | 173m / 568ft | 54 |
| UAP Tower | 🇰🇪 Nairobi, Kenya | 163m / 535 ft | 33 |
For African nations, these tallest buildings mean much more than just breaking engineering records. In a journal article, it’s posited that skyscrapers can act as a symbol of power and the continent’s drive towards modernity.
Future Superstar Skyscrapers
A few more mammoth buildings are expected to rise up in the next couple years. Saudi Arabia’s 167-floor Jeddah Tower, while currently on hold, could someday take over the first place crown.
Meanwhile, Dubai’s set to outdo itself—and compete directly with Saudi Arabia. The Kingdom Tower is inspired by the Hanging Gardens of Babylon, and is proposed to break the 1 kilometer-high (or 0.6 mile) mark not yet achieved by any building.
Who knows what greater heights we could scale this century?
Each of us is carving a stone, erecting a column, or cutting a piece of stained glass in the construction of something much bigger than ourselves.
—Adrienne Clarkson, Former Governor General of Canada


VC+
VC+: Get Our Key Takeaways From the IMF’s World Economic Outlook
A sneak preview of the exclusive VC+ Special Dispatch—your shortcut to understanding IMF’s World Economic Outlook report.

Have you read IMF’s latest World Economic Outlook yet? At a daunting 202 pages, we don’t blame you if it’s still on your to-do list.
But don’t worry, you don’t need to read the whole April release, because we’ve already done the hard work for you.
To save you time and effort, the Visual Capitalist team has compiled a visual analysis of everything you need to know from the report—and our upcoming VC+ Special Dispatch will be available exclusively to VC+ members on Thursday, April 25th.
If you’re not already subscribed to VC+, make sure you sign up now to receive the full analysis of the IMF report, and more (we release similar deep dives every week).
For now, here’s what VC+ members can expect to receive.
Your Shortcut to Understanding IMF’s World Economic Outlook
With long and short-term growth prospects declining for many countries around the world, this Special Dispatch offers a visual analysis of the key figures and takeaways from the IMF’s report including:
- The global decline in economic growth forecasts
- Real GDP growth and inflation forecasts for major nations in 2024
- When interest rate cuts will happen and interest rate forecasts
- How debt-to-GDP ratios have changed since 2000
- And much more!

Get the Full Breakdown in the Next VC+ Special Dispatch
VC+ members will receive the full Special Dispatch on Thursday, April 25th.
Make sure you join VC+ now to receive exclusive charts and the full analysis of key takeaways from IMF’s World Economic Outlook.
Don’t miss out. Become a VC+ member today.
What You Get When You Become a VC+ Member
VC+ is Visual Capitalist’s premium subscription. As a member, you’ll get the following:
- Special Dispatches: Deep dive visual briefings on crucial reports and global trends
- Markets This Month: A snappy summary of the state of the markets and what to look out for
- The Trendline: Weekly curation of the best visualizations from across the globe
- Global Forecast Series: Our flagship annual report that covers everything you need to know related to the economy, markets, geopolitics, and the latest tech trends
- VC+ Archive: Hundreds of previously released VC+ briefings and reports that you’ve been missing out on, all in one dedicated hub
You can get all of the above, and more, by joining VC+ today.

-

 Markets1 week ago
U.S. Debt Interest Payments Reach $1 Trillion
-

 Markets2 weeks ago
Charted: Big Four Market Share by S&P 500 Audits
-

 Markets2 weeks ago
Ranked: The Most Valuable Housing Markets in America
-

 Money2 weeks ago
Which States Have the Highest Minimum Wage in America?
-

 AI2 weeks ago
Ranked: Semiconductor Companies by Industry Revenue Share
-

 Markets2 weeks ago
Ranked: The World’s Top Flight Routes, by Revenue
-

 Countries2 weeks ago
Population Projections: The World’s 6 Largest Countries in 2075
-

 Markets2 weeks ago
The Top 10 States by Real GDP Growth in 2023