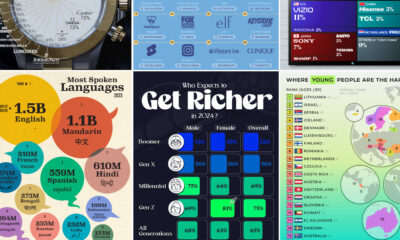

We round up the most popular, most discussed, and most liked visualizations of the month on Voronoi, our new data storytelling platform.


The world's three biggest religions have a combined 5 billion followers. We rank the most popular religions, based on recent estimates.
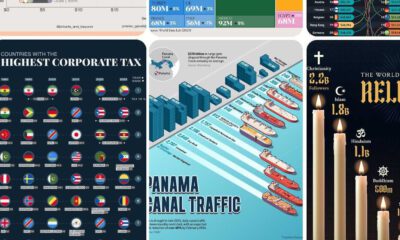

We round up the most popular, most discussed, and most liked visualizations of the month on Voronoi, our new data storytelling platform.
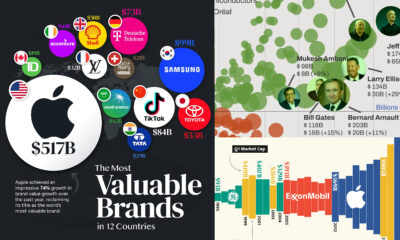

We round up the most popular, most discussed, and most liked visualizations of the month on Voronoi, our new and free data storytelling platform.
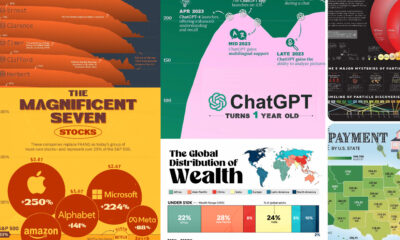

See the most popular, most discussed, and most liked visualizations on our new data storytelling app Voronoi in December.
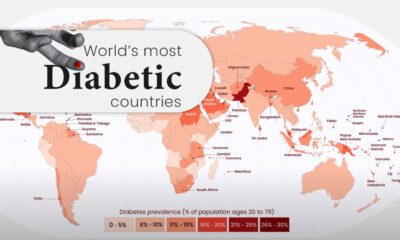

Diabetes affects millions of people around the world, but the spread isn't equal. This map highlights diabetes rates by country in 2021.
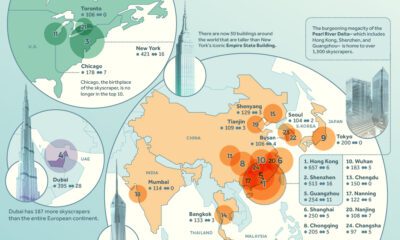

We rank the world's leading cities with the most skyscrapers, highlighting China's remarkable dominance in building vertically.
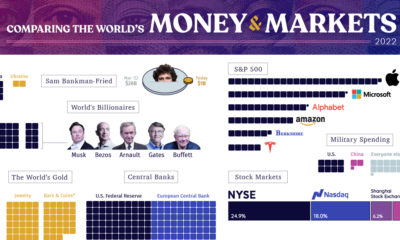

From the wealth held to billionaires to all debt in the global financial system, we look at the vast universe of money and markets in 2022.
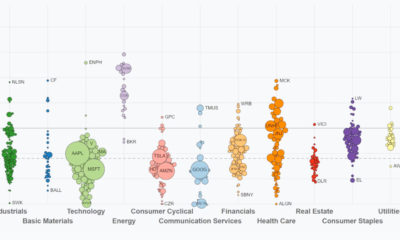

This video highlights S&P 500 performance through Q3. See how sectors and key companies have performed from Jan 1 to Sep 30, 2022.
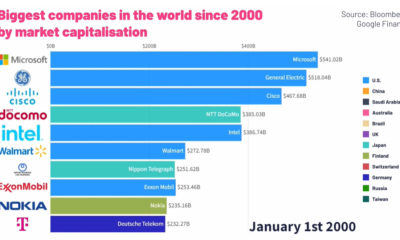

This animated graphic provides a breakdown of the world’s top ten largest public companies from 2000 to 2022.

We're closing in on reaching our funding goal for the VC App, but still need your help. Just 2 days are left to hit the goal.
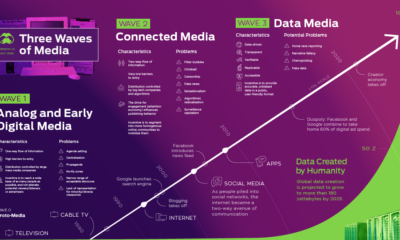

Media and information delivery is transforming at an increasing pace. Here's why the future will be more data-driven, transparent, and verifiable.
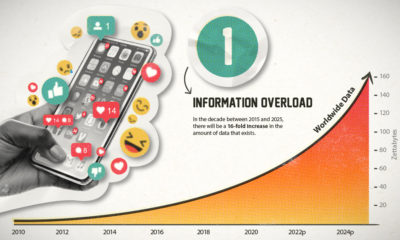

This era of data abundance should be propelling humankind forward, but valuable insights are often lost in the noise. Data storytelling holds the key.

Visual Capitalist is launching a new app that will combine powerful data and visual storytelling. Learn more about how to support it here.

Now, you can explore even more data-driven visualizations from the global talent in our newly launched Creator Program.
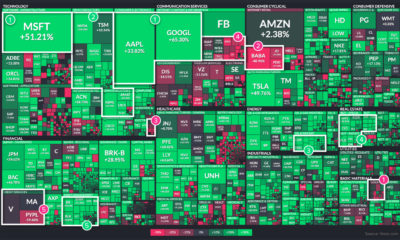

2021 was yet another tumultuous year. Which stock market sectors thrived during the twists and turns of the last 12 months, and which faltered?
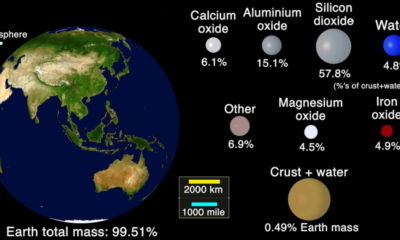

This animation shows the handful of minerals and elements that constitute the Earth's crust.
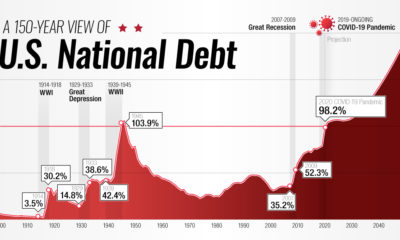

This interactive visual shows how the U.S. national debt has fluctuated since 1900, as well as projections all the way to 2050.
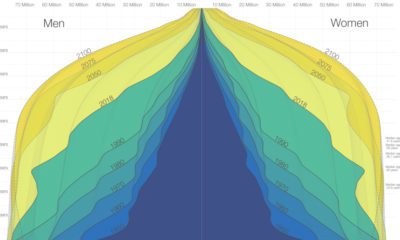

The world is in the midst of a notable demographic transition. Here's how the world population pyramid will change as we close in on the year...
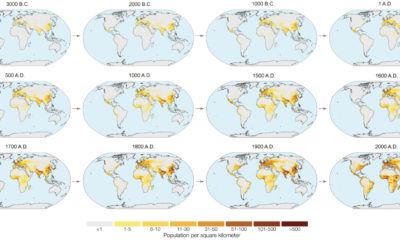

In the next year or so, humanity is expected to pass the 8 billion person milestone. These charts and maps put global population growth into context.
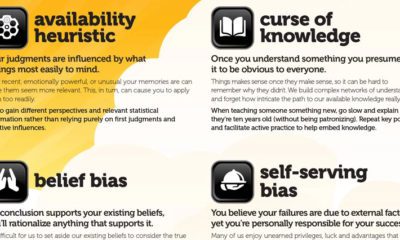

The world isn't as it seems—here are some of the most important cognitive biases that are messing with how you think the world works, and why.

Global literacy mapped by generation, as well as a look at how the data on literacy has changed over time by country.
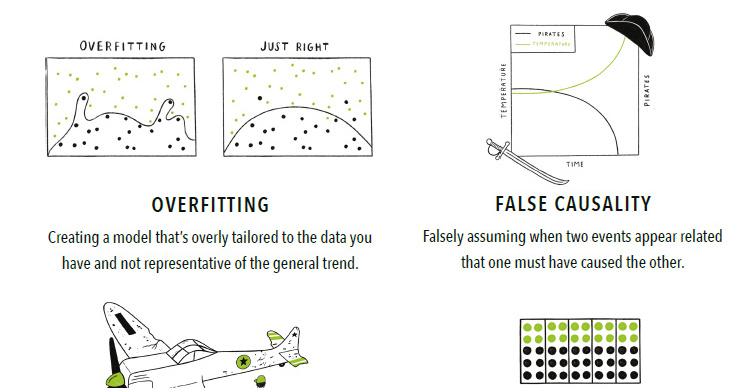
With so much data available, it's easy to make big mistakes when analyzing and interpreting it. Here are 15 of the most common data fallacies to...
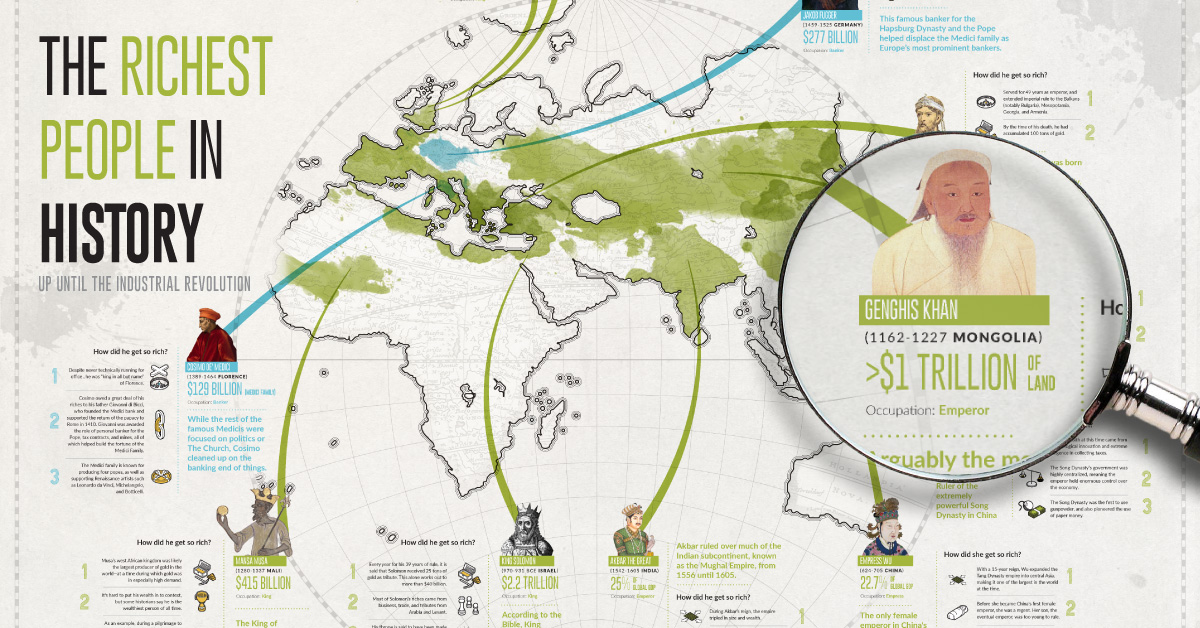
What do Augustus Caesar, Cosimo de Medici, Mansa Musa, and Genghis Khan have in common? They were some of the richest people in all of history.

Here's all 188 cognitive biases in existence, grouped by how they impact our thoughts and actions. We also give some specific cognitive bias examples.
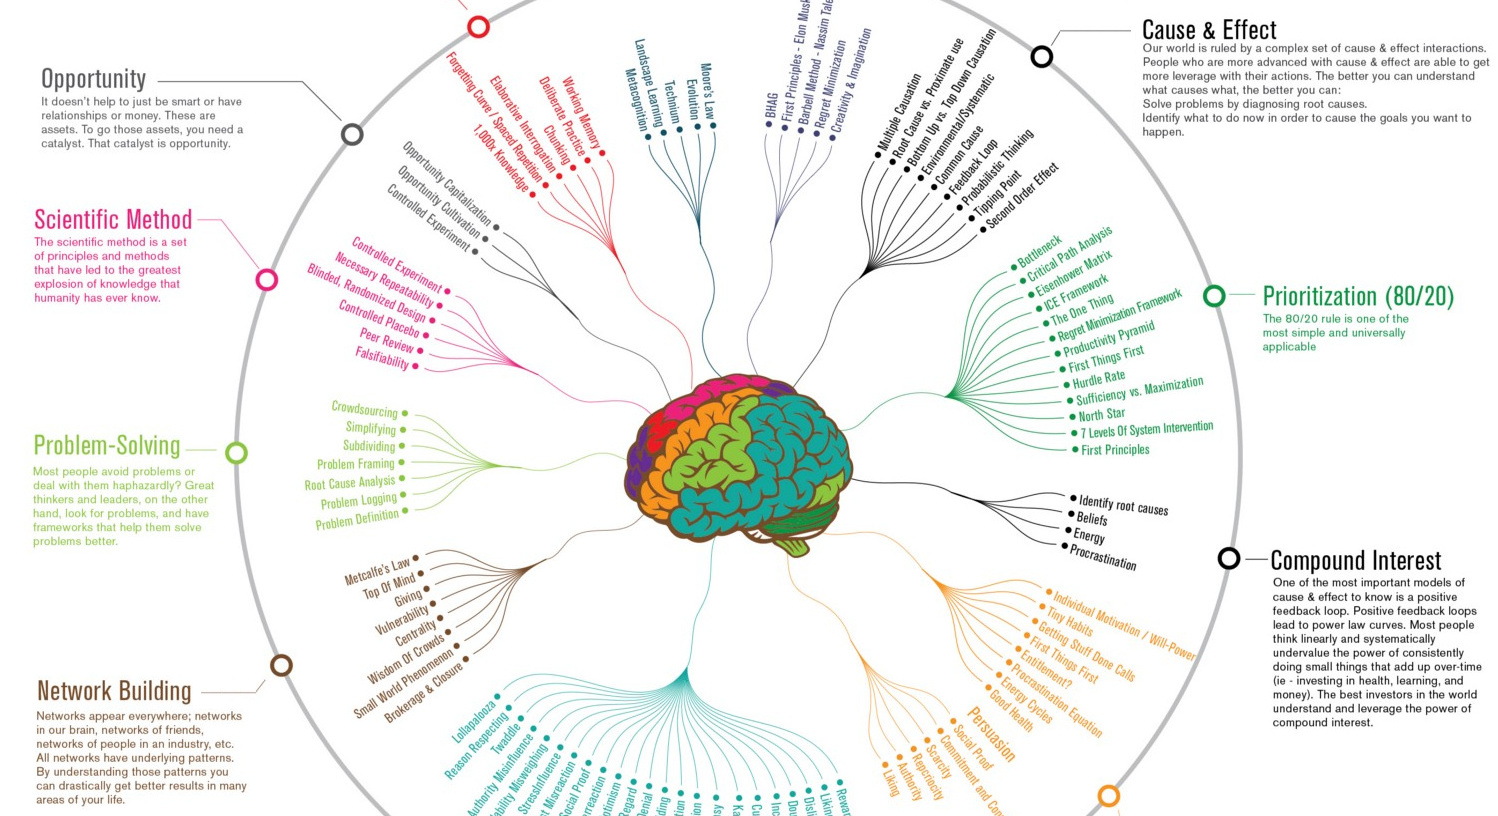
Highlighting and breaking down the 12 most useful and universal mental models that will make you smarter and more productive.
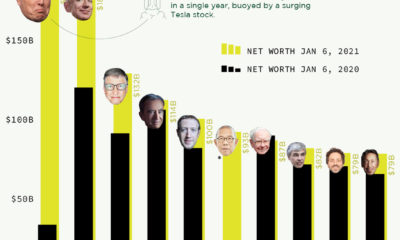

This year is touted as a year of change—and just six days in, there's already a new world's richest person in 2021: Elon Musk.

What forces will drive the future of financial markets? We reveal 15 charts from six chapters of our new book to show where the economy is...
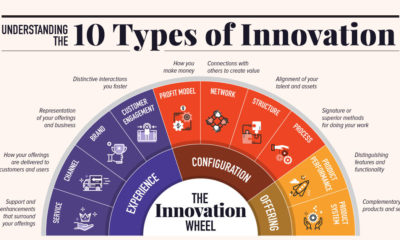

How do companies like Amazon and Apple consistently make game-changing products? Here are 10 types of innovation, and the tactics that lead to big breakthroughs.
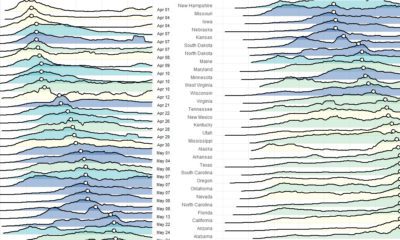

These charts and maps show the evolution of COVID-19's spread in the United States, by organizing data based on peak case and death dates.
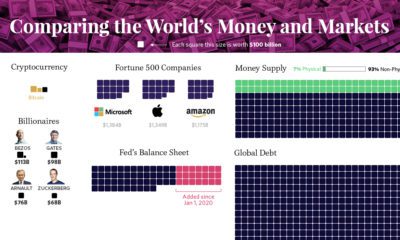

Our most famous visualization, updated for 2020 to show all global debt, wealth, money, and assets in one massive and mind-bending chart.
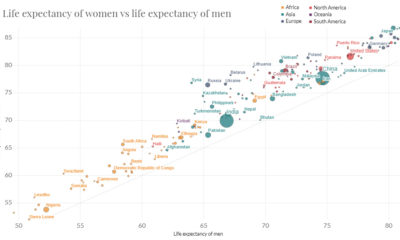

In just 65 years, global life expectancy has skyrocketed. See its ascent in this short animation, or dive into the interactive version for more data.
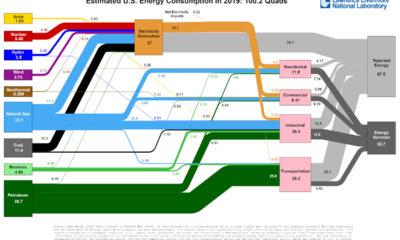

This incredible flow diagram shows how U.S. energy use broke down in 2019, including by source and end sector.
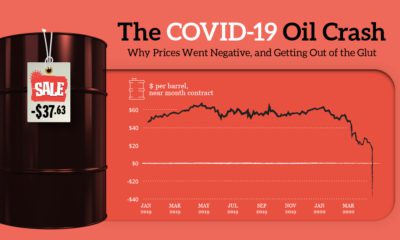

How oil prices went negative: this explainer shows how a collapse in demand, a Saudi-Russia price war, and oversupply led to futures prices going wonky.
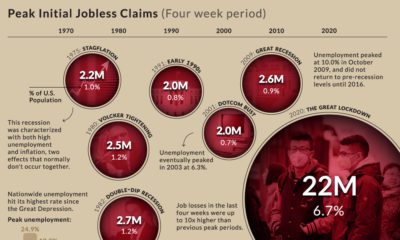

In the last four weeks, 22 million Americans filed initial jobless claims. Here's how that staggering number compares to the peaks of past recessions.

This month on VC+: an in-depth roundup on investor psychology, a behind the scenes look at making our new book, and of course, The Trendline.
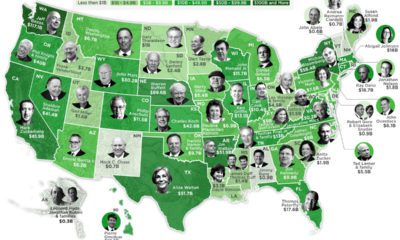

The biggest state fortunes range from $0.3 billion to $117.1 billion (Jeff Bezos). See the wealthiest person in every U.S. state on this map.
With so much misinformation spreading on the pandemic, we've compiled a quality list of data-driven and unbiased COVID-19 resources for you to use.
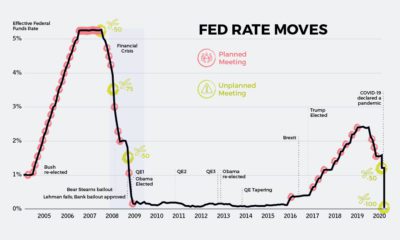

As interest rates continue their historic spiral downwards, the world's central banks are running out of conventional tools to settle markets.
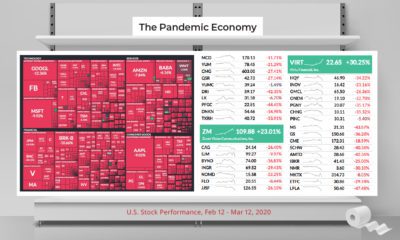

In the pandemic economy, the soup, toilet paper, and bleach companies are reigning supreme. See the stocks that have avoided the bug.

Thanks to overwhelming support from our audience, our new book is a go!


Mining stocks are high-risk, high-reward. Here's what you want to see in a management team, and some of the characters you want to avoid.


Pledge before March 12th, 2020 to help us fund the book, and to join us behind-the-scenes on our new and exciting journey.
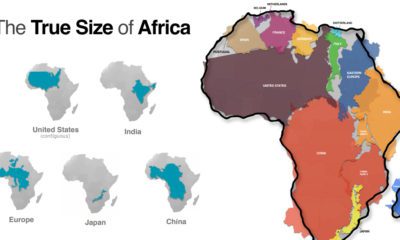

Common map projections warp our view of the globe. This graphic reveals the true size of Africa, which could fit the U.S., China, India, and more.
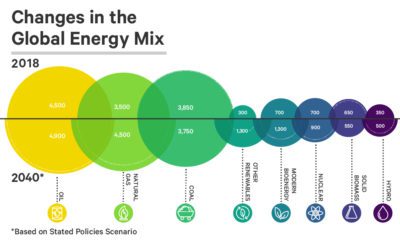

See how the world's future energy mix is expected to change by 2040, using projections based on two different policy scenarios.
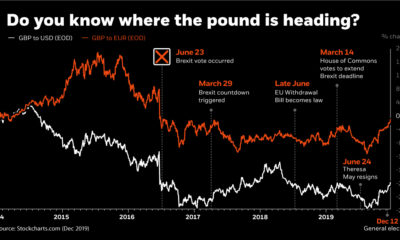

This infographic uses the recent Brexit-related volatility of the British pound to illustrate how currency risk can impact an investor's portfolio.
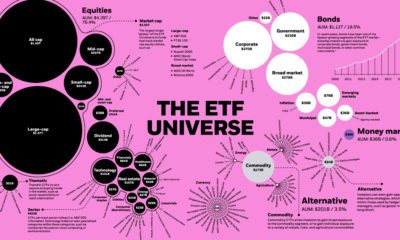

The global ETF universe has grown to be worth $5.75 trillion — here's how the assets break down by type, sector, and investment focus.
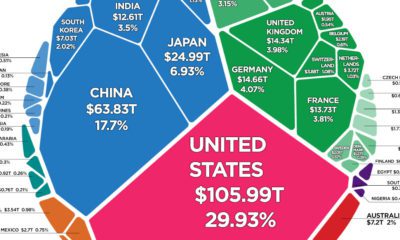

There is $360.6 trillion of wealth globally. This graphic shows how it breaks down by country, to show who owns all of the world's wealth.

Here's a sneak preview of features that VC+ members will get in their inbox in January 2020.
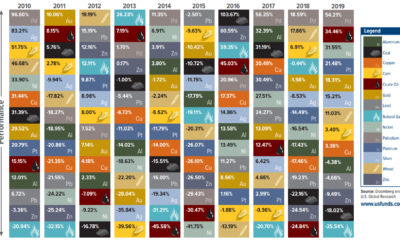

Which individual commodities were the best performers in 2019, and how do those numbers compare to the past decade of data?