Mining
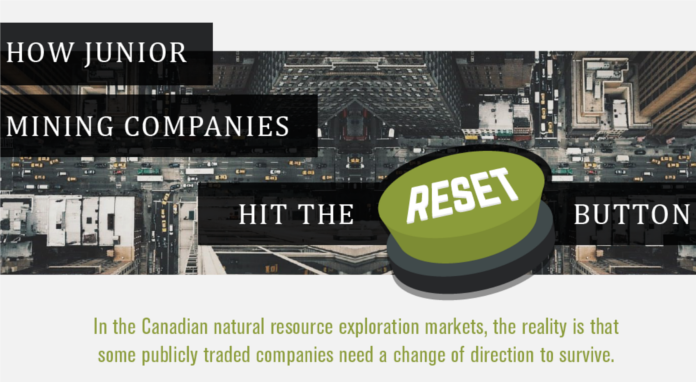
How to Avoid Common Mistakes With Mining Stocks (Part 1: Team)
For investors and speculators focused on growth, there is nothing more exciting than watching a stock go “on a run” for a big return.
Junior mining stocks, which are small publicly-traded companies that are aiming to make big discoveries, are well-known for being extremely high in both risk and reward.
But with a universe of thousands of available companies out there, how does an investor even begin to evaluate opportunities in this sector?
An Investor Checklist
We’ve partnered with Eclipse Gold Mining on an infographic series to show you how to avoid common mistakes when evaluating and investing in mining exploration stocks.
Part 1 of the series focuses on what to look for in a management team, including the types of characters you’ll want to avoid!

If you’ve ever researched mining exploration stocks before, it doesn’t take long to realize that every company will talk about how “great” their team is.
Here’s a few steps to ensure that the team is actually great — and not filled with pretenders.
Management Team Checklist
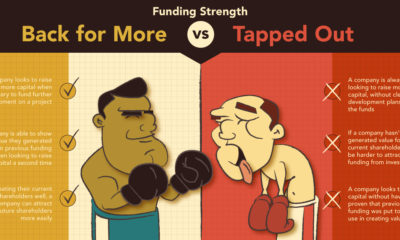
Step 1: Avoid the Bad Characters
The mining stock universe can be filled with interesting and amusing characters, but many of them are not there to generate you a return. Here are the personas you should aim to avoid:
- The Close-ologist
Funds new enterprises by staking land around a project that the market currently finds exciting. - The Trend Chaser
Jumps from industry to industry, or mineral to mineral, to chase the market’s flavor of the week. - The Pump n’ Dumper
Accumulates stock at insanely low prices, raises money, and then uses gray-area promotional strategies. Sells stock as soon as price is high enough to make a profit. - The Commodity Collector
Builds up an extensive list of ongoing assets and projects, thinking that this reduces risk. But really, it just reduces focus. - The Lifestyle Executive
Uses shareholder money almost exclusively to fund the salaries of management and other G&A expenses. Almost no actual work gets done. - The Optimistic Geologist
This is usually the pet project of a geologist, and the project may have some merit. However, time is the enemy of the Optimistic Geologist.
It’s also not impossible for CEOs to exhibit two or more of these personas at once, so beware.
Step 2: Traits You Want to See
Examine the management team and the board of directors, and dig deep into their history. Here’s what you want to actually see:
| Wanted Traits | Description |
|---|---|
| A clear vision | Management has articulated a clear vision for the company and how it will create value for shareholders. |
| Winning track record | Management has made previous discoveries and has successfully exited companies in the past, taking shareholders along for the ride. |
| Skin in the game" | Simply put, management owns sufficient shares of the company (not just options) and has the incentive to succeed. |
| Transparency | Management has a history of integrity, being honest with shareholders in every circumstance. |
| Relevant expertise | Management has hired a team that has relevant experience, knowledge, and connections that can help advance the vision. |
| Business mindset | Management has a plan to generate ROI for shareholders and knows how to execute on that plan. |
Step 3: Past Performance
Finally, look to see how the management team in question has handled situations in the past. The following questions will help you evaluate:
- Have they been able to consistently fund projects in the past, even in bad markets, without overdiluting shareholders?
- Is the team well-rounded? Do they have expertise covering multiple fields?
- Did they do what they said they’d do, while sticking to timelines?
- Does the team have connections to major mining companies, major banks, or other important institutions?
- Has the team successfully exited from their previous ventures?
The De-risking Imperative
You can’t control everything that happens in the market.
But by successfully de-risking each management team with these criteria, you can better your odds at success in a high-risk, high-reward market.
This is part 1 of a five-part series on common mistakes made by investors when evaluating mining exploration stocks. Stay tuned for the upcoming parts in the series, covering other topics like jurisdiction, project quality, and more.


Lithium
Ranked: The Top 10 EV Battery Manufacturers in 2023
Asia dominates this ranking of the world’s largest EV battery manufacturers in 2023.


The Top 10 EV Battery Manufacturers in 2023
This was originally posted on our Voronoi app. Download the app for free on iOS or Android and discover incredible data-driven charts from a variety of trusted sources.
Despite efforts from the U.S. and EU to secure local domestic supply, all major EV battery manufacturers remain based in Asia.
In this graphic we rank the top 10 EV battery manufacturers by total battery deployment (measured in megawatt-hours) in 2023. The data is from EV Volumes.
Chinese Dominance
Contemporary Amperex Technology Co. Limited (CATL) has swiftly risen in less than a decade to claim the title of the largest global battery group.
The Chinese company now has a 34% share of the market and supplies batteries to a range of made-in-China vehicles, including the Tesla Model Y, SAIC’s MG4/Mulan, and various Li Auto models.
| Company | Country | 2023 Production (megawatt-hour) | Share of Total Production |
|---|---|---|---|
| CATL | 🇨🇳 China | 242,700 | 34% |
| BYD | 🇨🇳 China | 115,917 | 16% |
| LG Energy Solution | 🇰🇷 Korea | 108,487 | 15% |
| Panasonic | 🇯🇵 Japan | 56,560 | 8% |
| SK On | 🇰🇷 Korea | 40,711 | 6% |
| Samsung SDI | 🇰🇷 Korea | 35,703 | 5% |
| CALB | 🇨🇳 China | 23,493 | 3% |
| Farasis Energy | 🇨🇳 China | 16,527 | 2% |
| Envision AESC | 🇨🇳 China | 8,342 | 1% |
| Sunwoda | 🇨🇳 China | 6,979 | 1% |
| Other | - | 56,040 | 8% |
In 2023, BYD surpassed LG Energy Solution to claim second place. This was driven by demand from its own models and growth in third-party deals, including providing batteries for the made-in-Germany Tesla Model Y, Toyota bZ3, Changan UNI-V, Venucia V-Online, as well as several Haval and FAW models.
The top three battery makers (CATL, BYD, LG) collectively account for two-thirds (66%) of total battery deployment.
Once a leader in the EV battery business, Panasonic now holds the fourth position with an 8% market share, down from 9% last year. With its main client, Tesla, now sourcing batteries from multiple suppliers, the Japanese battery maker seems to be losing its competitive edge in the industry.
Overall, the global EV battery market size is projected to grow from $49 billion in 2022 to $98 billion by 2029, according to Fortune Business Insights.

-

 Debt1 week ago
How Debt-to-GDP Ratios Have Changed Since 2000
-

 Markets2 weeks ago
Ranked: The World’s Top Flight Routes, by Revenue
-

 Countries2 weeks ago
Population Projections: The World’s 6 Largest Countries in 2075
-

 Markets2 weeks ago
The Top 10 States by Real GDP Growth in 2023
-

 Demographics2 weeks ago
The Smallest Gender Wage Gaps in OECD Countries
-

 United States2 weeks ago
Where U.S. Inflation Hit the Hardest in March 2024
-

 Green2 weeks ago
Top Countries By Forest Growth Since 2001
-

 United States2 weeks ago
Ranked: The Largest U.S. Corporations by Number of Employees