Economy
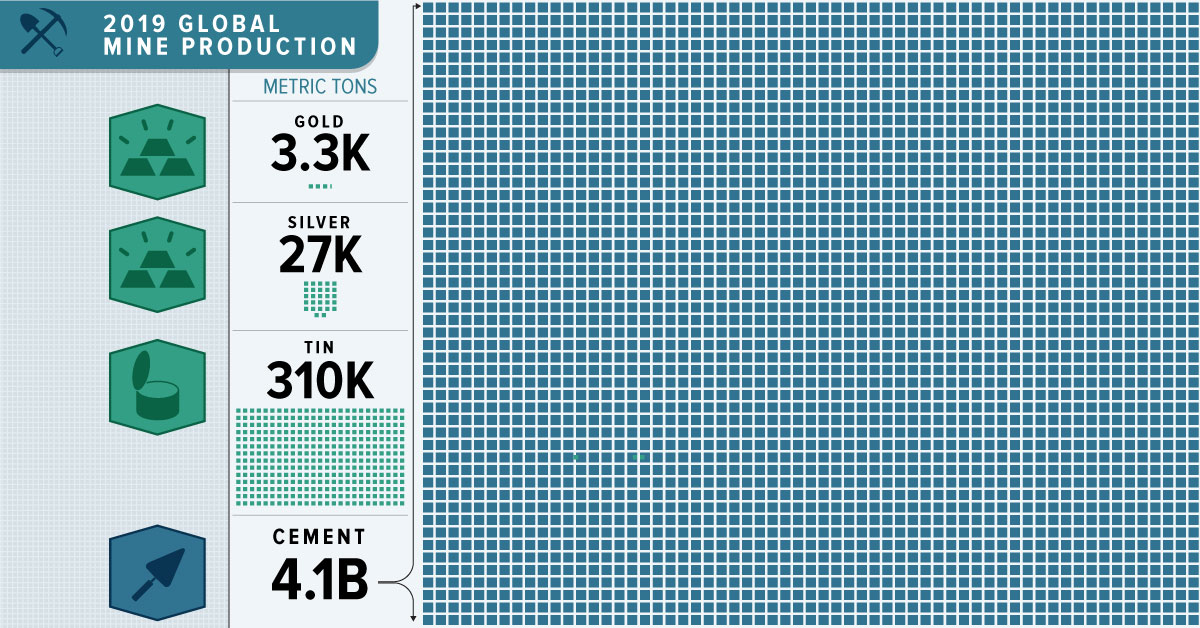
All the World’s Metals and Minerals in One Visualization

 Can I share this graphic?
 When do I need a license?
 Interested in this piece?
All the World’s Metals and Minerals in One Visualization
We live in a material world, in that we rely on materials to make our lives better. Without even realizing it, humans consume enormous amounts of metals and minerals with every convenient food package, impressive building, and technological innovation.
Every year, the United States Geological Service (USGS) publishes commodity summaries outlining global mining statistics for over 90 individual minerals and materials. Today’s infographic visualizes the data to reveal the dramatic scale of 2019 non-fuel mineral production.
Read all the way to the bottom; the data will surprise you.
Non-Fuel Minerals: USGS Methodology
A wide variety of minerals can be classified as “non-fuel”, including precious metals, base metals, industrial minerals, and materials used for construction.
Non-fuel minerals are those not used for fuel, such as oil, natural gas and coal. Once non-fuel minerals are used up, there is no replacing them. However, many can be recycled continuously.
The USGS tracked both refinery and mine production of these various minerals. This means that some minerals are the essential ingredients for others on the list. For example, iron ore is critical for steel production, and bauxite ore gets refined into aluminum.
Top 10 Minerals and Metals by Production
Sand and gravel are at the top of the list of non-fuel mineral production.
As these materials are the basic components for the manufacturing of concrete, roads, and buildings, it’s not surprising they take the lead.
| Rank | Metal/Mineral | 2019 Production (millions of metric tons) |
|---|---|---|
| #1 | Sand and Gravel | 50,000 |
| #2 | Cement | 4,100 |
| #3 | Iron and Steel | 3,200 |
| #4 | Iron Ore | 2,500 |
| #5 | Bauxite | 500 |
| #6 | Lime | 430 |
| #7 | Salt | 293 |
| #8 | Phosphate Rock | 240 |
| #9 | Nitrogen | 150 |
| #10 | Gypsum | 140 |
These materials fertilize the food we eat, and they also form the structures we live in and the roads we drive on. They are the bones of the global economy.
Let’s dive into some more specific categories covered on the infographic.
Base Metals
While cement, sand, and gravel may be the bones of global infrastructure, base metals are its lifeblood. Their consumption is an important indicator of the overall health of an economy.
Base metals are non-ferrous, meaning they contain no iron. They are often more abundant in nature and sometimes easier to mine, so their prices are generally lower than precious metals.
| Rank | Base Metal | 2019 Production (millions of metric tons) |
|---|---|---|
| #1 | Aluminum | 64.0 |
| #2 | Copper | 20.0 |
| #3 | Zinc | 13.0 |
| #4 | Lead | 4.5 |
| #5 | Nickel | 2.7 |
| #6 | Tin | 0.3 |
Base metals are also the critical materials that will help to deliver a green and renewable future. The electrification of everything will require vast amounts of base metals to make everything from batteries to solar cells work.
Precious Metals
Gold and precious metals grab the headlines because of their rarity — and their production shows just how rare they are.
| Rank | Precious Metal | 2019 Production (metric tons) |
|---|---|---|
| #1 | Silver | 27,000 |
| #2 | Gold | 3,300 |
| #3 | Palladium | 210 |
| #4 | Platinum | 180 |
While metals form the structure and veins of the global economy, ultimately it is humans and animals that make the flesh of the world, driving consumption patterns.
A Material World: A Perspective on Scale
The global economy’s appetite for materials has quadrupled since 1970, faster than the population, which only doubled. On average, each human uses more than 13 metric tons of materials per year.
In 2017, it’s estimated that humans consumed 100.6B metric tons of material in total. Half of the total comprises sand, clay, gravel, and cement used for building, along with the other minerals mined to produce fertilizer. Coal, oil, and gas make up 15% of the total, while metal makes up 10%. The final quarter are plants and trees used for food and fuel.


Economy
Economic Growth Forecasts for G7 and BRICS Countries in 2024
The IMF has released its economic growth forecasts for 2024. How do the G7 and BRICS countries compare?


G7 & BRICS Real GDP Growth Forecasts for 2024
The International Monetary Fund’s (IMF) has released its real gross domestic product (GDP) growth forecasts for 2024, and while global growth is projected to stay steady at 3.2%, various major nations are seeing declining forecasts.
This chart visualizes the 2024 real GDP growth forecasts using data from the IMF’s 2024 World Economic Outlook for G7 and BRICS member nations along with Saudi Arabia, which is still considering an invitation to join the bloc.
Get the Key Insights of the IMF’s World Economic Outlook
Want a visual breakdown of the insights from the IMF’s 2024 World Economic Outlook report?
This visual is part of a special dispatch of the key takeaways exclusively for VC+ members.
Get the full dispatch of charts by signing up to VC+.
Mixed Economic Growth Prospects for Major Nations in 2024
Economic growth projections by the IMF for major nations are mixed, with the majority of G7 and BRICS countries forecasted to have slower growth in 2024 compared to 2023.
Only three BRICS-invited or member countries, Saudi Arabia, the UAE, and South Africa, have higher projected real GDP growth rates in 2024 than last year.
| Group | Country | Real GDP Growth (2023) | Real GDP Growth (2024P) |
|---|---|---|---|
| G7 | 🇺🇸 U.S. | 2.5% | 2.7% |
| G7 | 🇨🇦 Canada | 1.1% | 1.2% |
| G7 | 🇯🇵 Japan | 1.9% | 0.9% |
| G7 | 🇫🇷 France | 0.9% | 0.7% |
| G7 | 🇮🇹 Italy | 0.9% | 0.7% |
| G7 | 🇬🇧 UK | 0.1% | 0.5% |
| G7 | 🇩🇪 Germany | -0.3% | 0.2% |
| BRICS | 🇮🇳 India | 7.8% | 6.8% |
| BRICS | 🇨🇳 China | 5.2% | 4.6% |
| BRICS | 🇦🇪 UAE | 3.4% | 3.5% |
| BRICS | 🇮🇷 Iran | 4.7% | 3.3% |
| BRICS | 🇷🇺 Russia | 3.6% | 3.2% |
| BRICS | 🇪🇬 Egypt | 3.8% | 3.0% |
| BRICS-invited | 🇸🇦 Saudi Arabia | -0.8% | 2.6% |
| BRICS | 🇧🇷 Brazil | 2.9% | 2.2% |
| BRICS | 🇿🇦 South Africa | 0.6% | 0.9% |
| BRICS | 🇪🇹 Ethiopia | 7.2% | 6.2% |
| 🌍 World | 3.2% | 3.2% |
China and India are forecasted to maintain relatively high growth rates in 2024 at 4.6% and 6.8% respectively, but compared to the previous year, China is growing 0.6 percentage points slower while India is an entire percentage point slower.
On the other hand, four G7 nations are set to grow faster than last year, which includes Germany making its comeback from its negative real GDP growth of -0.3% in 2023.
Faster Growth for BRICS than G7 Nations
Despite mostly lower growth forecasts in 2024 compared to 2023, BRICS nations still have a significantly higher average growth forecast at 3.6% compared to the G7 average of 1%.
While the G7 countries’ combined GDP is around $15 trillion greater than the BRICS nations, with continued higher growth rates and the potential to add more members, BRICS looks likely to overtake the G7 in economic size within two decades.
BRICS Expansion Stutters Before October 2024 Summit
BRICS’ recent expansion has stuttered slightly, as Argentina’s newly-elected president Javier Milei declined its invitation and Saudi Arabia clarified that the country is still considering its invitation and has not joined BRICS yet.
Even with these initial growing pains, South Africa’s Foreign Minister Naledi Pandor told reporters in February that 34 different countries have submitted applications to join the growing BRICS bloc.
Any changes to the group are likely to be announced leading up to or at the 2024 BRICS summit which takes place October 22-24 in Kazan, Russia.
Get the Full Analysis of the IMF’s Outlook on VC+
This visual is part of an exclusive special dispatch for VC+ members which breaks down the key takeaways from the IMF’s 2024 World Economic Outlook.
For the full set of charts and analysis, sign up for VC+.

-

 Debt1 week ago
How Debt-to-GDP Ratios Have Changed Since 2000
-

 Markets2 weeks ago
Ranked: The World’s Top Flight Routes, by Revenue
-

 Countries2 weeks ago
Population Projections: The World’s 6 Largest Countries in 2075
-

 Markets2 weeks ago
The Top 10 States by Real GDP Growth in 2023
-

 Demographics2 weeks ago
The Smallest Gender Wage Gaps in OECD Countries
-

 United States2 weeks ago
Where U.S. Inflation Hit the Hardest in March 2024
-

 Green2 weeks ago
Top Countries By Forest Growth Since 2001
-

 United States2 weeks ago
Ranked: The Largest U.S. Corporations by Number of Employees