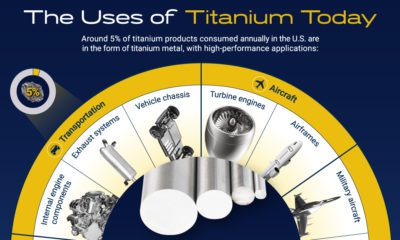

This infographic explores titanium's growth markets and potential for mainstream application.


Energy fuels led the way as commodity prices surged in 2021, with only precious metals providing negative returns.
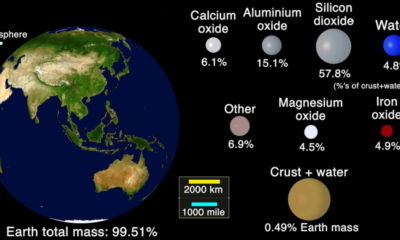

This animation shows the handful of minerals and elements that constitute the Earth's crust.
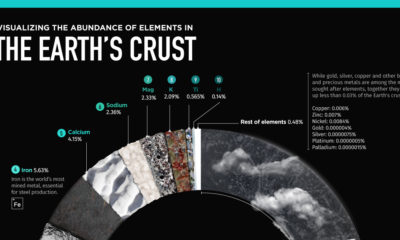

The Earth's crust makes up 1% of the planet's volume, but provides all the material we use. What elements make up this thin layer we stand...
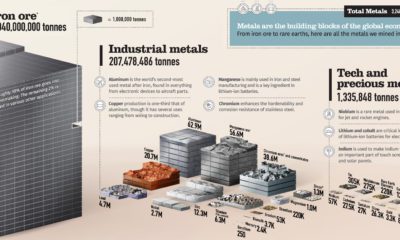

From iron ore to rare earths, over 3 billion tonnes of metals are mined each year. This chart shows them all on a relative scale.
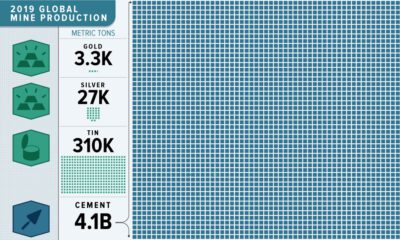

This massive infographic reveals the dramatic scale of 2019 non-fuel mineral global production.

For 50 years, the CRU Group has tracked the commodities that drive the modern world, bringing macroeconomic insights to investors for accurate pricing.
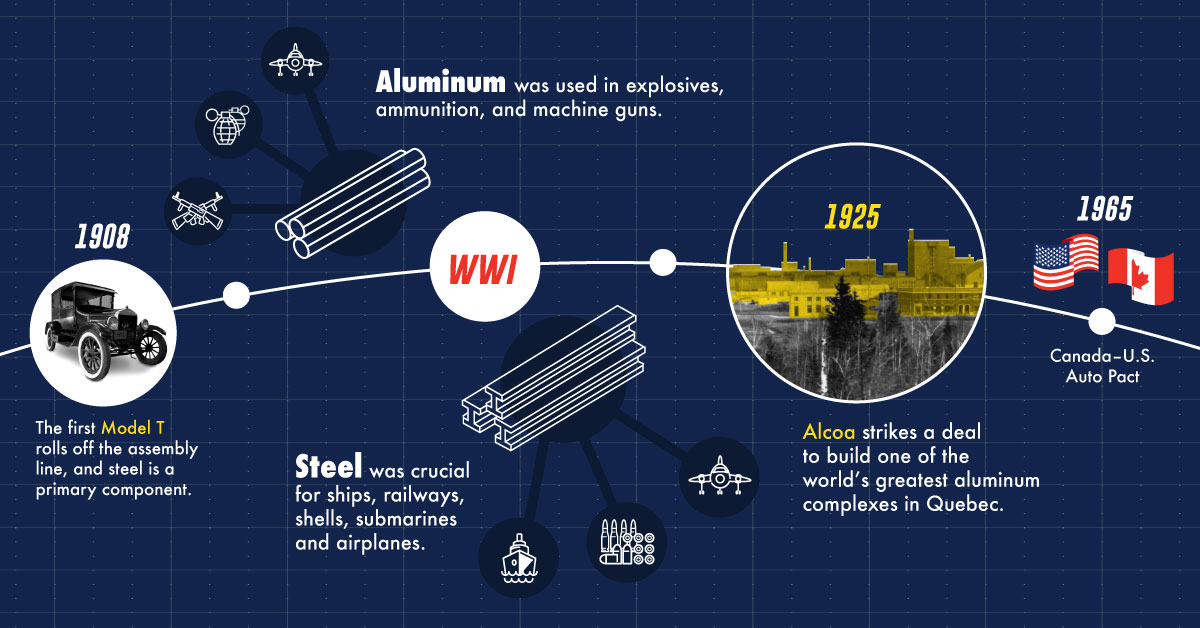
Aluminum and steel are two metals at the center of the current trade debate. This infographic provides context on the history of the metals in North...
The Model S has been lauded for its safety, range, and design. Equally impressive, however, are the raw materials that go into a Tesla Model S.
Aluminum (or aluminium) is the world's most common metal by crustal abundance, making up 8.2% of mass. Aluminum was not isolated all the way until 1827.


 Creator Program