Uncategorized
Silver Series: Perfect Storm for Silver (Part 2 of 3)

The Silver Series: A Perfect Storm for Silver (Part 2 of 3)
In Part 1 of the Silver Series we showed how precious metals can be a safe haven during times of volatility in a debt-laden era.
Today’s infographic is Part Two of the Silver Series, and it comes to us from Endeavour Silver, outlining some of the key supply and demand indicators that precede a coming gold-silver cycle in which the price of silver could move upwards.
Silver Fundamentals
Silver is produced primarily as a by-product in the mining of non-precious metals, and there is currently a dwindling supply of silver as a result of low base metal prices.
However, silver is more than just a precious metal and a safe haven investment. Its industrial uses also create a significant demand on silver stocks.
As the production of green technologies such as solar cells and EVs quickly escalates, upward pressure is being placed on the price of silver, indicating the potential start of a new gold-silver cycle in the market.
Investment Demand
Just like gold, silver has functioned as a form of money for centuries, and its role as a store of value and hedge against monetary inflation endures.
Currency debasement is not new. Governments throughout history have “printed” money while silver’s value has held more constant over time.
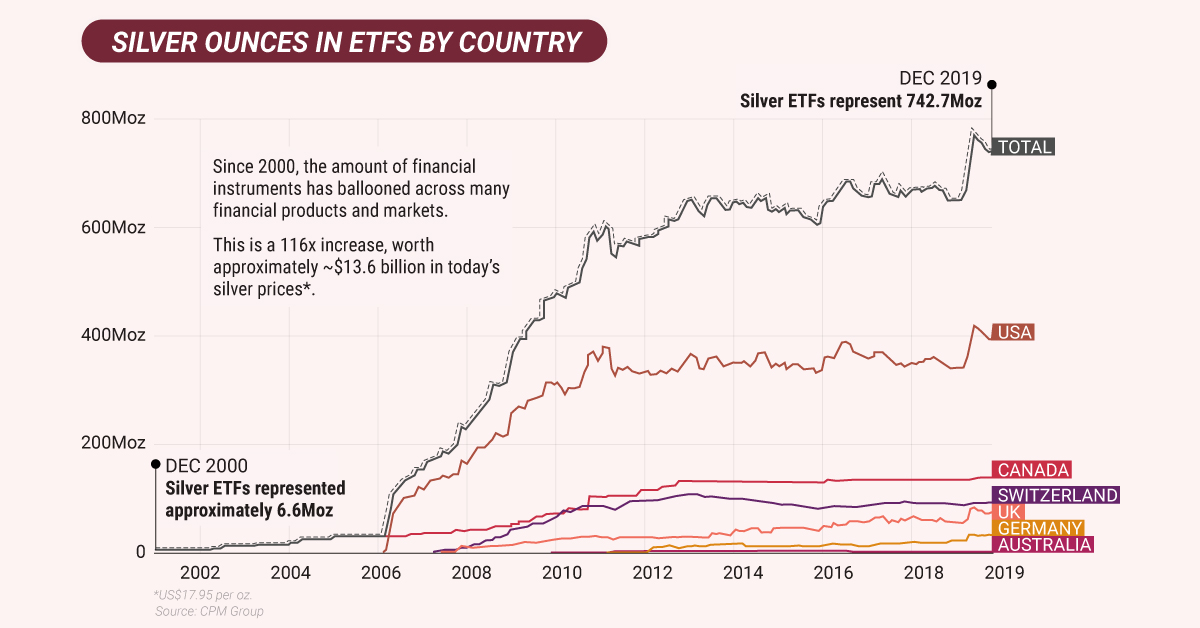
In today’s age, the average investor does not own physical silver. Rather, they invest in financial instruments that track the performance of the physical commodity itself, such as silver exchange-traded funds (ETFs).
Until recently, ETF investment in precious metals has been relatively flat, but there has been a surge in the price of silver. Meanwhile, demand for silver-backed financial products have increased the demand for physical silver and could continue to do so.
Industrial Demand
Silver is also helping to power the green revolution.
The precious metal is the best natural conductor of electricity and heat, and it plays an important role in the production of solar-powered energy. A silver paste is used in photovoltaic solar cells which collects electrons and creates electricity. Silver then helps conduct the electricity out of the cell. Without silver, solar cells would not be as efficient.
As investments and the green revolution demand more and more silver, where is the metal coming from?
A Perfect Storm for Silver: Supply Crunch
The bulk of silver production comes as a by-product of other metal mines, such as zinc, copper, or gold mines.
Since silver is not the primary metal emerging from some of these mines, it faces supply crunches when other metal prices are low.
Silver supply is falling for three reasons:
- Declining mine production due to low base metal prices
- Declining silver mine capacity
- Declining reserves of silver
The demand for silver is rising and the few companies that produce silver could shine.
Don’t miss another part of the Silver Series by connecting with Visual Capitalist.


Uncategorized
Ranked: The 50 Most Innovative Companies
Companies need to adapt quickly to changing markets in order to thrive. Here’s a look at the top 50 most innovative companies in 2020.
Ranked: the Top 50 Most Innovative Companies in 2020
Corporate longevity is on the decline. In the 1960s, a typical S&P 500 company was estimated to last more than 60 years—these days, the average lifespan is just 18 years.
In today’s fast-paced world, companies need to stay relevant in order to survive. Because of this, it’s become increasingly more important for businesses to prioritize innovation.
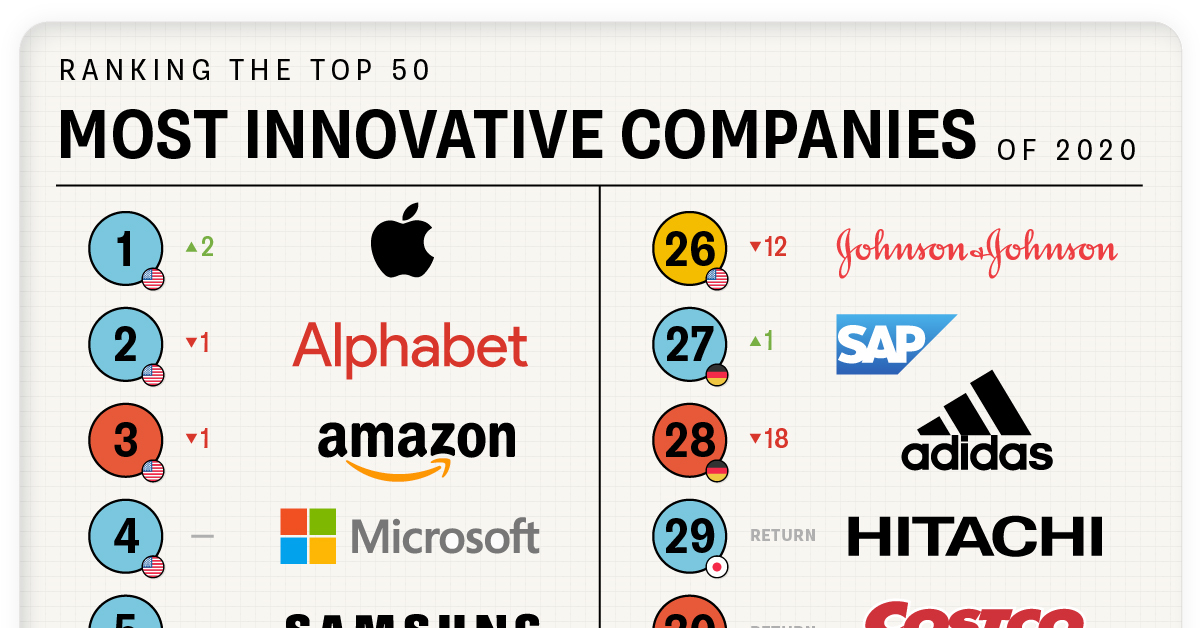
This chart looks at the top 50 most innovative companies in 2020, based on a survey by Boston Consulting Group (BCG). The companies have been ranked based on four variables:
- Global “Mindshare”: The number of votes from all innovation executives.
- Industry Peer Review: The number of votes from executives in a company’s industry.
- Industry Disruption: A diversity index to measure votes across industries.
- Value Creation: Total share return.
Breakdown of the Leaderboard
BCG has been ranking the most innovative companies since 2005. Here’s a look at the top 50 most innovative companies in 2020:
| Rank | Company | Industry | HQ | Change from 2019 |
|---|---|---|---|---|
| 1 | Apple | Technology | U.S. | 2 |
| 2 | Alphabet | Technology | U.S. | -1 |
| 3 | Amazon | Consumer Goods | U.S. | -1 |
| 4 | Microsoft | Technology | U.S. | - |
| 5 | Samsung | Technology | South Korea | - |
| 6 | Huawei | Technology | China | 42 |
| 7 | Alibaba | Consumer Goods | China | 16 |
| 8 | IBM | Technology | U.S. | -1 |
| 9 | Sony | Consumer Goods | Japan | return |
| 10 | Technology | U.S. | -2 | |
| 11 | Tesla | Transportation & Energy | U.S. | -2 |
| 12 | Cisco Systems | Technology | U.S. | 5 |
| 13 | Walmart | Consumer Goods | U.S. | 29 |
| 14 | Tencent | Other | China | return |
| 15 | HP Inc. | Technology | U.S. | 29 |
| 16 | Nike | Consumer Goods | U.S. | return |
| 17 | Netflix | Other | U.S. | -11 |
| 18 | LG Electronics | Consumer Goods | South Korea | - |
| 19 | Intel | Technology | U.S. | return |
| 20 | Dell | Technology | U.S. | 21 |
| 21 | Siemens | Other | Germany | -5 |
| 22 | Target | Consumer Goods | U.S. | return |
| 23 | Philips | Pharmaceuticals & Medtech | Netherlands | 6 |
| 24 | Xiaomi | Technology | China | return |
| 25 | Oracle | Technology | U.S. | return |
| 26 | Johnson & Johnson | Pharmaceuticals & Medtech | U.S. | -12 |
| 27 | SAP | Technology | Germany | 1 |
| 28 | Adidas | Consumer Goods | Germany | -18 |
| 29 | Hitachi | Technology | Japan | return |
| 30 | Costco | Consumer Goods | U.S. | return |
| 31 | JD.com | Consumer Goods | China | new |
| 32 | Volkswagen | Transportation & Energy | Germany | 6 |
| 33 | Bosch | Transportation & Energy | Germany | new |
| 34 | Airbus | Transportation & Energy | Netherlands | return |
| 35 | Salesforce | Technology | U.S. | -2 |
| 36 | JPMorgan Chase | Other | U.S. | -16 |
| 37 | Uber | Technology | U.S. | return |
| 38 | Bayer | Pharmaceuticals & Medtech | Germany | -14 |
| 39 | Procter & Gamble | Consumer Goods | U.S. | return |
| 40 | Royal Dutch Shell | Transportation & Energy | Netherlands | -10 |
| 41 | Toyota | Transportation & Energy | Japan | -4 |
| 42 | Nestle | Consumer Goods | Switzerland | return |
| 43 | ABB | Other | Switzerland | new |
| 44 | 3M | Other | U.S. | -5 |
| 45 | Unilever | Consumer Goods | U.K. | -13 |
| 46 | FCA | Transportation & Energy | U.K. | new |
| 47 | Novartis | Pharmaceuticals & Medtech | Switzerland | new |
| 48 | Coca-Cola | Consumer Goods | U.S. | return |
| 49 | Volvo | Transportation & Energy | Sweden | new |
| 50 | McDonald’s | Consumer Goods | U.S. | -29 |
When you think about innovative companies, Walmart might not be top of mind. However, the retail giant has moved up to the 13th spot on the list, an increase of 29 places since 2019.
Walmart has put significant efforts into its e-commerce and omnichannel offerings. For instance, the company launched NextDay Delivery in 2020, and now offers one-day delivery to a majority of the U.S. population. The company also has a stake in the Chinese e-commerce platform JD.com, which has grown from 5% to 12%.
Costco makes it to 30th place this year, and the company is known for its effective use of data. Thanks to the company’s members-only model, it has been able to compile a ton of information on its customers. It uses this data not only for marketing purposes, but to help streamline processes like recall notices. Costco also uses data monitoring sensors in its warehouses to save money on water usage and to spot any potential leaks before they happen.
Another company worth touching on is Huawei—the Chinese tech company has taken the 6th spot, a 42 rank increase since 2019. This rise in the ranks is likely due to the company’s significant $19 billion investment in research and development (R&D) in 2019. These types of investments seem to be paying off, as Huawei sold more smartphones in 2019 than Apple.
Innovation Leaders Come in All Sizes
While people may picture startups when they think of innovation and adaptability, big firms aren’t lagging far behind when it comes to innovation output.
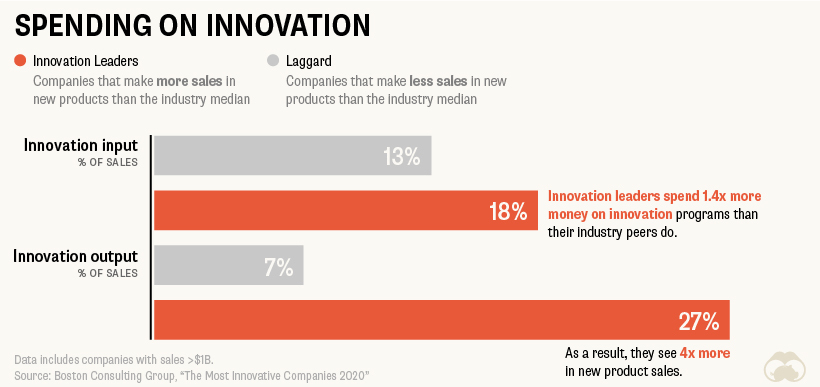
In this context, firms with new product sales above their industry median are considered “innovation leaders.” Although 52% of small firms are considered innovation leaders, 43% of large firms still find themselves in the same boat.
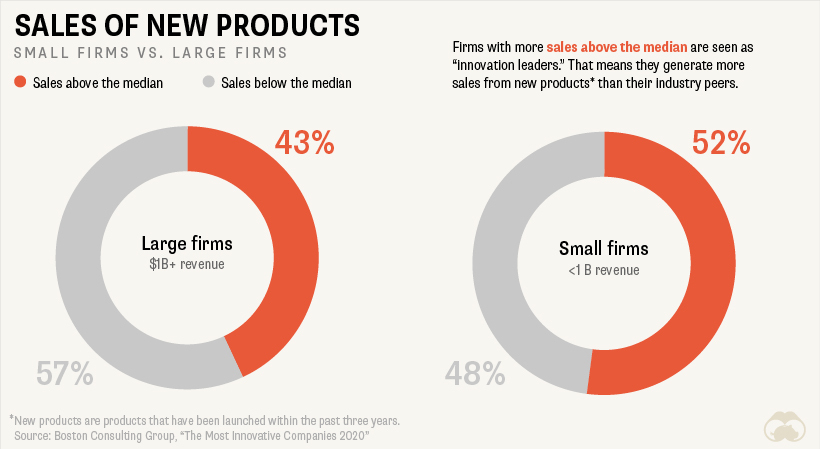
In fact, because larger firms generally have more access to resources and manpower than smaller firms, they often have an advantage when it comes to research and development and the creation of innovation-focused programs.
Investing in innovation shows a far greater payoff down the line—firms that invested 1.4x more in innovation input saw 4x the amount of new products sales.
Innovation as a Lifestyle
Unless you’re in a startup that’s hoping to get acquired by a larger firm, innovation can’t be a one-hit-wonder. Yet, despite its importance, innovation over the long term is hard to maintain.
There have only been 8 companies that have appeared on the list every year. Here’s a look at the companies that have consistently made the cut since 2005:
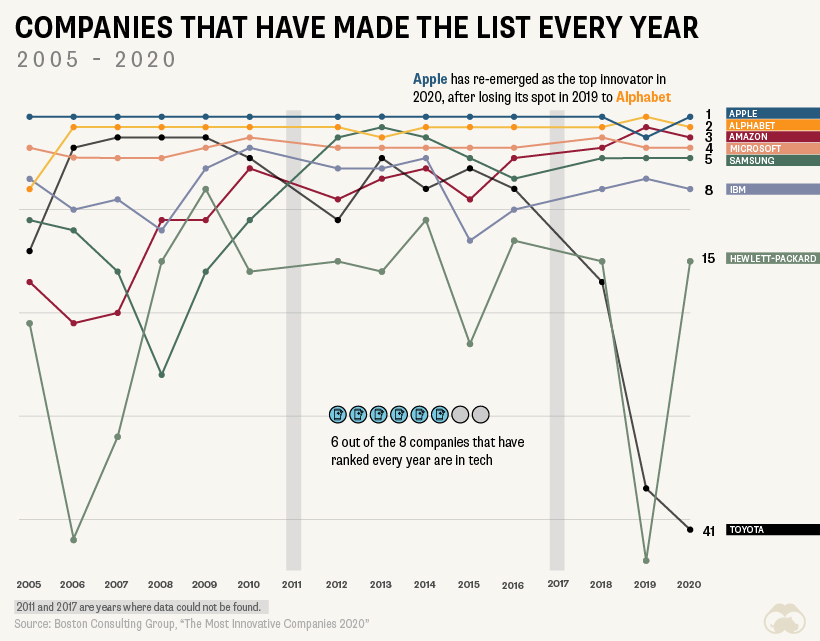
These companies are serial innovators, and have managed to create innovation systems to perpetually foster creativity and agility. It’s an intentional, laborious process—but when done right, the payoff can be huge.

-

 Debt1 week ago
How Debt-to-GDP Ratios Have Changed Since 2000
-

 Markets2 weeks ago
Ranked: The World’s Top Flight Routes, by Revenue
-

 Countries2 weeks ago
Population Projections: The World’s 6 Largest Countries in 2075
-

 Markets2 weeks ago
The Top 10 States by Real GDP Growth in 2023
-

 Demographics2 weeks ago
The Smallest Gender Wage Gaps in OECD Countries
-

 United States2 weeks ago
Where U.S. Inflation Hit the Hardest in March 2024
-

 Green2 weeks ago
Top Countries By Forest Growth Since 2001
-

 United States2 weeks ago
Ranked: The Largest U.S. Corporations by Number of Employees