Money
Mapped: The Wealthiest Person in Every U.S. State in 2020
Check out the latest 2023 update of the wealthiest person in every U.S. state.
The Wealthiest Person in Every U.S. State
Check out the latest 2023 update of the wealthiest person in every U.S. state.
There are different degrees of wealth that exist, even among the richest in America.
For example, a heavy-hitting millionaire might have the most impressive fortune in his or her home state — but venture a few miles across the state border, and suddenly they become a small fish in a much bigger pond.
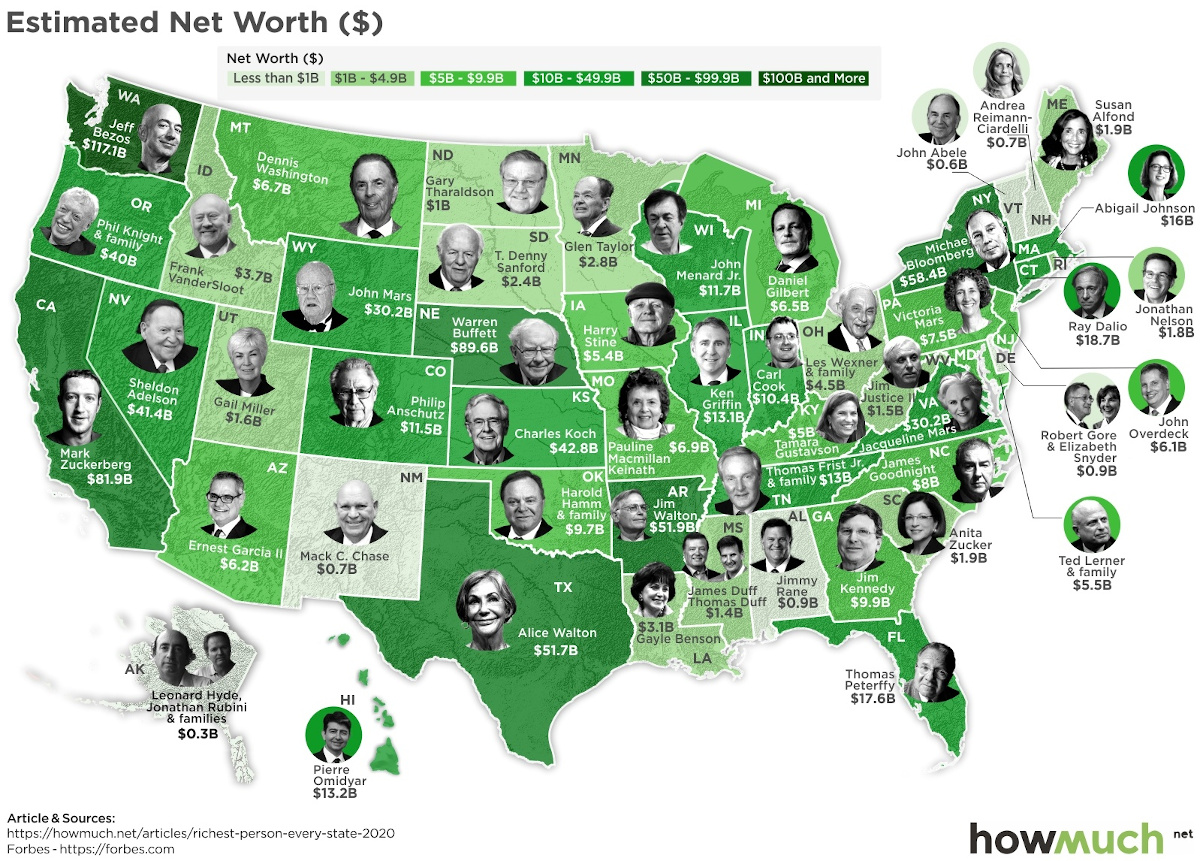
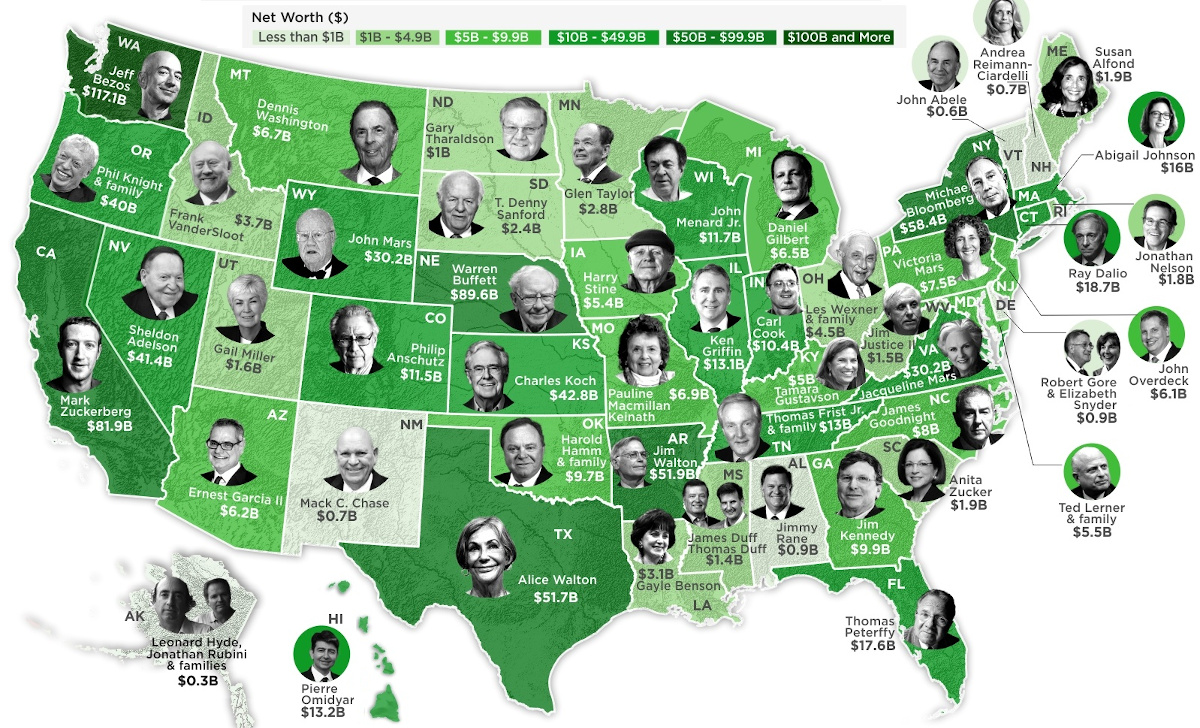
Today’s map comes to us from HowMuch.net, and it shows the incredible variance in the biggest fortunes on a state-by-state basis.
The Rich List, by State
Below is the full list containing the wealthiest person in every U.S. state, based on calculations by Forbes in early March 2020.
Amazon founder Jeff Bezos tops the list with a net worth of $117.1 billion in the state of Washington — meanwhile, the smallest fortune on the list is located in Alaska at just $0.3 billion.
| Rank | Person | State | Net Worth ($B) |
|---|---|---|---|
| #1 | Jeff Bezos | Washington | $117.1 |
| #2 | Warren Buffett | Nebraska | $89.6 |
| #3 | Mark Zuckerberg | California | $81.9 |
| #4 | Michael Bloomberg | New York | $58.4 |
| #5 | Jim Walton | Arkansas | $51.9 |
| #6 | Alice Walton | Texas | $51.7 |
| #7 | Charles Koch | Kansas | $42.8 |
| #8 | Sheldon Adelson | Nevada | $41.4 |
| #9 | Phil Knight and family | Oregon | $40.0 |
| #10 | Jacqueline Mars | Virginia | $30.2 |
| #11 | John Mars | Wyoming | $30.2 |
| #12 | Ray Dalio | Connecticut | $18.7 |
| #13 | Thomas Peterffy | Florida | $17.6 |
| #14 | Abigail Johnson | Massachusetts | $16.0 |
| #15 | Pierre Omidyar | Hawaii | $13.2 |
| #16 | Ken Griffin | Illinois | $13.1 |
| #17 | Thomas Frist Jr and family | Tennessee | $13.0 |
| #18 | John Menard Jr | Wisconsin | $11.7 |
| #19 | Philip Anschutz | Colorado | $11.5 |
| #20 | Carl Cook | Indiana | $10.4 |
| #21 | Jim Kennedy | Georgia | $9.9 |
| #22 | Harold Hamm & family | Oklahoma | $9.7 |
| #23 | James Goodnight | North Carolina | $8.0 |
| #24 | Victoria Mars | Pennsylvania | $7.5 |
| #25 | Pauline MacMillan Keinath | Missouri | $6.9 |
| #26 | Dennis Washington | Montana | $6.7 |
| #27 | Daniel Gilbert | Michigan | $6.5 |
| #28 | Ernest Garcia II | Arizona | $6.2 |
| #29 | John Overdeck | New Jersey | $6.1 |
| #30 | Ted Lerner and family | Maryland | $5.5 |
| #31 | Harry Stine | Iowa | $5.4 |
| #32 | Tamara Gustavson | Kentucky | $5.0 |
| #33 | Les Wexner and family | Ohio | $4.5 |
| #34 | Frank VanderSloot | Idaho | $3.7 |
| #35 | Gayle Benson | Louisiana | $3.1 |
| #36 | Glen Taylor | Minnesota | $2.8 |
| #37 | T. Denny Sanford | South Dakota | $2.4 |
| #38 | Susan Alfond | Maine | $1.9 |
| #39 | Anita Zucker | South Carolina | $1.9 |
| #40 | Jonathan Nelson | Rhode Island | $1.8 |
| #41 | Gail Miller | Utah | $1.6 |
| #42 | Jim Justice II | West Virginia | $1.5 |
| #43 | James and Thomas Duff | Mississippi | $1.4 |
| #44 | Gary Tharaldson | North Dakota | $1.0 |
| #45 | Jimmy Rane | Alabama | $0.9 |
| #46 | Elizabeth Snyder and Robert Gore | Delaware | $0.9 |
| #47 | Andrea Reimann-Ciardelli | New Hampshire | $0.7 |
| #48 | Mack C. Chase | New Mexico | $0.7 |
| #49 | John Abele | Vermont | $0.6 |
| #50 | Leonard Hyde, Jonathan Rubini and Families | Alaska | $0.3 |
While all of the names above are considered extraordinarily wealthy in their home states, there is still a magnitude of difference involved. The low end of the list ($0.3 billion) would need to multiply their fortune by 390 times to get up to the $117.1 billion Bezos level.
To put this another way, the same degree of difference exists between the median household wealth in the U.S. (~$100,000) and a multi-millionaire with $39 million to their name.
Rising and Falling Fortunes
The above figures were obtained prior to the COVID-19 market crash, which will surely impact the size of some of the fortunes listed here.
Who will be most and least impacted by the recent stock market turmoil?
Even though Jeff Bezos has most of his wealth tied up in Amazon stock, so far it has been relatively unaffected by the volatility. With more people staying home because of social distancing, orders on online platforms such as Amazon have exploded.
Similarly to Amazon, the heirs of the Walmart fortune in the Walton family — including Jim Walton, Alice Walton, and Rob Walton — are also seeing Walmart’s stock price hold relatively steady in the face of volatility. In fact, some analysts consider Walmart to be the ultimate “recession-proof” stock, as consumers flock to discount goods in poor economic times.
Warren Buffett is also an interesting case. Though the stock market has certainly disrupted the real-time value of his fortune, that’s not the game that Warren Buffett plays. In fact, he is known for waiting for times of crisis to deploy his cash, and has a significant stockpile of money ready for just this kind of situation.
Billionaires like Sheldon Adelson in Nevada or Philip Anschutz of Colorado might be singing a different tune than some of the other above magnates. Adelson, for example, owns a good chunk of the Las Vegas Strip, as well as casinos and hotels in Singapore and Macao. Unfortunately, tourism-related businesses are some of the hardest hit in the COVID-19 crash.
Meanwhile, Anschutz owns the Coachella Music Festival and stakes in many professional sports teams (LA Lakers, LA Kings, and multiple MLS teams), which have all been impacted by the cancellation of big events and gatherings throughout the country. Like many others, Anschutz is probably itching for things to get back to normal.


Money
Charted: Which City Has the Most Billionaires in 2024?
Just two countries account for half of the top 20 cities with the most billionaires. And the majority of the other half are found in Asia.


Charted: Which Country Has the Most Billionaires in 2024?
This was originally posted on our Voronoi app. Download the app for free on iOS or Android and discover incredible data-driven charts from a variety of trusted sources.
Some cities seem to attract the rich. Take New York City for example, which has 340,000 high-net-worth residents with investable assets of more than $1 million.
But there’s a vast difference between being a millionaire and a billionaire. So where do the richest of them all live?
Using data from the Hurun Global Rich List 2024, we rank the top 20 cities with the highest number of billionaires in 2024.
A caveat to these rich lists: sources often vary on figures and exact rankings. For example, in last year’s reports, Forbes had New York as the city with the most billionaires, while the Hurun Global Rich List placed Beijing at the top spot.
Ranked: Top 20 Cities with the Most Billionaires in 2024
The Chinese economy’s doldrums over the course of the past year have affected its ultra-wealthy residents in key cities.
Beijing, the city with the most billionaires in 2023, has not only ceded its spot to New York, but has dropped to #4, overtaken by London and Mumbai.
| Rank | City | Billionaires | Rank Change YoY |
|---|---|---|---|
| 1 | 🇺🇸 New York | 119 | +1 |
| 2 | 🇬🇧 London | 97 | +3 |
| 3 | 🇮🇳 Mumbai | 92 | +4 |
| 4 | 🇨🇳 Beijing | 91 | -3 |
| 5 | 🇨🇳 Shanghai | 87 | -2 |
| 6 | 🇨🇳 Shenzhen | 84 | -2 |
| 7 | 🇭🇰 Hong Kong | 65 | -1 |
| 8 | 🇷🇺 Moscow | 59 | No Change |
| 9 | 🇮🇳 New Delhi | 57 | +6 |
| 10 | 🇺🇸 San Francisco | 52 | No Change |
| 11 | 🇹🇭 Bangkok | 49 | +2 |
| 12 | 🇹🇼 Taipei | 45 | +2 |
| 13 | 🇫🇷 Paris | 44 | -2 |
| 14 | 🇨🇳 Hangzhou | 43 | -5 |
| 15 | 🇸🇬 Singapore | 42 | New to Top 20 |
| 16 | 🇨🇳 Guangzhou | 39 | -4 |
| 17T | 🇮🇩 Jakarta | 37 | +1 |
| 17T | 🇧🇷 Sao Paulo | 37 | No Change |
| 19T | 🇺🇸 Los Angeles | 31 | No Change |
| 19T | 🇰🇷 Seoul | 31 | -3 |
In fact all Chinese cities on the top 20 list have lost billionaires between 2023–24. Consequently, they’ve all lost ranking spots as well, with Hangzhou seeing the biggest slide (-5) in the top 20.
Where China lost, all other Asian cities—except Seoul—in the top 20 have gained ranks. Indian cities lead the way, with New Delhi (+6) and Mumbai (+3) having climbed the most.
At a country level, China and the U.S combine to make up half of the cities in the top 20. They are also home to about half of the world’s 3,200 billionaire population.
In other news of note: Hurun officially counts Taylor Swift as a billionaire, estimating her net worth at $1.2 billion.

-

 Debt1 week ago
How Debt-to-GDP Ratios Have Changed Since 2000
-

 Markets2 weeks ago
Ranked: The World’s Top Flight Routes, by Revenue
-

 Countries2 weeks ago
Population Projections: The World’s 6 Largest Countries in 2075
-

 Markets2 weeks ago
The Top 10 States by Real GDP Growth in 2023
-

 Demographics2 weeks ago
The Smallest Gender Wage Gaps in OECD Countries
-

 United States2 weeks ago
Where U.S. Inflation Hit the Hardest in March 2024
-

 Green2 weeks ago
Top Countries By Forest Growth Since 2001
-

 United States2 weeks ago
Ranked: The Largest U.S. Corporations by Number of Employees