Markets
The U.S. Stock Market in 2021: Best and Worst Performing Sectors


The Stock Market in 2021: Best and Worst Performing Sectors
It was another eventful year—and while it may not quite compare to the pandemonium experienced in 2020, it was still jam-packed with market moving events, such as:
- The highly-anticipated rollout of COVID-19 vaccines
- Supply chain disruptions and an ongoing semiconductor shortage
- Record-setting stimulus spending and debt accumulation by governments around the world
- The emergence of new variants of concern such as Delta and Omicron
- Big political upsets and the Capitol riots
- Rising evidence of (non-transitory) inflation
Let’s take a look at which sectors thrived during the twists and turns of 2021—and which couldn’t stomach the volatility.
Want extra insight into 2022?

Gain access to our 2022 Global Forecast series
Winners and Losers of 2021, by Sector
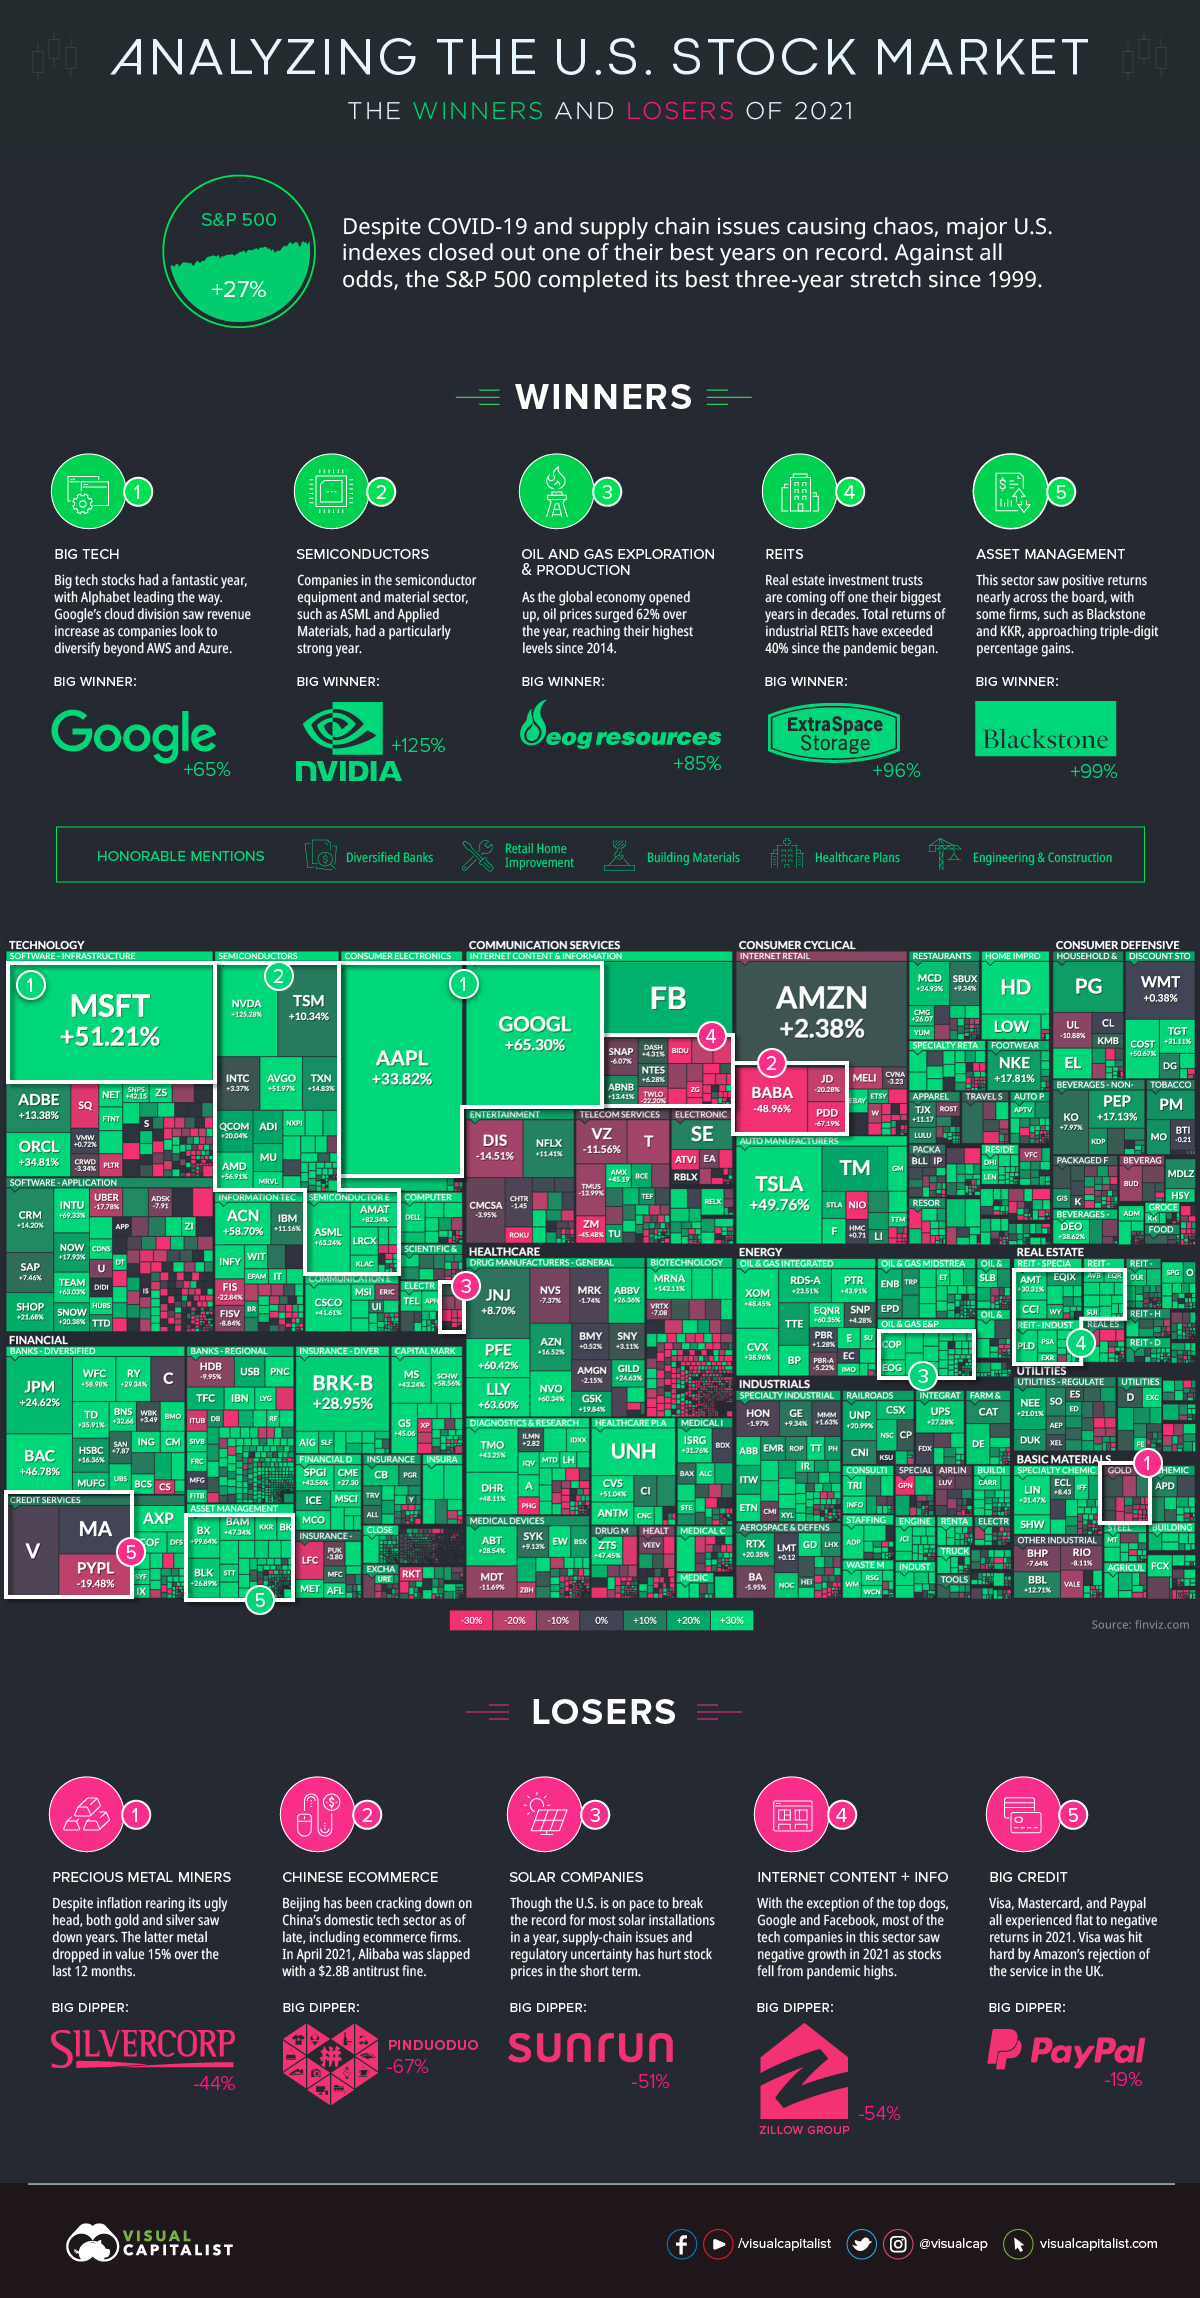
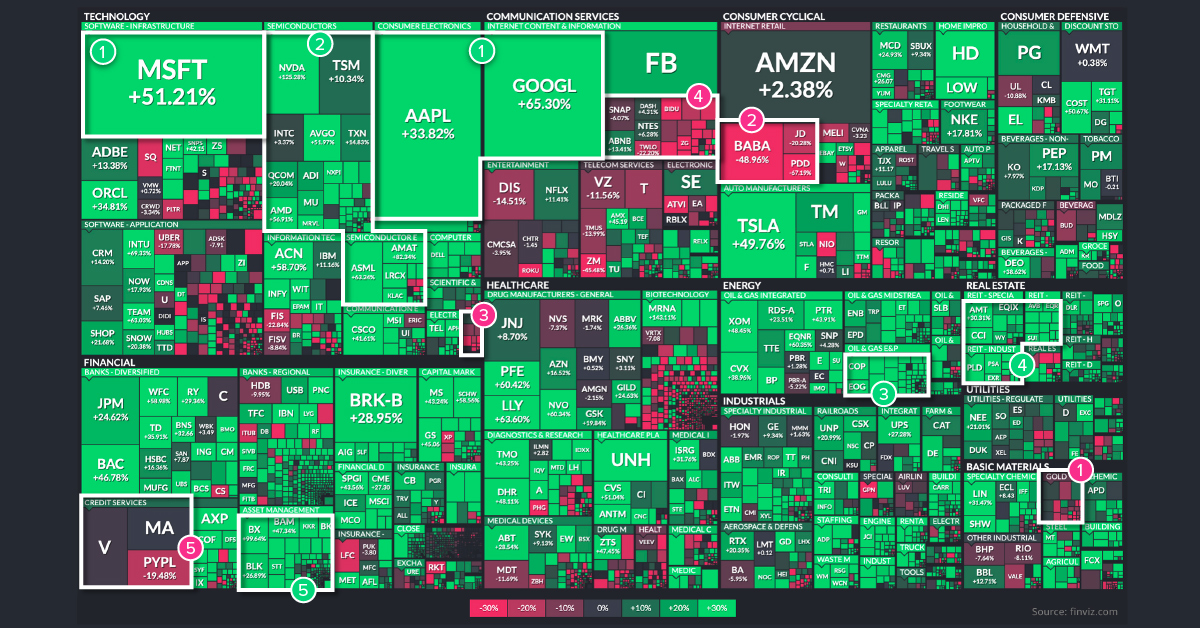
Our visualization today uses an augmented screenshot of the FinViz treemap, showing the final numbers posted for major U.S.-listed companies, sorted by sector and industry.
Here are the big beneficiaries of last year, along with those that got left behind.
The Winners
1. Big Tech
Over recent years, it’s been no surprise to see Big Tech near the top of any list. In 2021, Alphabet continued its tear, soaring 65% to hit a $2 trillion market cap.
Microsoft finished up the year 51%, Apple up 34%, and even Meta Platforms (née Facebook) posted double-digit gains. Only Amazon had single-digit gains, up 2.4% in 2021.
2. Semiconductors
Who benefitted most from the ongoing semiconductor shortage? Those that design or manufacture them, of course.
Nvidia, for example, more than doubled its share price over the course of the year, with 125% growth. Other companies in the semiconductor equipment and materials space, such as ASML and Applied Materials, saw gains above 60%.
3. Oil and Gas Exploration & Production
2020 was touch-and-go for oil prices, with futures even sliding negative at one point. However, the most recent year was much kinder to those in the energy industry.
The WTI price started the year below $50 per barrel, but finished the year at $75 per barrel—a swing that makes a big difference in the economics of each barrel.
4. Real Estate Investment Trusts (REITs)
It was one of the biggest years in decades for REITs, which saw the FTSE Nareit All Equity REITs index have its best performance since 1976.
Those that know REITs are aware that returns vary by property sector, and this remains the case here. Specifically, it was industrial REITs—and especially self-storage REITs—that outperformed. Extra Space Storage, a REIT that invests in self-storage units, finished up the year 96% and is the perfect example of this.
5. Asset Management
With record-low interest rates and continued upheaval from COVID-19, it sets a perfect stage for opportunistic private equity firms.
The asset management industry as a whole did well in 2021, but specifically it was PE firms like Blackstone and KKR that took advantage, posting gains of 99% and 84% respectfully.
Honorable Mentions:
Banks, Retail Home Improvement, Building Materials, Healthcare Plans, Engineering & Construction
The Losers
1. Precious Metal Miners
Inflation took off in 2021, and a usual beneficiary of this is the precious metals sector.
However, in the last 12 months, this has not been the case. Both gold and silver finished with negative returns on the year, which hurt precious metal miners.
2. Chinese Ecommerce
Beijing has been cracking down on China’s domestic tech sector as of late, and this has had a knock-on effect on companies like Pinduoduo, Alibaba, Baidu, and JD.com, which saw a collective collapse in their share prices.
All were down double digits, but Pinduoduo—the largest agriculture-focused technology platform in China—saw the highest amount of drag, falling over 67% on the year.
3. Solar Companies
Solar installations in the U.S. are chugging along at a record pace, as expected.
However, both regulatory uncertainty and supply chain problems have hampered stock prices in the short term. That’s why companies like Sunrun, a residential solar panel company, saw a 51% dip in stock performance in 2021.
4. Internet Content and Information
Big tech continued its surge, but other tech-enabled content and information companies saw tougher years. One example of this is Zillow, which shuttered the doors on its home flipping operation after realizing losses of $500 million.
Zillow stock was down 54% on the year, and has laid off a quarter of its staff.
5. Big Credit
It was a mediocre year for the big credit card companies like Visa and Mastercard, which were both flat in terms of stock market performance. Meanwhile, PayPal fell 19%.
According to billionaire investor Chamath Palihapitiya, 2022 may not be any better. Days ago, he predicted that both Visa and Mastercard will be the biggest business failures in the coming year.


Markets
The European Stock Market: Attractive Valuations Offer Opportunities
On average, the European stock market has valuations that are nearly 50% lower than U.S. valuations. But how can you access the market?


European Stock Market: Attractive Valuations Offer Opportunities
Europe is known for some established brands, from L’Oréal to Louis Vuitton. However, the European stock market offers additional opportunities that may be lesser known.
The above infographic, sponsored by STOXX, outlines why investors may want to consider European stocks.
Attractive Valuations
Compared to most North American and Asian markets, European stocks offer lower or comparable valuations.
| Index | Price-to-Earnings Ratio | Price-to-Book Ratio |
|---|---|---|
| EURO STOXX 50 | 14.9 | 2.2 |
| STOXX Europe 600 | 14.4 | 2 |
| U.S. | 25.9 | 4.7 |
| Canada | 16.1 | 1.8 |
| Japan | 15.4 | 1.6 |
| Asia Pacific ex. China | 17.1 | 1.8 |
Data as of February 29, 2024. See graphic for full index names. Ratios based on trailing 12 month financials. The price to earnings ratio excludes companies with negative earnings.
On average, European valuations are nearly 50% lower than U.S. valuations, potentially offering an affordable entry point for investors.
Research also shows that lower price ratios have historically led to higher long-term returns.
Market Movements Not Closely Connected
Over the last decade, the European stock market had low-to-moderate correlation with North American and Asian equities.
The below chart shows correlations from February 2014 to February 2024. A value closer to zero indicates low correlation, while a value of one would indicate that two regions are moving in perfect unison.
| EURO STOXX 50 | STOXX EUROPE 600 | U.S. | Canada | Japan | Asia Pacific ex. China |
|
|---|---|---|---|---|---|---|
| EURO STOXX 50 | 1.00 | 0.97 | 0.55 | 0.67 | 0.24 | 0.43 |
| STOXX EUROPE 600 | 1.00 | 0.56 | 0.71 | 0.28 | 0.48 | |
| U.S. | 1.00 | 0.73 | 0.12 | 0.25 | ||
| Canada | 1.00 | 0.22 | 0.40 | |||
| Japan | 1.00 | 0.88 | ||||
| Asia Pacific ex. China | 1.00 |
Data is based on daily USD returns.
European equities had relatively independent market movements from North American and Asian markets. One contributing factor could be the differing sector weights in each market. For instance, technology makes up a quarter of the U.S. market, but health care and industrials dominate the broader European market.
Ultimately, European equities can enhance portfolio diversification and have the potential to mitigate risk for investors.
Tracking the Market
For investors interested in European equities, STOXX offers a variety of flagship indices:
| Index | Description | Market Cap |
|---|---|---|
| STOXX Europe 600 | Pan-regional, broad market | €10.5T |
| STOXX Developed Europe | Pan-regional, broad-market | €9.9T |
| STOXX Europe 600 ESG-X | Pan-regional, broad market, sustainability focus | €9.7T |
| STOXX Europe 50 | Pan-regional, blue-chip | €5.1T |
| EURO STOXX 50 | Eurozone, blue-chip | €3.5T |
Data is as of February 29, 2024. Market cap is free float, which represents the shares that are readily available for public trading on stock exchanges.
The EURO STOXX 50 tracks the Eurozone’s biggest and most traded companies. It also underlies one of the world’s largest ranges of ETFs and mutual funds. As of November 2023, there were €27.3 billion in ETFs and €23.5B in mutual fund assets under management tracking the index.
“For the past 25 years, the EURO STOXX 50 has served as an accurate, reliable and tradable representation of the Eurozone equity market.”
— Axel Lomholt, General Manager at STOXX
Partnering with STOXX to Track the European Stock Market
Are you interested in European equities? STOXX can be a valuable partner:
- Comprehensive, liquid and investable ecosystem
- European heritage, global reach
- Highly sophisticated customization capabilities
- Open architecture approach to using data
- Close partnerships with clients
- Part of ISS STOXX and Deutsche Börse Group
With a full suite of indices, STOXX can help you benchmark against the European stock market.
Learn how STOXX’s European indices offer liquid and effective market access.

-

 Economy22 hours ago
Economic Growth Forecasts for G7 and BRICS Countries in 2024
The IMF has released its economic growth forecasts for 2024. How do the G7 and BRICS countries compare?
-

 Markets1 week ago
U.S. Debt Interest Payments Reach $1 Trillion
U.S. debt interest payments have surged past the $1 trillion dollar mark, amid high interest rates and an ever-expanding debt burden.
-

 United States1 week ago
Ranked: The Largest U.S. Corporations by Number of Employees
We visualized the top U.S. companies by employees, revealing the massive scale of retailers like Walmart, Target, and Home Depot.
-

 Markets2 weeks ago
The Top 10 States by Real GDP Growth in 2023
This graphic shows the states with the highest real GDP growth rate in 2023, largely propelled by the oil and gas boom.
-

 Markets2 weeks ago
Ranked: The World’s Top Flight Routes, by Revenue
In this graphic, we show the highest earning flight routes globally as air travel continued to rebound in 2023.
-

 Markets2 weeks ago
Ranked: The Most Valuable Housing Markets in America
The U.S. residential real estate market is worth a staggering $47.5 trillion. Here are the most valuable housing markets in the country.


-

 Mining1 week ago
Gold vs. S&P 500: Which Has Grown More Over Five Years?
-
Markets2 weeks ago
Ranked: The Most Valuable Housing Markets in America
-

 Money2 weeks ago
Which States Have the Highest Minimum Wage in America?
-

 AI2 weeks ago
Ranked: Semiconductor Companies by Industry Revenue Share
-
Markets2 weeks ago
Ranked: The World’s Top Flight Routes, by Revenue
-

 Demographics2 weeks ago
Population Projections: The World’s 6 Largest Countries in 2075
-
Markets2 weeks ago
The Top 10 States by Real GDP Growth in 2023
-

 Demographics2 weeks ago
The Smallest Gender Wage Gaps in OECD Countries