Markets
Chart: The Downward Spiral in Interest Rates
During the onset of an economic crisis, national governments are thought to have two chief policy tools at their disposal:
- Fiscal Policy
How the central government collects money through taxation, and how it spends that money - Monetary Policy
How central banks choose to manage the supply of money and interest rates
Major fiscal policy changes can take time to be implemented — but since central banks can make moves unilaterally, monetary policy is often the first line of defense in settling markets.
As the ripple effect of the COVID-19 pandemic rages on, central banks have been quick to act in slashing interest rates. However, with rates already sitting at historic lows before the crisis, it is possible that banks may be forced to employ more unconventional and controversial techniques to try and calm the economy as time goes on.
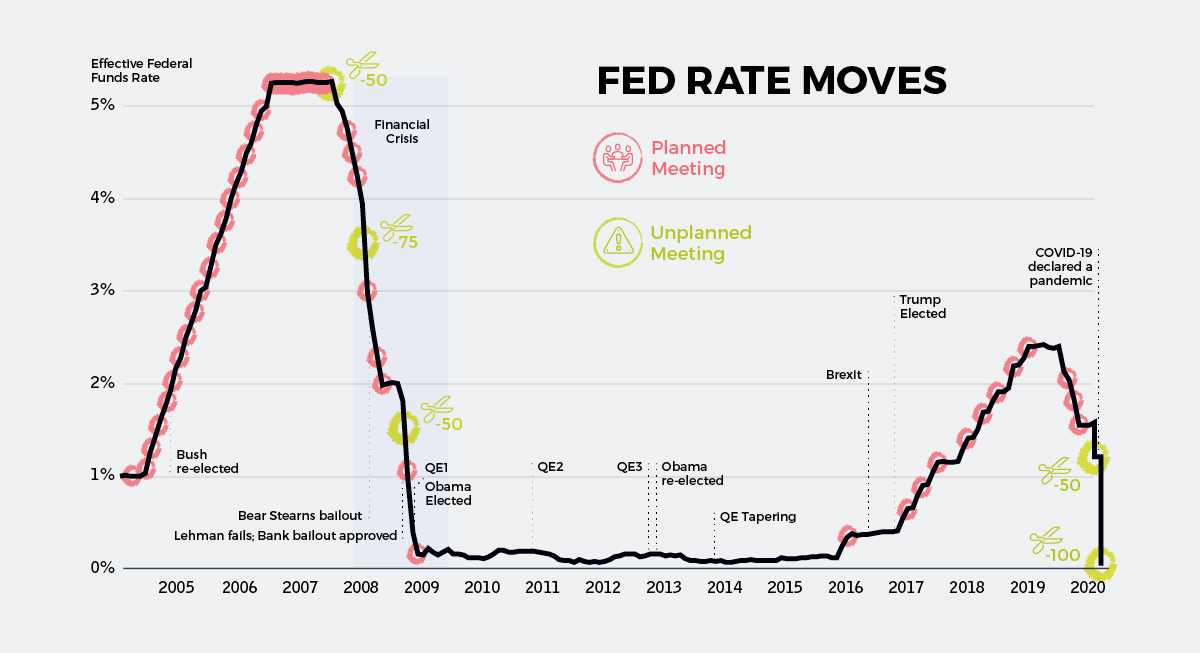
The Fed: Firing at Will
The most meaningful rate cuts happened on March 3rd and March 15th after emergency meetings in the United States.
First, the Federal Open Market Committee (FOMC) cut the target rate from 1.5% to 1.0% — and then on Sunday (March 15th) the rate got chopped by an entire percentage point to rub up against the lower bound of zero.

As you can see on the chart, this puts us back into familiar territory: a policy environment analogous to that seen during the recovery from the financial crisis.
ZIRP or NIRP?
It’s been awhile, but with interest rates again bumping up against the lower bound, you’ll begin to see discussions pop up again about the effectiveness of zero interest rate policy (ZIRP) and even negative interest rate policy (NIRP).
Although the latter has been used by some European banks in recent years, NIRP has never been experimented with in the United States or Canada.
Here’s a quick primer on both:
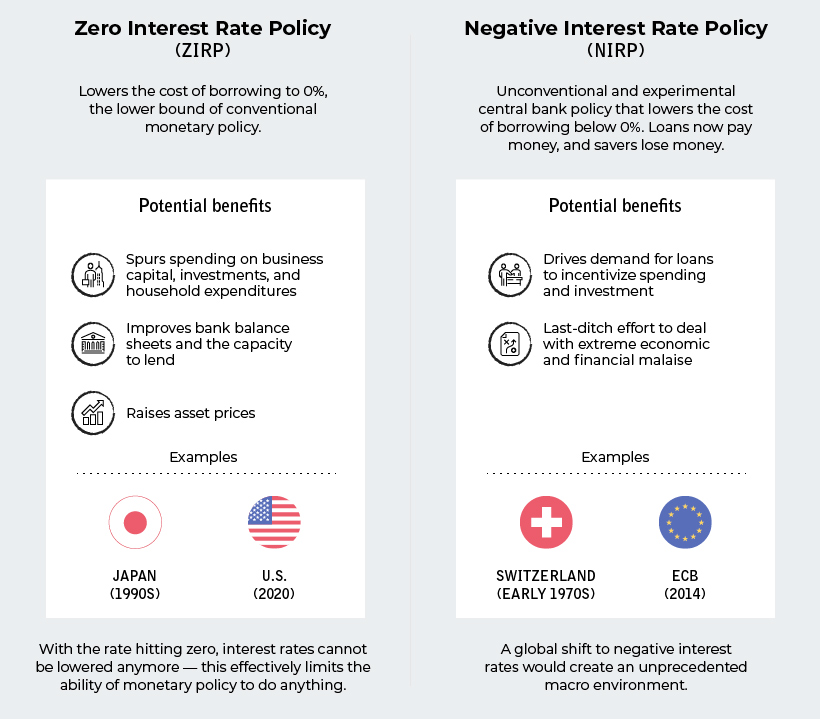
With rates sitting at zero, it’s not impossible for the Fed and other central banks to begin toying more seriously with the idea of negative rates. Such a move would be bold, but also seen as highly experimental and risky with unforeseen consequences.
Global Rate Slashing
Since only the beginning of March, the world’s central banks have cut interest rates on 37 separate occasions.
The only exception to this rule was the National Bank of Kazakhstan, which raised its key rate by 2.75% to support its currency in light of current oil prices. Even so, the Kazakhstani tenge has lost roughly 15% of its value against the U.S. dollar since February.
Here’s a look at cumulative interest rate cuts by some of the world’s most important central banks, from January 1, 2020 until today:
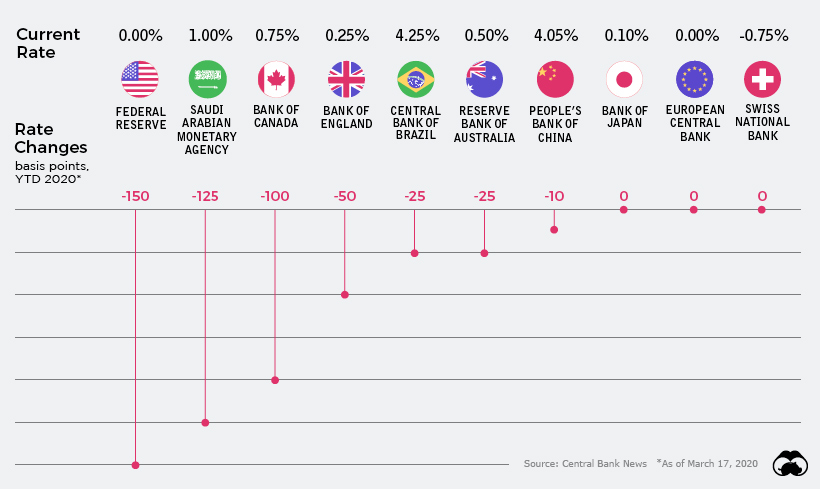
Going into the year, rates in developed economies were already between 0% and 2%.
Despite not having much room to work with, banks have slashed rates where they can — and now out of major developed economies, Canada has the “highest” interest rate at just 0.75%.
Helicopters on the Horizon
With central banks running out of ammo for the use of traditional measures, the conversation is quickly shifting to unconventional measures such as “helicopter money” and NIRP.
Life is already surreal as societal measures to defend against the spread of COVID-19 unfold; pretty soon, monetary measures taken around the globe may seem just as bizarre.
Put another way, unless something changes fast and miraculously, we could be moving into an unprecedented monetary environment where up is down, and down is up. At that point, it’s anybody’s guess as to how things will shake out going forward.


Markets
The European Stock Market: Attractive Valuations Offer Opportunities
On average, the European stock market has valuations that are nearly 50% lower than U.S. valuations. But how can you access the market?


European Stock Market: Attractive Valuations Offer Opportunities
Europe is known for some established brands, from L’Oréal to Louis Vuitton. However, the European stock market offers additional opportunities that may be lesser known.
The above infographic, sponsored by STOXX, outlines why investors may want to consider European stocks.
Attractive Valuations
Compared to most North American and Asian markets, European stocks offer lower or comparable valuations.
| Index | Price-to-Earnings Ratio | Price-to-Book Ratio |
|---|---|---|
| EURO STOXX 50 | 14.9 | 2.2 |
| STOXX Europe 600 | 14.4 | 2 |
| U.S. | 25.9 | 4.7 |
| Canada | 16.1 | 1.8 |
| Japan | 15.4 | 1.6 |
| Asia Pacific ex. China | 17.1 | 1.8 |
Data as of February 29, 2024. See graphic for full index names. Ratios based on trailing 12 month financials. The price to earnings ratio excludes companies with negative earnings.
On average, European valuations are nearly 50% lower than U.S. valuations, potentially offering an affordable entry point for investors.
Research also shows that lower price ratios have historically led to higher long-term returns.
Market Movements Not Closely Connected
Over the last decade, the European stock market had low-to-moderate correlation with North American and Asian equities.
The below chart shows correlations from February 2014 to February 2024. A value closer to zero indicates low correlation, while a value of one would indicate that two regions are moving in perfect unison.
| EURO STOXX 50 | STOXX EUROPE 600 | U.S. | Canada | Japan | Asia Pacific ex. China |
|
|---|---|---|---|---|---|---|
| EURO STOXX 50 | 1.00 | 0.97 | 0.55 | 0.67 | 0.24 | 0.43 |
| STOXX EUROPE 600 | 1.00 | 0.56 | 0.71 | 0.28 | 0.48 | |
| U.S. | 1.00 | 0.73 | 0.12 | 0.25 | ||
| Canada | 1.00 | 0.22 | 0.40 | |||
| Japan | 1.00 | 0.88 | ||||
| Asia Pacific ex. China | 1.00 |
Data is based on daily USD returns.
European equities had relatively independent market movements from North American and Asian markets. One contributing factor could be the differing sector weights in each market. For instance, technology makes up a quarter of the U.S. market, but health care and industrials dominate the broader European market.
Ultimately, European equities can enhance portfolio diversification and have the potential to mitigate risk for investors.
Tracking the Market
For investors interested in European equities, STOXX offers a variety of flagship indices:
| Index | Description | Market Cap |
|---|---|---|
| STOXX Europe 600 | Pan-regional, broad market | €10.5T |
| STOXX Developed Europe | Pan-regional, broad-market | €9.9T |
| STOXX Europe 600 ESG-X | Pan-regional, broad market, sustainability focus | €9.7T |
| STOXX Europe 50 | Pan-regional, blue-chip | €5.1T |
| EURO STOXX 50 | Eurozone, blue-chip | €3.5T |
Data is as of February 29, 2024. Market cap is free float, which represents the shares that are readily available for public trading on stock exchanges.
The EURO STOXX 50 tracks the Eurozone’s biggest and most traded companies. It also underlies one of the world’s largest ranges of ETFs and mutual funds. As of November 2023, there were €27.3 billion in ETFs and €23.5B in mutual fund assets under management tracking the index.
“For the past 25 years, the EURO STOXX 50 has served as an accurate, reliable and tradable representation of the Eurozone equity market.”
— Axel Lomholt, General Manager at STOXX
Partnering with STOXX to Track the European Stock Market
Are you interested in European equities? STOXX can be a valuable partner:
- Comprehensive, liquid and investable ecosystem
- European heritage, global reach
- Highly sophisticated customization capabilities
- Open architecture approach to using data
- Close partnerships with clients
- Part of ISS STOXX and Deutsche Börse Group
With a full suite of indices, STOXX can help you benchmark against the European stock market.
Learn how STOXX’s European indices offer liquid and effective market access.

-

 Economy2 days ago
Economic Growth Forecasts for G7 and BRICS Countries in 2024
The IMF has released its economic growth forecasts for 2024. How do the G7 and BRICS countries compare?
-

 Markets2 weeks ago
U.S. Debt Interest Payments Reach $1 Trillion
U.S. debt interest payments have surged past the $1 trillion dollar mark, amid high interest rates and an ever-expanding debt burden.
-

 United States2 weeks ago
Ranked: The Largest U.S. Corporations by Number of Employees
We visualized the top U.S. companies by employees, revealing the massive scale of retailers like Walmart, Target, and Home Depot.
-

 Markets2 weeks ago
The Top 10 States by Real GDP Growth in 2023
This graphic shows the states with the highest real GDP growth rate in 2023, largely propelled by the oil and gas boom.
-

 Markets2 weeks ago
Ranked: The World’s Top Flight Routes, by Revenue
In this graphic, we show the highest earning flight routes globally as air travel continued to rebound in 2023.
-

 Markets3 weeks ago
Ranked: The Most Valuable Housing Markets in America
The U.S. residential real estate market is worth a staggering $47.5 trillion. Here are the most valuable housing markets in the country.


-

 Debt1 week ago
How Debt-to-GDP Ratios Have Changed Since 2000
-
Markets2 weeks ago
Ranked: The World’s Top Flight Routes, by Revenue
-

 Countries2 weeks ago
Population Projections: The World’s 6 Largest Countries in 2075
-
Markets2 weeks ago
The Top 10 States by Real GDP Growth in 2023
-

 Demographics2 weeks ago
The Smallest Gender Wage Gaps in OECD Countries
-

 United States2 weeks ago
Where U.S. Inflation Hit the Hardest in March 2024
-

 Green2 weeks ago
Top Countries By Forest Growth Since 2001
-
United States2 weeks ago
Ranked: The Largest U.S. Corporations by Number of Employees