Technology
The Evolution of Media: Visualizing a Data-Driven Future
In today’s highly-connected and instantaneous world, we have access to a massive amount of information at our fingertips.
Historically, however, this hasn’t always been the case.
Time travel back just 20 years ago to 2002, and you’d notice the vast majority of people were still waiting on the daily paper or the evening news to help fill the information void.
In fact, for most of 2002, Google was trailing in search engine market share behind Yahoo! and MSN. Meanwhile, early social media incarnations (MySpace, Friendster, etc.) were just starting to come online, and all of Facebook, YouTube, Twitter, and the iPhone did not yet exist.
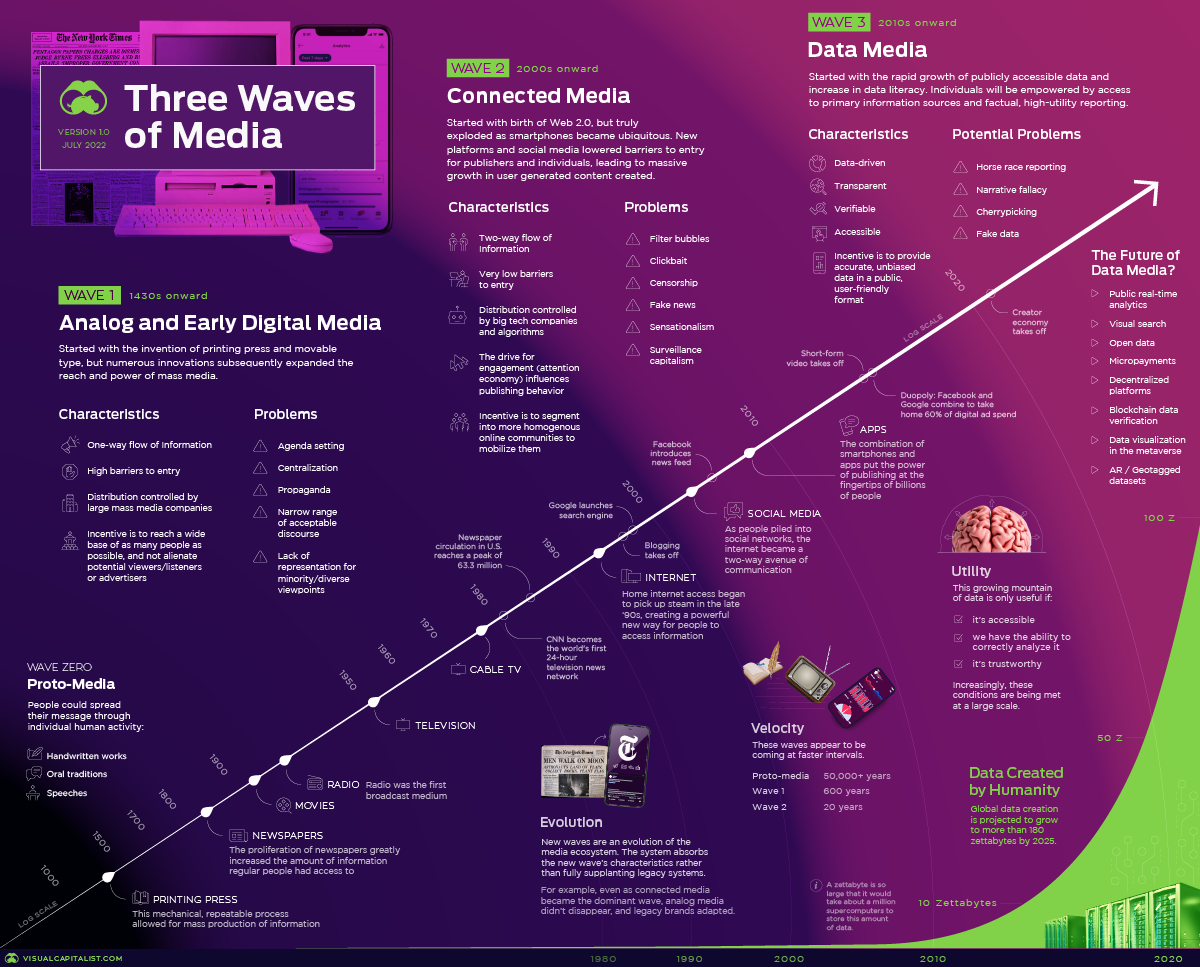
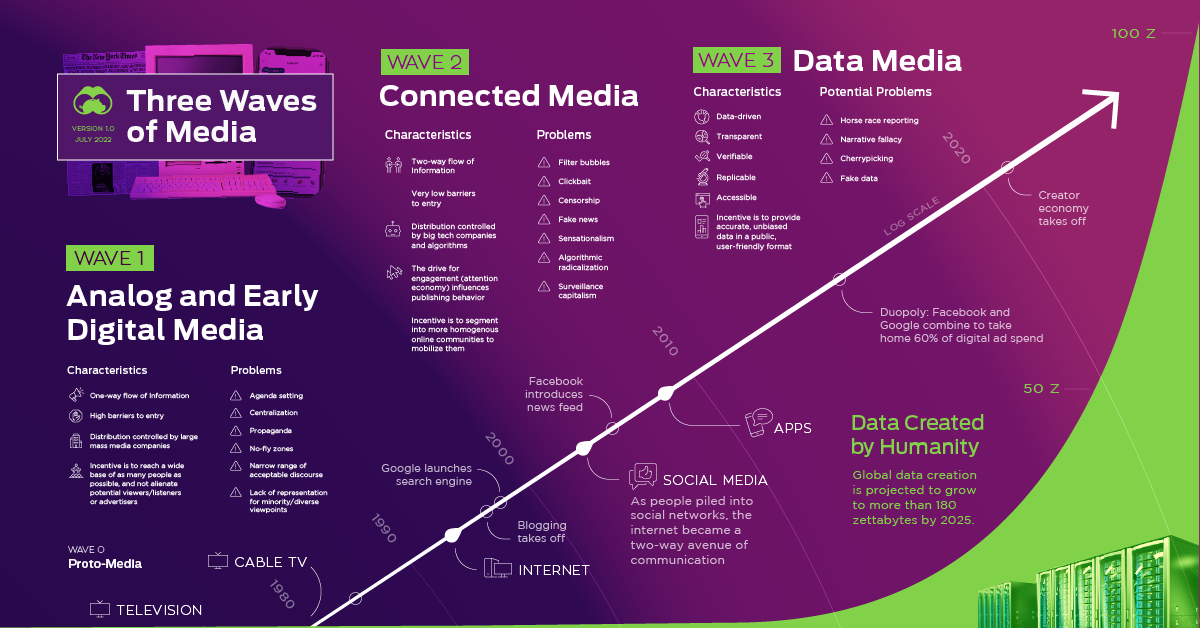
The Waves of Media So Far
Every so often, the dominant form of communication is upended by new technological developments and changing societal preferences.
These transitions seem to be happening faster over time, aligning with the accelerated progress of technology.
- Proto-Media (50,000+ years)
Humans could only spread their message through human activity. Speech, oral tradition, and manually written text were most common mediums to pass on a message. - Analog and Early Digital Media (1430-2004)
The invention of the printing press, and later the radio, television, and computer unlock powerful forms of one-way and cheap communication to the masses. - Connected Media (2004-current)
The birth of Web 2.0 and social media enables participation and content creation for everyone. One tweet, blog post, or TikTok video by anyone can go viral, reaching the whole world.
Each new wave of media comes with its own pros and cons.
For example, Connected Media was a huge step forward in that it enabled everyone to be a part of the conversation. On the other hand, algorithms and the sheer amount of content to sift through has created a lot of downsides as well. To name just a few problems with media today: filter bubbles, sensationalism, clickbait, and so on.
Before we dive into what we think is the next wave of media, let’s first break down the common attributes and problems with prior waves.
Wave Zero: Proto-Media
Before the first wave of media, amplifying a message took devotion and a lifetime.
Add in the fact that even by the year 1500, only 4% of global citizens lived in cities, and you can see how hard it would be to communicate effectively with the masses during this era.
Or, to paint a more vivid picture of what proto-media was like: information could only travel as fast as the speed of a horse.
Wave 1: Analog and Early Digital Media
In this first wave, new technological advancements enabled widescale communication for the first time in history.
Newspapers, books, magazines, radios, televisions, movies, and early websites all fit within this framework, enabling the owners of these assets to broadcast their message at scale.
With large amounts of infrastructure required to print books or broadcast television news programs, it took capital or connections to gain access. For this reason, large corporations and governments were usually the gatekeepers, and ordinary citizens had limited influence.
Attribute | Description |
---|---|
📡 Information Flow | One-way |
💰 Barriers to Entry | Very high |
📰 Distribution | Controlled by mass media companies and government |
🏆 Incentive | To cast a wide net, and to not alienate viewers or advertisers |
Importantly, these mediums only allowed one-way communication—meaning that they could broadcast a message, but the general public was restricted in how they could respond (i.e. a letter to the editor, or a phone call to a radio station).
Wave 2: Connected Media
Innovations like Web 2.0 and social media changed the game.
Starting in the mid-2000s, barriers to entry began to drop, and it eventually became free and easy for anyone to broadcast their opinion online. As the internet exploded with content, sorting through it became the number one problem to solve.
For better or worse, algorithms began to feed people what they loved, so they could consume even more. The ripple effect of this was that everyone competing for eyeballs suddenly found themselves optimizing content to try and “win” the algorithm game to get virality.
Attribute | Description |
---|---|
📡 Information Flow | Two-way |
💰 Barriers to Entry | Very low |
📰 Distribution | Controlled by technology companies and algorithms |
🏆 Incentive | To cast a narrow net, to engage and mobilize a specific audience |
Viral content is often engaging and interesting, but it comes with tradeoffs. Content can be made artificially engaging by sensationalizing, using clickbait, or playing loose with the facts. It can be ultra-targeted to resonate emotionally within one particular filter bubble. It can be designed to enrage a certain group, and mobilize them towards action—even if it is extreme.
Despite the many benefits of Connected Media, we are seeing more polarization than ever before in society. Groups of people can’t relate to each other or discuss issues, because they can’t even agree on basic facts.
Perhaps most frustrating of all? Many people don’t know they are deep within their own bubble in which they are only fed information they agree with. They are unaware that other legitimate points of view exist. Everything is black and white, and grey thinking is rarer and rarer.
Wave 3: Data Media
Between 2015 and 2025, the amount of data captured, created, and replicated globally will increase by 1,600%.
For the first time ever, a significant quantity of data is becoming “open source” and available to anyone. There have been massive advancements in how to store and verify data, and even the ownership of information can now be tracked on the blockchain. Both media and the population are becoming more data literate, and they are also becoming aware of the societal drawbacks stemming from Connected Media.
As this new wave emerges, it’s worth examining some of its attributes and connecting concepts in more detail:
- Transparency:
Data literate users will begin to demand that data is transparent and originating from trustworthy, factual sources. Or if a source is not rock solid, users will demand that limitations of methodology or possible biases are openly revealed and discussed. - Verifiability and Trust:
How do we know data shown is legitimate and bonafide? Platforms and media will increasingly want to prove to users that data has been verified, going all the way back to the original source. - Decentralization and Web3:
Anyone can tap into large amounts of public data available today, which means that reporting, analysis, ideas, and insights can come from an increasingly growing set of actors. Web3 and decentralized ledgers will allow us to provide trust, attribution, accountability, and even ownership of content when necessary. This can remove the middleman, which is often large tech companies, and can allow users to monetize their content more directly. - Data Storytelling
Growing data literacy, and the explosion of data storytelling is a key approach to making sense of vast amounts of data, by combining data visualization, narrative, and powerful insights. - Data Creator Economy:
Democratized data and the rise of storytelling are intersecting to create a potential new ecosystem for data storytellers. This is increasingly what we are focused on at Visual Capitalist, and we encourage you to support our Kickstarter project on this (just 6 days left, as of publishing time) - Open-Ended Ecosystem:
Just like open source has revolutionized the software industry, we will begin to see more and more data available broadly. Incentives may shift in some cases from keeping data proprietary, to getting it out in the open so that others can use, remix, and publish it, and attributing it back to the original source. - Data > Opinion:
Data Media will have a bias towards facts over opinion. It’s less about punditry, bias, spin, and telling others what they should think, and more about allowing an increasingly data literate population to have access to the facts themselves, and to develop their own nuanced opinion on them. - Global Data Standards:
As data continues to proliferate, it will be important to codify and unify it when possible. This will lead to global standards that will make communicating it even easier.
Early Pioneers of Data Media
The Data Media ecosystem is just beginning to emerge, but here are some early pioneers we like:
- Our World in Data:
Led by economist Max Roser, OWiD is doing an excellent job amalgamating global economic data in one place, and making it easy for others to remix and communicate those insights effectively. - USAFacts:
Founded by Steve Ballmer of Microsoft fame to be a non-partisan source of U.S. government data. - FRED:
This tool by the Federal Reserve Bank of St. Louis is just one example of many tools that have cropped up over the years to democratize data that were previously proprietary or hard to access. Other similar tools have been created by the IMF, World Bank, and so on. - FiveThirtyEight:
FiveThirtyEight uses statistical analysis, data journalism, and predictions to cover politics, sports, and other topics in a unique way. - FlowingData:
At FlowingData, data viz expert Nathan Yau explores a wide variety of data and visualization themes. - Data Journalists:
There are incredible data journalists at publications like The Economist, The Washington Post, The New York Times, and Reuters that are tapping into the early beginnings of what is possible. Many of these publications also made their COVID-19 work freely available during the pandemic, which is certainly commendable.
Growth in data journalism and the emergence of these pioneers helps give you a sense of the beginnings of Data Media, but we believe they are only scratching the surface of what is possible.
What Data Media is Not
In a sense, it’s easier to define what Data Media isn’t.
Data Media is not partisan pundits arguing over each other on a newscast, and it’s not fake news, misinformation, or clickbait that is engineered to drive easy clicks. Data media is not an echo chamber that only reinforces existing biases. Because data is also less subjective, it’s less likely to be censored in the way we see today.
Data is not perfect, but it can help change the conversations we are having as a society to be more constructive and inclusive. We hope you agree!
Technology
The Cost of Mining Bitcoin in 198 Different Countries
Mining bitcoin is costly. But the exact price fluctuates, depending on the location and the cost of electricity in the area.

Cost of Mining Bitcoin in 198 Different Countries
View a higher resolution version of this map.
It takes an estimated 1,449 kilowatt hours (kWh) of energy to mine a single bitcoin. That’s the same amount of energy an average U.S. household consumes in approximately 13 years.
Given the high amount of energy needed to mine bitcoin, it can be a costly venture to get into. But exact prices fluctuate, depending on the location and the cost of electricity in the area.
Where are the cheapest and most expensive places to mine this popular cryptocurrency? This graphic by 911 Metallurgist provides a snapshot of the estimated cost of mining bitcoin around the world, using pricing and relative costs from March 23, 2022.
How Does Bitcoin Mining Work?
Before diving in, it’s worth briefly explaining the basics of bitcoin mining, and why it requires so much energy.
When someone mines for bitcoin, what they’re really doing is adding and verifying a new transaction record to the blockchain—the decentralized bank ledger where bitcoin is traded and distributed.
To create this new record, crypto miners need to crack a complex equation that’s been generated by the blockchain system.
Potentially tens of thousands of miners are racing to crack the same code at any given time. Only the first person to solve the equation gets rewarded (unless you’re part of a mining pool, which is essentially a group of miners who agree to combine efforts to increase their chances of solving the equation).
The faster your computing power is, the better your chances are of winning, so solving the equation first requires powerful equipment that takes up a lot of energy.
The Costs and Profits of Mining Bitcoin in 198 Countries
Across the 198 countries included in the dataset, the average cost to mine bitcoin sat at $35,404.03, more than bitcoin’s value of $20,863.69 on July 15, 2022. Though it’s important to note that fluctuating energy prices, and more or less miners on the bitcoin network, constantly change the necessary energy and final cost.
Here’s a breakdown of what the cost to mine one bitcoin in each country was in March 23, 2022, along with the potential profit after accounting for mining costs:
# | Country | Cost to mine 1 bitcoin | Profit (July 15, 2022) |
---|---|---|---|
1 | 🇰🇼 Kuwait | $1,393.95 | $18,362.58 |
2 | 🇩🇿 Algeria | $4,181.86 | $15,574.67 |
3 | 🇸🇩 Sudan | $4,779.27 | $14,977.26 |
4 | 🇾🇪 Yemen | $7,161.77 | $12,594.76 |
5 | 🇪🇹 Ethiopia | $7,168.91 | $12,587.62 |
6 | 🇰🇬 Kyrgyzstan | $7,168.91 | $12,587.62 |
7 | 🇦🇴 Angola | $7,368.04 | $12,388.49 |
8 | 🇶🇦 Qatar | $7,368.04 | $12,388.49 |
9 | 🇰🇵 North Korea | $7,744.32 | $12,012.21 |
10 | 🇰🇿 Kazakhstan | $8,762.00 | $10,994.53 |
11 | 🇿🇲 Zambia | $9,160.27 | $10,596.26 |
12 | 🇦🇿 Azerbaijan | $9,558.54 | $10,197.99 |
13 | 🇧🇳 Brunei | $9,956.81 | $9,799.72 |
14 | 🇮🇷 Iran | $10,355.09 | $9,401.44 |
15 | 🇺🇿 Uzbekistan | $10,355.09 | $9,401.44 |
16 | 🇽🇰 Kosovo | $10,560.17 | $9,196.36 |
17 | 🇸🇬 Singapore | $10,952.50 | $8,804.03 |
18 | 🇲🇳 Mongolia | $11,151.63 | $8,604.90 |
19 | 🇧🇹 Bhutan | $11,749.04 | $8,007.49 |
20 | 🇧🇭 Bahrain | $11,948.18 | $7,808.35 |
21 | 🇴🇲 Oman | $11,948.18 | $7,808.35 |
22 | 🇹🇯 Tajikistan | $12,545.59 | $7,210.94 |
23 | 🇺🇦 Ukraine | $12,744.72 | $7,011.81 |
24 | 🇬🇪 Georgia | $13,143.00 | $6,613.53 |
25 | 🇦🇬 Paraguay | $13,143.00 | $6,613.53 |
26 | 🇹🇹 Trinidad and Tobago | $13,143.00 | $6,613.53 |
27 | 🇸🇷 Suriname | $14,337.81 | $5,418.72 |
28 | 🇸🇦 Saudi Arabia | $14,736.09 | $5,020.44 |
29 | 🇦🇲 Armenia | $15,333.50 | $4,423.03 |
30 | 🇹🇳 Tunisia | $15,333.50 | $4,423.03 |
31 | 🇸🇾 Syria | $15,532.63 | $4,223.90 |
32 | 🇨🇬 Congo (Republic Of The) | $16,130.04 | $3,626.49 |
33 | 🇲🇲 Myanmar | $16,130.04 | $3,626.49 |
34 | 🇷🇺 Russia | $16,130.04 | $3,626.49 |
35 | 🇮🇶 Iraq | $16,926.59 | $2,829.94 |
36 | 🇲🇩 Moldova | $16,926.59 | $2,829.94 |
37 | 🇹🇷 Turkey | $17,723.13 | $2,033.40 |
38 | 🇷🇴 Romania | $18,320.54 | $1,435.99 |
39 | 🇦🇱 Albania | $18,718.81 | $1,037.72 |
40 | 🇧🇩 Bangladesh | $18,718.81 | $1,037.72 |
41 | 🇱🇮 Liechtenstein | $18,917.95 | $838.58 |
42 | 🇱🇹 Lithuania | $18,917.95 | $838.58 |
43 | 🇲🇿 Mozambique | $19,117.08 | $639.45 |
44 | 🇪🇬 Egypt | $19,316.22 | $440.31 |
45 | 🇨🇩 Congo (Democratic Republic Of The) | $19,913.63 | -$157.10 |
46 | 🇳🇴 Norway | $20,112.77 | -$356.24 |
47 | 🇦🇹 Austria | $20,311.90 | -$555.37 |
48 | 🇨🇱 Chile | $20,311.90 | -$555.37 |
49 | 🇪🇪 Estonia | $20,511.04 | -$754.51 |
50 | 🇸🇪 Sweden | $20,710.18 | -$953.65 |
51 | 🇨🇫 Central African Republic | $20,909.31 | -$1,152.78 |
52 | 🇺🇸 United States | $21,088.53 | -$1,332.00 |
53 | 🇧🇬 Bulgaria | $21,307.58 | -$1,551.05 |
54 | 🇮🇩 Indonesia | $21,307.58 | -$1,551.05 |
55 | 🇷🇸 Serbia | $21,307.58 | -$1,551.05 |
56 | 🇦🇷 Argentina | $21,506.72 | -$1,750.19 |
57 | 🇦🇪 United Arab Emirates | $21,705.86 | -$1,949.33 |
58 | 🇳🇬 Nigeria | $22,303.27 | -$2,546.74 |
59 | 🇲🇬 Madagascar | $22,502.40 | -$2,745.87 |
60 | 🇱🇻 Latvia | $22,701.54 | -$2,945.01 |
61 | 🇰🇷 South Korea | $22,701.54 | -$2,945.01 |
62 | 🇧🇦 Bosnia and Herzegovina | $23,099.81 | -$3,343.28 |
63 | 🇹🇼 Taiwan | $23,298.95 | -$3,542.42 |
64 | 🇮🇱 Israel | $23,498.08 | -$3,741.55 |
65 | 🇪🇨 Ecuador | $23,697.22 | -$3,940.69 |
66 | 🇲🇾 Malaysia | $23,896.36 | -$4,139.83 |
67 | 🇳🇵 Nepal | $23,896.36 | -$4,139.83 |
68 | 🇳🇿 New Zealand | $23,896.36 | -$4,139.83 |
69 | 🇱🇺 Luxembourg | $24,095.49 | -$4,338.96 |
70 | 🇮🇸 Iceland | $24,294.63 | -$4,538.10 |
71 | 🇨🇦 Canada | $24,493.76 | -$4,737.23 |
72 | 🇲🇦 Morocco | $24,692.90 | -$4,936.37 |
73 | 🇿🇼 Zimbabwe | $24,692.90 | -$4,936.37 |
74 | 🇻🇳 Vietnam | $24,892.04 | -$5,135.51 |
75 | 🇨🇮 Côte D’Ivoire (Ivory Coast) | $25,091.17 | -$5,334.64 |
76 | 🇱🇾 Libya | $25,091.17 | -$5,334.64 |
77 | 🇹🇿 Tanzania | $25,091.17 | -$5,334.64 |
78 | 🇦🇩 Andorra | $25,276.27 | -$5,519.74 |
79 | 🇨🇳 China | $25,489.45 | -$5,732.92 |
80 | 🇱🇧 Lebanon | $25,887.72 | -$6,131.19 |
81 | 🇱🇦 Laos | $26,285.99 | -$6,529.46 |
82 | 🇫🇮 Finland | $26,485.13 | -$6,728.60 |
83 | 🇫🇷 France | $27,082.54 | -$7,326.01 |
84 | 🇨🇭 Switzerland | $27,082.54 | -$7,326.01 |
85 | 🇵🇱 Poland | $27,281.67 | -$7,525.14 |
86 | 🇷🇼 Rwanda | $27,281.67 | -$7,525.14 |
87 | 🇹🇭 Thailand | $27,281.67 | -$7,525.14 |
88 | 🇨🇿 Czech Republic | $27,480.81 | -$7,724.28 |
89 | 🇱🇸 Lesotho | $27,679.95 | -$7,923.42 |
90 | 🇲🇪 Montenegro | $28,078.22 | -$8,321.69 |
91 | 🇲🇱 Mali | $28,277.35 | -$8,520.82 |
92 | 🇨🇷 Costa Rica | $28,675.63 | -$8,919.10 |
93 | 🇳🇱 Netherlands | $28,675.63 | -$8,919.10 |
94 | 🇧🇾 Belarus | $29,273.04 | -$9,516.51 |
95 | 🇳🇦 Namibia | $30,069.58 | -$10,313.05 |
96 | 🇲🇰 Macedonia, North | $30,866.13 | -$11,109.60 |
97 | 🇸🇲 San Marino | $30,866.13 | -$11,109.60 |
98 | 🇸🇰 Slovakia | $31,065.26 | -$11,308.73 |
99 | 🇿🇦 South Africa | $32,060.94 | -$12,304.41 |
100 | 🇧🇼 Botswana | $32,459.22 | -$12,702.69 |
101 | 🇸🇿 Swaziland | $32,857.49 | -$13,100.96 |
102 | 🇧🇪 Belgium | $33,255.76 | -$13,499.23 |
103 | 🇺🇾 Uruguay | $33,255.76 | -$13,499.23 |
104 | 🇧🇷 Brazil | $33,454.90 | -$13,698.37 |
105 | 🇭🇷 Croatia | $33,454.90 | -$13,698.37 |
106 | 🇮🇹 Italy | $33,454.90 | -$13,698.37 |
107 | 🇺🇬 Uganda | $33,654.03 | -$13,897.50 |
108 | 🇨🇲 Cameroon | $33,853.17 | -$14,096.64 |
109 | 🇲🇽 Mexico | $33,853.17 | -$14,096.64 |
110 | 🇲🇼 Malawi | $34,251.44 | -$14,494.91 |
111 | 🇧🇮 Burundi | $34,450.58 | -$14,694.05 |
112 | 🇱🇰 Sri Lanka | $34,450.58 | -$14,694.05 |
113 | 🇬🇶 Equatorial Guinea | $34,649.72 | -$14,893.19 |
114 | 🇧🇴 Bolivia | $34,848.85 | -$15,092.32 |
115 | 🇲🇷 Mauritania | $35,047.99 | -$15,291.46 |
116 | 🇵🇸 Palestine | $35,047.99 | -$15,291.46 |
117 | 🇹🇬 Togo | $35,047.99 | -$15,291.46 |
118 | 🇦🇫 Afghanistan | $35,844.53 | -$16,088.00 |
119 | 🇭🇺 Hungary | $35,844.53 | -$16,088.00 |
120 | 🇸🇱 Sierra Leone | $35,844.53 | -$16,088.00 |
121 | 🇲🇨 Monaco | $35,922.73 | -$16,166.20 |
122 | 🇵🇭 Philippines | $36,043.67 | -$16,287.14 |
123 | 🇰🇭 Cambodia | $36,242.81 | -$16,486.28 |
124 | 🇸🇳 Senegal | $36,242.81 | -$16,486.28 |
125 | 🇸🇹 São Tomé and Príncipe | $36,441.94 | -$16,685.41 |
126 | 🇮🇪 Ireland (Republic Of) | $37,835.90 | -$18,079.37 |
127 | 🇲🇹 Malta | $37,835.90 | -$18,079.37 |
128 | 🇨🇾 Cyprus | $38,035.03 | -$18,278.50 |
129 | 🇬🇦 Gabon | $38,035.03 | -$18,278.50 |
130 | 🇸🇻 El Salvador | $38,831.58 | -$19,075.05 |
131 | 🇵🇪 Peru | $38,831.58 | -$19,075.05 |
132 | 🇨🇴 Colombia | $39,628.12 | -$19,871.59 |
133 | 🇩🇴 Dominican Republic | $40,026.40 | -$20,269.87 |
134 | 🇬🇹 Guatemala | $40,026.40 | -$20,269.87 |
135 | 🇬🇲 The Gambia | $40,225.53 | -$20,469.00 |
136 | 🇬🇳 Guinea | $40,424.67 | -$20,668.14 |
137 | 🇮🇳 India | $40,424.67 | -$20,668.14 |
138 | 🇦🇺 Australia | $40,623.81 | -$20,867.28 |
139 | 🇬🇷 Greece | $40,623.81 | -$20,867.28 |
140 | 🇲🇺 Mauritius | $40,822.94 | -$21,066.41 |
141 | 🇧🇯 Benin | $41,221.21 | -$21,464.68 |
142 | 🇭🇳 Honduras | $41,420.35 | -$21,663.82 |
143 | 🇭🇹 Haiti | $42,017.76 | -$22,261.23 |
144 | 🇹🇩 Chad | $42,216.90 | -$22,460.37 |
145 | 🇳🇪 Niger | $42,416.03 | -$22,659.50 |
146 | 🇰🇪 Kenya | $43,212.58 | -$23,456.05 |
147 | 🇫🇯 Fiji | $43,411.71 | -$23,655.18 |
148 | 🇪🇷 Eritrea | $43,610.85 | -$23,854.32 |
149 | 🇸🇸 South Sudan | $43,809.99 | -$24,053.46 |
150 | 🇵🇰 Pakistan | $44,208.26 | -$24,451.73 |
151 | 🇵🇹 Portugal | $44,208.26 | -$24,451.73 |
152 | 🇧🇿 Belize | $45,004.80 | -$25,248.27 |
153 | 🇳🇷 Nauru | $45,378.54 | -$25,622.01 |
154 | 🇹🇱 Timor-Leste | $46,597.89 | -$26,841.36 |
155 | 🇬🇭 Ghana | $46,996.17 | -$27,239.64 |
156 | 🇯🇵 Japan | $47,195.30 | -$27,438.77 |
157 | 🇧🇫 Burkina Faso | $47,394.44 | -$27,637.91 |
158 | 🇩🇰 Denmark | $48,190.98 | -$28,434.45 |
159 | 🇯🇴 Jordan | $48,987.53 | -$29,231.00 |
160 | 🏴 England | $49,301.82 | -$29,545.29 |
161 | 🏴 Scotland | $50,090.64 | -$30,334.11 |
162 | 🇵🇦 Panama | $50,580.62 | -$30,824.09 |
163 | 🇩🇪 Germany | $50,978.89 | -$31,222.36 |
164 | 🇬🇧 Ireland (Northern) | $51,536.83 | -$31,780.30 |
165 | 🇪🇸 Spain | $51,775.44 | -$32,018.91 |
166 | 🇩🇯 Djibouti | $52,173.71 | -$32,417.18 |
167 | 🏴 Wales | $52,194.19 | -$32,437.66 |
168 | 🇨🇻 Cape Verde | $52,372.85 | -$32,616.32 |
169 | 🇯🇲 Jamaica | $52,571.98 | -$32,815.45 |
170 | 🇧🇧 Barbados | $52,970.26 | -$33,213.73 |
171 | 🇸🇮 Slovenia | $52,970.26 | -$33,213.73 |
172 | 🇹🇻 Tuvalu | $53,887.02 | -$34,130.49 |
173 | 🇬🇼 Guinea-Bissau | $54,364.21 | -$34,607.68 |
174 | 🇰🇲 Comoros | $55,957.30 | -$36,200.77 |
175 | 🇧🇸 Bahamas | $56,753.85 | -$36,997.32 |
176 | 🇵🇬 Papua New Guinea | $57,550.39 | -$37,793.86 |
177 | 🇰🇳 Saint Kitts and Nevis | $60,935.71 | -$41,179.18 |
178 | 🇬🇩 Grenada | $61,533.12 | -$41,776.59 |
179 | 🇵🇼 Palau | $63,922.75 | -$44,166.22 |
180 | 🇱🇨 Saint Lucia | $63,922.75 | -$44,166.22 |
181 | 🇸🇨 Seychelles | $63,922.75 | -$44,166.22 |
182 | 🇬🇾 Guyana | $65,316.71 | -$45,560.18 |
183 | 🇳🇮 Nicaragua | $66,511.52 | -$46,754.99 |
184 | 🇻🇨 Saint Vincent and Grenadines | $68,901.16 | -$49,144.63 |
185 | 🇹🇴 Tonga | $72,087.34 | -$52,330.81 |
186 | 🇩🇲 Dominica | $73,282.16 | -$53,525.63 |
187 | 🇻🇺 Vanuatu | $76,070.07 | -$56,313.54 |
188 | 🇼🇸 Samoa | $76,667.48 | -$56,910.95 |
189 | 🇨🇺 Cuba | $76,946.27 | -$57,189.74 |
190 | 🇱🇷 Liberia | $77,663.16 | -$57,906.63 |
191 | 🇲🇻 Maldives | $78,459.70 | -$58,703.17 |
192 | 🇲🇭 Marshall Islands | $80,849.34 | -$61,092.81 |
193 | 🇸🇴 Somalia | $82,044.16 | -$62,287.63 |
194 | 🇰🇮 Kiribati | $82,243.29 | -$62,486.76 |
195 | 🇫🇲 Micronesia, Federated States Of | $82,442.43 | -$62,685.90 |
196 | 🇦🇬 Antigua and Barbuda | $89,412.20 | -$69,655.67 |
197 | 🇸🇧 Solomon Islands | $142,581.59 | -$122,825.06 |
198 | 🇻🇪 Venezuela | $246,530.74 | -$226,774.21 |
Venezuela ranks as the number one most expensive country to mine bitcoin. It costs a whooping $246,530.74 to mine a single bitcoin in the South American country, meaning the process is far from profitable. Energy costs are so expensive in the country that miners would be out $225,667.05 for just one bitcoin.
On the opposite end of the spectrum, the cheapest place to mine bitcoin is in Kuwait. It costs $1,393.95 to mine a single bitcoin in Kuwait, meaning miners could gain $19,469.74 in profits.
The Middle Eastern country has some of the cheapest electricity in the world, with one kWh costing an average of just 3 cents. For context, the average cost of one kWh in North America is 21 cents.
The Race is On
Despite the steep costs of bitcoin mining, many people believe it’s worth the upfront investment.
One thing that makes bitcoin particularly appealing is its finite supply—there are only 21 million coins available for mining, and as of this article’s publication, more than 19 million bitcoin have already been mined.
While the price of bitcoin (BTC) is notorious for its volatility, its value has still grown significantly over the last decade. And if cryptocurrencies become mainstream as many people believe they will, this could boost the price of bitcoin even further.
Technology
Animation: The Rise and Fall of Popular Web Browsers Since 1994
This animation shows the evolution of web browser market share since 1994, showing the rise and fall of various internet portals.

Animation: The Rise and Fall of Popular Web Browsers Since 1994
In its early stages, the internet was a highly technical interface that most people had difficulty navigating. But that all changed when the Mosaic web browser entered the scene in 1993.
Mosaic was one of the first “user-friendly” internet portals—although by today’s standards, the browser was actually quite difficult to access. Comparatively, modern browsers in high use today have changed exponentially.
This animated graphic by James Eagle chronicles the evolution of the web browser market, showing the rise and fall of various internet portals from January 1994 to March 2022.
The 1990s: From Mosaic to Netscape
In the early 90s, Mosaic was by far the most dominant web browser. At the time, about 97% of all internet searches were done through this popular web portal.
Web browser | % Share (January 1994) |
---|---|
Mosaic | 97.0% |
Other | 3.0% |
Mosaic was the first web browser to display images directly on a page in line with text. Earlier browsers loaded pictures as separate files, which meant users have to click, download, and open a new file in order to view them.
The pioneering portal was created by a team of university undergrads at the University of Illinois, led by 21-year-old Marc Andreessen. When Andreessen graduated, he went on to be the co-founder of Mosaic Communications Corporation, which evolved into Netscape Communications Corporation, the company that created Netscape Navigator.
Netscape was essentially a new and improved version of Mosaic, but since the University of Illinois owned the rights to Mosaic, Andreessen’s new company couldn’t actually use any of the original code.
Netscape became a nearly instant success, and as a result, Mosaic’s market share began to fall. By the late 90s, Netscape had captured 89% of the web browser market.
Web browser | % Share (April 1996) |
---|---|
Netscape | 88.9% |
Mosaic | 7.2% |
Internet Explorer | 3.9% |
Netscape dominated the market for a few more years. However, in the new millennium, a new tech giant started to take over—Internet Explorer.
The 2000s: Internet Explorer Enters the Chat, Followed by Firefox
In 1995, Microsoft launched Internet Explorer as part of an add-on package for its operating system, Microsoft Windows 95.
Given the popularity of the Windows franchise at the time, Internet Explorer was quickly adopted. By the early 2000s, it had captured over 90% of the market, reflecting Microsoft’s hold on the personal computing market.
Web browser | % Share (January 2000) |
---|---|
Internet Explorer | 76.6% |
Netscape | 18.4% |
Opera | 0.7% |
Other | 4.3% |
Netscape was mostly phased out of the market by then, which meant Internet Explorer didn’t have much competition until Mozilla entered the arena.
Founded by members of Netscape, Mozilla began in 1998 as a project for fostering innovation in the web browser market. They shared Netscape’s source code with the public, and over time built a community of programmers around the world that helped make the product even better.
By 2004, Mozilla launched Firefox, and by 2006, the free, open-source browser had captured nearly 30% of the market. Firefox and Internet Explorer battled it out for a few more years, but by the mid-2010s, both browsers started to get leapfrogged by Google Chrome.
Present Day: Google Chrome is King of the Web Browsers
When Google’s co-founders Larry Page and Sergey Brin pitched the idea of starting a Google web browser to CEO Larry Schmidt in 2003, he was worried that they couldn’t keep up with the fierce competition. Eventually, the co-founders convinced Schmidt, and in 2008, Google Chrome was released to the public.
One of Chrome’s distinguishing features was (and still is) the fact that each tab operated separately. This meant that if one tab froze, it wouldn’t stall or crash the others, at the cost of higher memory and CPU usage.
By 2013, Chrome had swallowed up half the market. And with Android emerging as the most popular mobile OS on the global market, there were even more Chrome installations (and of course, searches on Google) as a result.
Notes on Data and Methodology
It’s important to note that the dataset in this animation uses visitor log files from web development site and resource W3Schools from 1999 onwards. Despite getting more than 60 million monthly visits, its userbase is likely slanted towards PC over mobile users.
Further, though Google’s Android platform has a sizable lead over Apple’s iOS in the global mobile sector, this likely slant also impacts the representation of iOS and therefore Safari browsers in the animation and dataset.
-
Markets4 weeks ago
The $100 Trillion Global Economy in One Chart
-
Demographics3 weeks ago
Ranked: The 20 Countries With the Fastest Declining Populations
-
Investor Education4 weeks ago
Countries with the Highest Default Risk in 2022
-
Energy2 weeks ago
Visualizing the World’s Largest Oil Producers
-
Misc4 days ago
Visualizing Which Countries Drink the Most Beer
-
Personal Finance1 week ago
Mapped: The Salary You Need to Buy a Home in 50 U.S. Cities
-
Agriculture2 weeks ago
Timeline: The Domestication of Animals
-
Energy4 days ago
Which Countries Produce the Most Natural Gas?