Technology
33 Problems With Media in One Chart
33 Problems With Media in One Chart
One of the hallmarks of democratic society is a healthy, free-flowing media ecosystem.
In times past, that media ecosystem would include various mass media outlets, from newspapers to cable TV networks. Today, the internet and social media platforms have greatly expanded the scope and reach of communication within society.
Of course, journalism plays a key role within that ecosystem. High quality journalism and the unprecedented transparency of social media keeps power structures in check—and sometimes, these forces can drive genuine societal change. Reporters bring us news from the front lines of conflict, and uncover hard truths through investigative journalism.
That said, these positive impacts are sometimes overshadowed by harmful practices and negative externalities occurring in the media ecosystem.
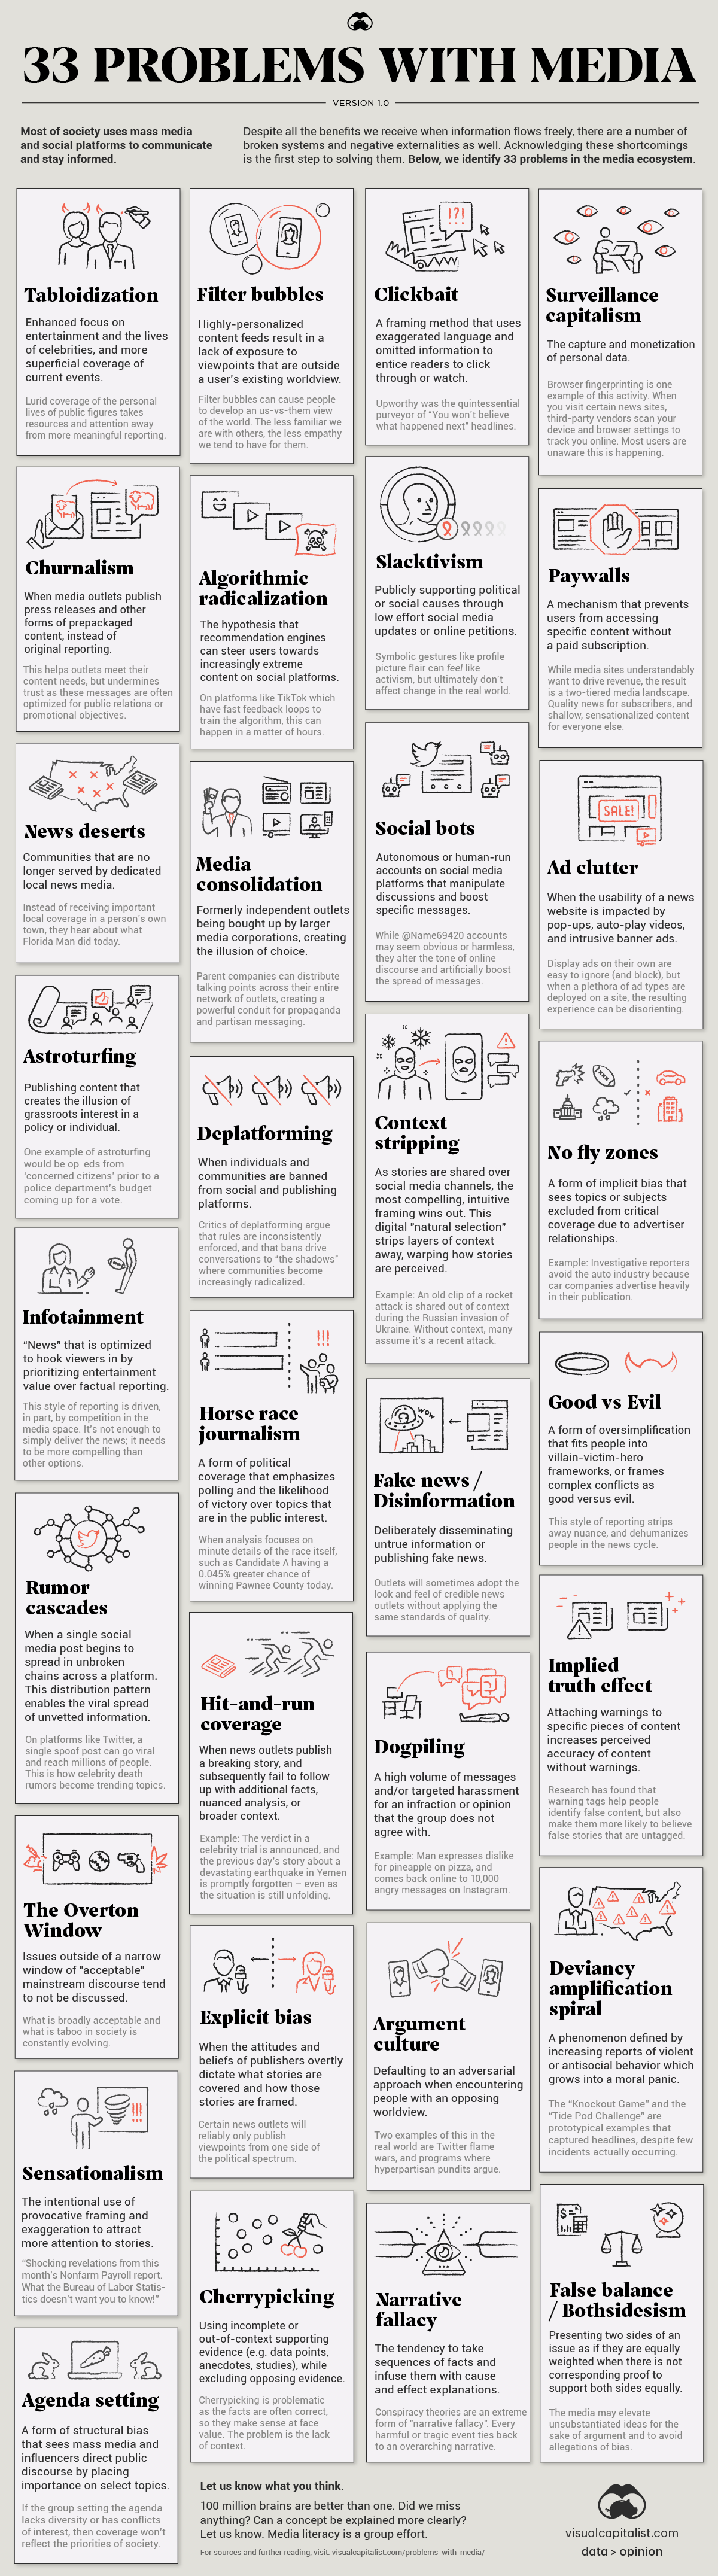
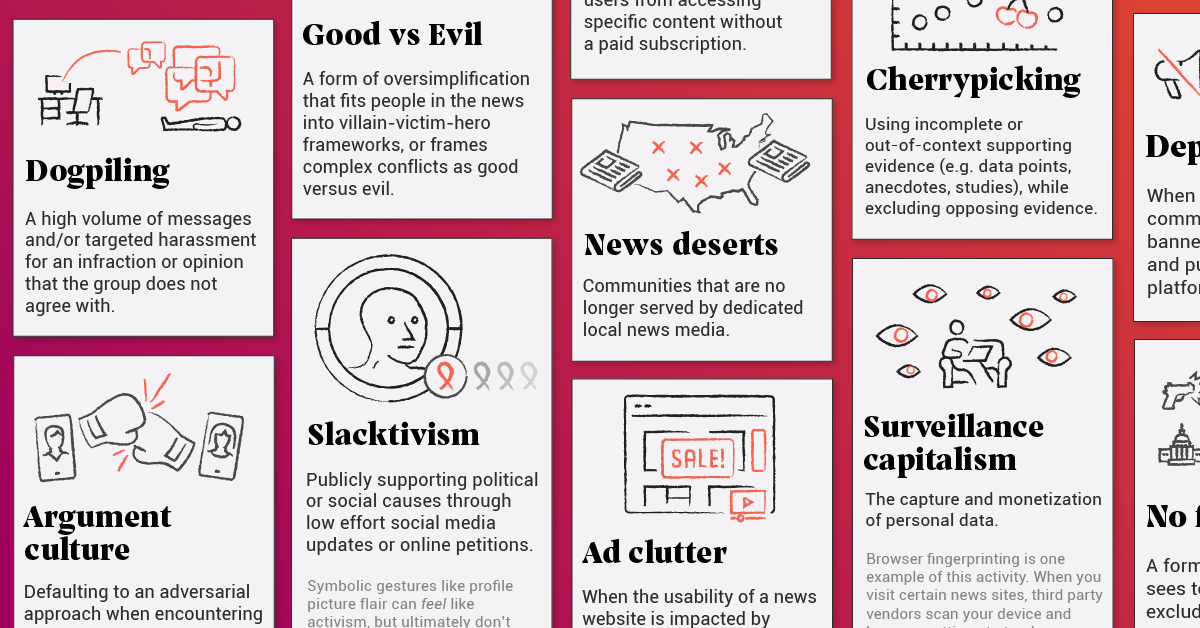
The graphic above is an attempt to catalog problems within the media ecosystem as a basis for discussion. Many of the problems are easy to understand once they’re identified. However, in some cases, there is an interplay between these issues that is worth digging into. Below are a few of those instances.
Editor’s note: For a full list of sources, please go to the end of this article. If we missed a problem, let us know!
Explicit Bias vs. Implicit Bias
Broadly speaking, bias in media breaks down into two types: explicit and implicit.
Publishers with explicit biases will overtly dictate the types of stories that are covered in their publications and control the framing of those stories. They usually have a political or ideological leaning, and these outlets will use narrative fallacies or false balance in an effort to push their own agenda.
Unintentional filtering or skewing of information is referred to as implicit bias, and this can manifest in a few different ways. For example, a publication may turn a blind eye to a topic or issue because it would paint an advertiser in a bad light. These are called no fly zones, and given the financial struggles of the news industry, these no fly zones are becoming increasingly treacherous territory.
Misinformation vs. Disinformation
Both of these terms imply that information being shared is not factually sound. The key difference is that misinformation is unintentional, and disinformation is deliberately created to deceive people.
Fake news stories, and concepts like deepfakes, fall into the latter category. We broke down the entire spectrum of fake news and how to spot it, in a previous infographic.
Simplify, Simplify
Mass media and social feeds are the ultimate Darwinistic scenario for ideas.
Through social media, stories are shared widely by many participants, and the most compelling framing usually wins out. More often than not, it’s the pithy, provocative posts that spread the furthest. This process strips context away from an idea, potentially warping its meaning.
Video clips shared on social platforms are a prime example of context stripping in action. An (often shocking) event occurs, and it generates a massive amount of discussion despite the complete lack of context.
This unintentionally encourages viewers to stereotype the persons in the video and bring our own preconceived ideas to the table to help fill in the gaps.
Members of the media are also looking for punchy story angles to capture attention and prove the point they’re making in an article. This can lead to cherrypicking facts and ideas. Cherrypicking is especially problematic because the facts are often correct, so they make sense at face value, however, they lack important context.
Simplified models of the world make for compelling narratives, like good-vs-evil, but situations are often far more complex than what meets the eye.
The News Media Squeeze
It’s no secret that journalism is facing lean times. Newsrooms are operating with much smaller teams and budgets, and one result is ‘churnalism’. This term refers to the practice of publishing articles directly from wire services and public relations releases.
Churnalism not only replaces more rigorous forms of reporting—but also acts as an avenue for advertising and propaganda that is harder to distinguish from the news.
The increased sense of urgency to drive revenue is causing other problems as well. High-quality content is increasingly being hidden behind paywalls.
The end result is a two-tiered system, with subscribers receiving thoughtful, high-quality news, and everyone else accessing shallow or sensationalized content. That everyone else isn’t just people with lower incomes, it also largely includes younger people. The average age of today’s paid news subscriber is 50 years old, raising questions about the future of the subscription business model.
For outlets that rely on advertising, desperate times have called for desperate measures. User experience has taken a backseat to ad impressions, with ad clutter (e.g. auto-play videos, pop-ups, and prompts) interrupting content at every turn. Meanwhile, in the background, third-party trackers are still watching your every digital move, despite all the privacy opt-in prompts.
How Can We Fix the Problems with Media?
With great influence comes great responsibility. There is no easy fix to the issues that plague news and social media. But the first step is identifying these issues, and talking about them.
The more media literate we collectively become, the better equipped we will be to reform these broken systems, and push for accuracy and transparency in the communication channels that bind society together.
Sources and further reading:
Veils of Distortion: How the News Media Warps our Minds by John Zada
Hate Inc. by Matt Taibbi
Manufacturing Consent by Edward S. Herman and Noam Chomsky
The Truth Matters: A Citizen’s Guide to Separating Facts from Lies and Stopping Fake News in its Tracks by Bruce Bartlett
Active Measures: The Secret History of Disinformation and Political Warfare by Thomas Rid
The Twittering Machine by Richard Seymour
After the Fact by Nathan Bomey
Ten Arguments for Deleting Your Social Media Accounts Right Now by Jaron Lanier
Zucked by Roger McNamee
Antisocial: Online Extremists, Techno-Utopians, and the Highjacking of the American Conversation by Andrew Marantz
Social media is broken by Sara Brown
The U.S. Media’s Problems Are Much Bigger than Fake News and Filter Bubbles by Bharat N. Anand
What’s Wrong With the News? by FAIR
Is the Media Doomed? by Politico
The Implied Truth Effect by Gordon Pennycook, Adam Bear, Evan T. Collins, David G. Rand


Technology
All of the Grants Given by the U.S. CHIPS Act
Intel, TSMC, and more have received billions in subsidies from the U.S. CHIPS Act in 2024.


All of the Grants Given by the U.S. CHIPS Act
This was originally posted on our Voronoi app. Download the app for free on iOS or Android and discover incredible data-driven charts from a variety of trusted sources.
This visualization shows which companies are receiving grants from the U.S. CHIPS Act, as of April 25, 2024. The CHIPS Act is a federal statute signed into law by President Joe Biden that authorizes $280 billion in new funding to boost domestic research and manufacturing of semiconductors.
The grant amounts visualized in this graphic are intended to accelerate the production of semiconductor fabrication plants (fabs) across the United States.
Data and Company Highlights
The figures we used to create this graphic were collected from a variety of public news sources. The Semiconductor Industry Association (SIA) also maintains a tracker for CHIPS Act recipients, though at the time of writing it does not have the latest details for Micron.
| Company | Federal Grant Amount | Anticipated Investment From Company |
|---|---|---|
| 🇺🇸 Intel | $8,500,000,000 | $100,000,000,000 |
| 🇹🇼 TSMC | $6,600,000,000 | $65,000,000,000 |
| 🇰🇷 Samsung | $6,400,000,000 | $45,000,000,000 |
| 🇺🇸 Micron | $6,100,000,000 | $50,000,000,000 |
| 🇺🇸 GlobalFoundries | $1,500,000,000 | $12,000,000,000 |
| 🇺🇸 Microchip | $162,000,000 | N/A |
| 🇬🇧 BAE Systems | $35,000,000 | N/A |
BAE Systems was not included in the graphic due to size limitations
Intel’s Massive Plans
Intel is receiving the largest share of the pie, with $8.5 billion in grants (plus an additional $11 billion in government loans). This grant accounts for 22% of the CHIPS Act’s total subsidies for chip production.
From Intel’s side, the company is expected to invest $100 billion to construct new fabs in Arizona and Ohio, while modernizing and/or expanding existing fabs in Oregon and New Mexico. Intel could also claim another $25 billion in credits through the U.S. Treasury Department’s Investment Tax Credit.
TSMC Expands its U.S. Presence
TSMC, the world’s largest semiconductor foundry company, is receiving a hefty $6.6 billion to construct a new chip plant with three fabs in Arizona. The Taiwanese chipmaker is expected to invest $65 billion into the project.
The plant’s first fab will be up and running in the first half of 2025, leveraging 4 nm (nanometer) technology. According to TrendForce, the other fabs will produce chips on more advanced 3 nm and 2 nm processes.
The Latest Grant Goes to Micron
Micron, the only U.S.-based manufacturer of memory chips, is set to receive $6.1 billion in grants to support its plans of investing $50 billion through 2030. This investment will be used to construct new fabs in Idaho and New York.

-

 Debt1 week ago
How Debt-to-GDP Ratios Have Changed Since 2000
-

 Markets2 weeks ago
Ranked: The World’s Top Flight Routes, by Revenue
-

 Countries2 weeks ago
Population Projections: The World’s 6 Largest Countries in 2075
-

 Markets2 weeks ago
The Top 10 States by Real GDP Growth in 2023
-

 Demographics2 weeks ago
The Smallest Gender Wage Gaps in OECD Countries
-

 United States2 weeks ago
Where U.S. Inflation Hit the Hardest in March 2024
-

 Green2 weeks ago
Top Countries By Forest Growth Since 2001
-

 United States2 weeks ago
Ranked: The Largest U.S. Corporations by Number of Employees