United States
Internet Adoption in America: Who Isn’t Online Yet?
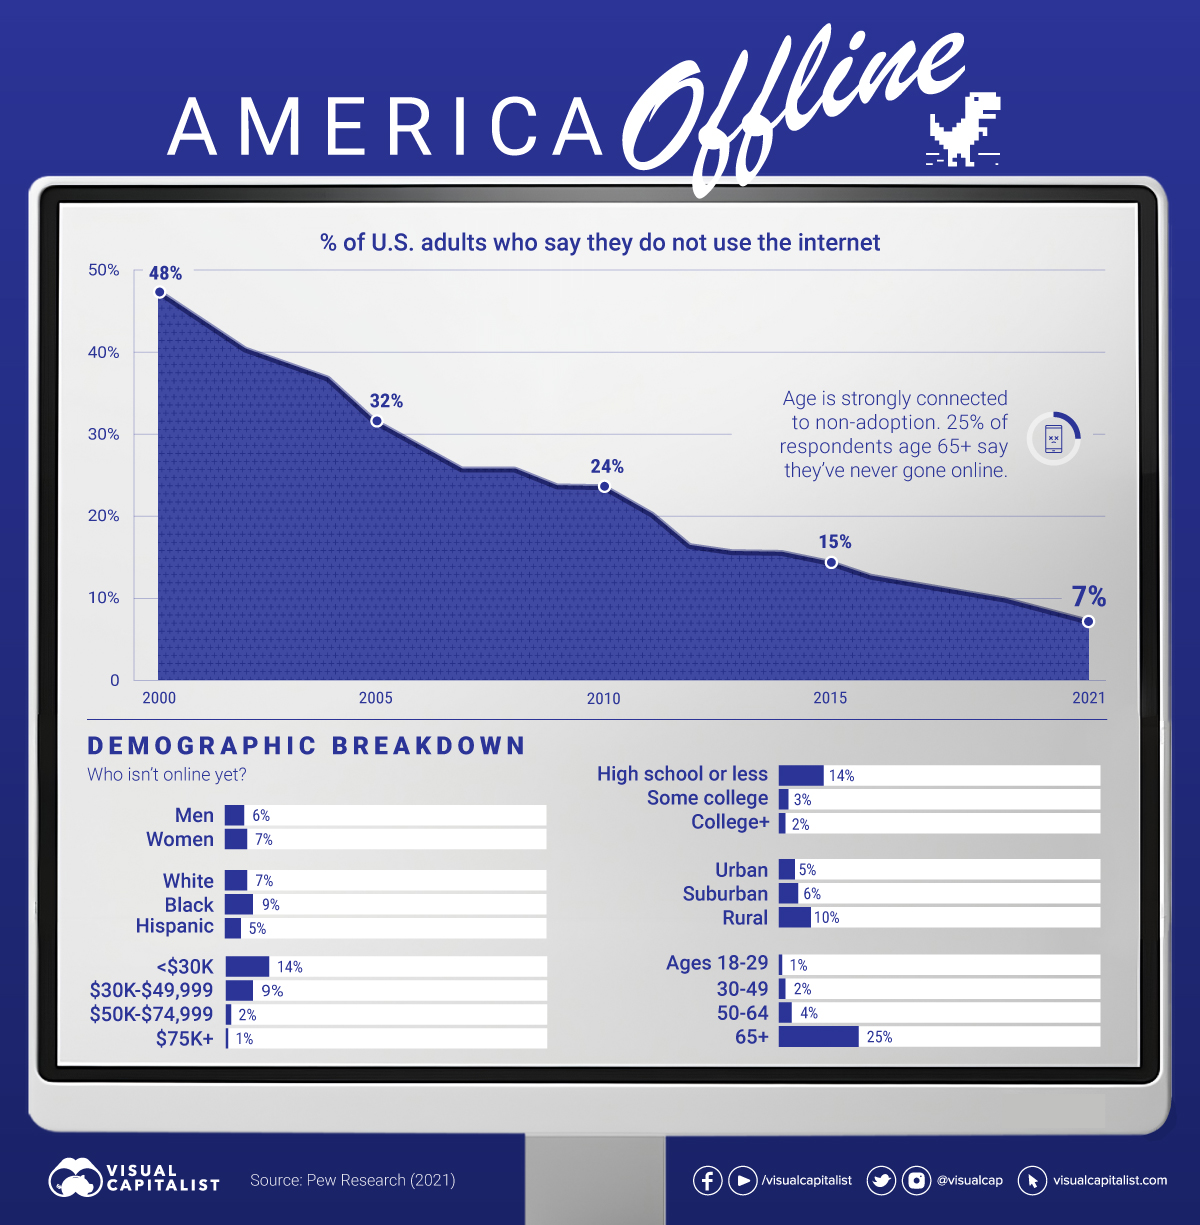
America Offline: Who Isn’t on the Internet Yet?
The internet is so widely used today that for many, it’s hard to imagine life without it. Yet, despite its prevalence, there’s still a small fraction of Americans who aren’t online.
Who are these non-adopters? Using data from Pew Research Center, this graphic provides a demographic breakdown of the U.S. adults who don’t use the internet.
The Demographic Breakdown
In the last two decades, internet adoption in the U.S. has skyrocketed, causing America’s offline population shrink to just 7%.
That’s a significant drop from 2000, when almost half of the American population did not use the internet.
According to the data, age seems closely linked to non-internet use—25% of respondents aged 65+ claimed they do not use the internet, compared to just 4% of those aged 50-64.
| Age | % of U.S. Adults Who Don’t Use the Internet |
|---|---|
| 18–29 | 1% |
| 30–49 | 2% |
| 50–64 | 4% |
| 65+ | 25% |
However, it’s worth noting that 86% of U.S. seniors (65+) weren’t online in 2000, so this age group has seen a significant increase in internet adoption over the last two decades.
Income also seems to be correlated with non-internet use. 14% of respondents with an annual household income below $30,000 claimed to not use the internet, compared to 1% who make $75,000 or more per year.
| Annual Household Income | % of U.S. Adults Who Don’t Use the Internet |
|---|---|
| <$30K | 14% |
| $30K–$49,999 | 9% |
| $50K–$74,999 | 2% |
| $75K+ | 1% |
Additionally, education may have positive correlation with internet adoption. Just 2–3% of survey respondents who went to college claimed to not use the internet, compared to 14% for those who didn’t study beyond high school. Interestingly, the data did not show a strong correlation between non-adoption and gender or race.
Why is This Important?
As the world becomes increasingly more digital, the internet is starting to become a necessity rather than a luxury. And those who don’t have good access to the web are starting to face significant obstacles in their day-to-day lives.
For instance, when schools closed down during the early days of the global pandemic, many American children in lower-income homes did not have reliable internet at home or didn’t have a computer to complete their schoolwork on.
Where does this data come from?
Source: Pew Research Center
Details: This survey is based on telephone interviews conducted in the U.S. from Jan. 25-Feb. 8, 2021, among a national sample of 1,502 adults, 18 years of age or older, living in all 50 U.S. states and the District of Columbia. Full details on methodology here.


United States
Ranked: The Largest U.S. Corporations by Number of Employees
We visualized the top U.S. companies by employees, revealing the massive scale of retailers like Walmart, Target, and Home Depot.


The Largest U.S. Corporations by Number of Employees
This was originally posted on our Voronoi app. Download the app for free on Apple or Android and discover incredible data-driven charts from a variety of trusted sources.
Revenue and profit are common measures for measuring the size of a business, but what about employee headcount?
To see how big companies have become from a human perspective, we’ve visualized the top U.S. companies by employees. These figures come from companiesmarketcap.com, and were accessed in March 2024. Note that this ranking includes publicly-traded companies only.
Data and Highlights
The data we used to create this list of largest U.S. corporations by number of employees can be found in the table below.
| Company | Sector | Number of Employees |
|---|---|---|
| Walmart | Consumer Staples | 2,100,000 |
| Amazon | Consumer Discretionary | 1,500,000 |
| UPS | Industrials | 500,000 |
| Home Depot | Consumer Discretionary | 470,000 |
| Concentrix | Information Technology | 440,000 |
| Target | Consumer Staples | 440,000 |
| Kroger | Consumer Staples | 430,000 |
| UnitedHealth | Health Care | 400,000 |
| Berkshire Hathaway | Financials | 383,000 |
| Starbucks | Consumer Discretionary | 381,000 |
| Marriott International | Consumer Discretionary | 377,000 |
| Cognizant | Information Technology | 346,600 |
Retail and Logistics Top the List
Companies like Walmart, Target, and Kroger have a massive headcount due to having many locations spread across the country, which require everything from cashiers to IT professionals.
Moving goods around the world is also highly labor intensive, explaining why UPS has half a million employees globally.
Below the Radar?
Two companies that rank among the largest U.S. corporations by employees which may be less familiar to the public include Concentrix and Cognizant. Both of these companies are B2B brands, meaning they primarily work with other companies rather than consumers. This contrasts with brands like Amazon or Home Depot, which are much more visible among average consumers.
A Note on Berkshire Hathaway
Warren Buffett’s company doesn’t directly employ 383,000 people. This headcount actually includes the employees of the firm’s many subsidiaries, such as GEICO (insurance), Dairy Queen (retail), and Duracell (batteries).
If you’re curious to see how Buffett’s empire has grown over the years, check out this animated graphic that visualizes the growth of Berkshire Hathaway’s portfolio from 1994 to 2022.

-

 Debt1 week ago
How Debt-to-GDP Ratios Have Changed Since 2000
-

 Markets2 weeks ago
Ranked: The World’s Top Flight Routes, by Revenue
-

 Demographics2 weeks ago
Population Projections: The World’s 6 Largest Countries in 2075
-

 Markets2 weeks ago
The Top 10 States by Real GDP Growth in 2023
-

 Demographics2 weeks ago
The Smallest Gender Wage Gaps in OECD Countries
-

 Economy2 weeks ago
Where U.S. Inflation Hit the Hardest in March 2024
-

 Green2 weeks ago
Top Countries By Forest Growth Since 2001
-

 United States2 weeks ago
Ranked: The Largest U.S. Corporations by Number of Employees