Technology
Ranking U.S. States with the Best Internet Value
Article/Editing:
!function(e,i,n,s){var t=”InfogramEmbeds”,d=e.getElementsByTagName(“script”)[0];if(window[t]&&window[t].initialized)window[t].process&&window[t].process();else if(!e.getElementById(n)){var o=e.createElement(“script”);o.async=1,o.id=n,o.src=”https://e.infogram.com/js/dist/embed-loader-min.js”,d.parentNode.insertBefore(o,d)}}(document,0,”infogram-async”);
Ranking U.S. States with the Best Internet Value
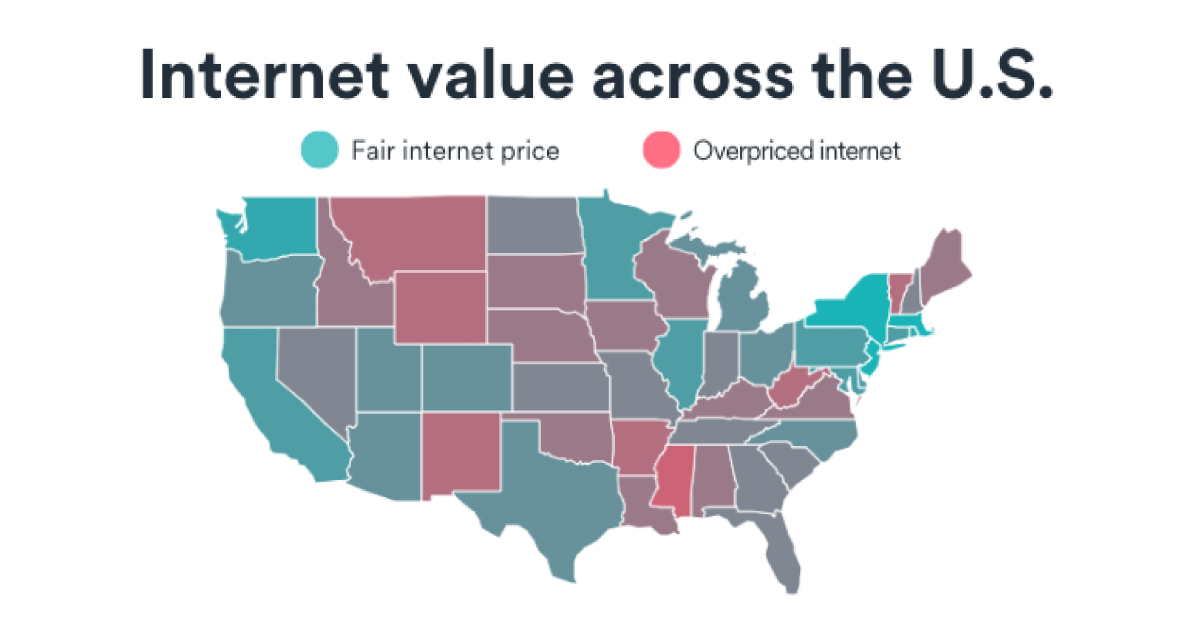
Internet access has increased over the years, but both internet speed and affordability can vary considerably around the world, and even within the U.S. itself.
This interactive data visualization by Surfshark examines which states have the best internet value on average, and which have the worst. It uses data compiled for the company’s 2022 Internet Value Index.
Calculating Value
How do you measure the “best” internet value?
Surfshark’s Internet Value Index scores U.S. states on both broadband and mobile internet, measuring the ratio of speed to affordability, with each factor defined as follows:
- Internet Speed: The average download speeds between Q3 of 2021 and Q2 of 2022.
- Internet Affordability: The average monthly price of a standard internet or data package divided by the average hourly net wage in each state.
Each state’s index value is calculated by dividing speed by affordability for both broadband and mobile internet, then normalizing over the maximum value of 1.0.
Which States Have the Best Internet Value?
Surfshark’s study revealed large disparities between rural and urban states, highlighting the country’s digital divide. Here’s their full list of 50 U.S. states and internet index rankings in 2022.
| State | Internet Value Rank | Broadband Value Rank | Mobile Value Rank | Region |
|---|---|---|---|---|
| New Jersey | 1 | 1 | 2 | Northeast |
| Massachusetts | 2 | 2 | 3 | Northeast |
| New York | 3 | 4 | 1 | Northeast |
| Rhode Island | 4 | 7 | 4 | Northeast |
| Washington | 5 | 9 | 6 | West |
| Maryland | 6 | 12 | 7 | South |
| Delaware | 7 | 10 | 8 | South |
| Connecticut | 8 | 5 | 10 | Northeast |
| Illinois | 9 | 11 | 9 | Midwest |
| California | 10 | 8 | 11 | West |
| Hawaii | 11 | 3 | 22 | West |
| Minnesota | 12 | 26 | 5 | Midwest |
| Pennsylvania | 13 | 14 | 12 | Northeast |
| Texas | 14 | 6 | 27 | South |
| Utah | 15 | 20 | 13 | West |
| Colorado | 16 | 25 | 14 | West |
| Ohio | 17 | 17 | 16 | Midwest |
| Arizona | 18 | 18 | 17 | West |
| Michigan | 19 | 27 | 15 | Midwest |
| North Carolina | 20 | 13 | 29 | South |
| Oregon | 21 | 22 | 19 | West |
| New Hampshire | 22 | 15 | 31 | Northeast |
| Indiana | 23 | 24 | 24 | Midwest |
| Georgia | 24 | 19 | 28 | South |
| South Carolina | 25 | 16 | 33 | South |
| Tennessee | 26 | 21 | 30 | South |
| North Dakota | 27 | 29 | 21 | Midwest |
| Nevada | 28 | 33 | 20 | West |
| Florida | 29 | 30 | 25 | South |
| Missouri | 30 | 35 | 23 | Midwest |
| Kansas | 31 | 28 | 26 | Midwest |
| Virginia | 32 | 44 | 18 | South |
| Wisconsin | 33 | 34 | 34 | Midwest |
| Kentucky | 34 | 31 | 36 | South |
| Nebraska | 35 | 23 | 47 | Midwest |
| South Dakota | 36 | 40 | 32 | Midwest |
| Alabama | 37 | 32 | 41 | South |
| Maine | 38 | 36 | 39 | Northeast |
| Oklahoma | 39 | 38 | 42 | South |
| Louisiana | 40 | 37 | 45 | South |
| Idaho | 41 | 42 | 37 | West |
| Iowa | 42 | 41 | 44 | Midwest |
| Alaska | 43 | 48 | 35 | West |
| New Mexico | 44 | 45 | 38 | West |
| Vermont | 45 | 43 | 43 | Northeast |
| West Virginia | 46 | 39 | 49 | South |
| Montana | 47 | 50 | 40 | West |
| Arkansas | 48 | 47 | 48 | South |
| Wyoming | 49 | 49 | 46 | West |
| Mississippi | 50 | 46 | 50 | South |
New Jersey, Massachusetts, and New York deliver the best value for internet services. Workers in all three states received fixed broadband speeds above 37 Mbps per hour of work at the average net state wage, and mobile speeds of 5 Mbps or more.
On the other end of the index, Mississippi, Wyoming, and Arkansas had some of the worst value services. Using the same ratio, workers got download speeds of 16 Mbps and below per hour of work for broadband, and mobile speeds of 2 Mbps or lower.
Regional disparity is quite clear, with five of the top 10 states being located in the Northeast. Eight of the bottom 10 states, meanwhile, were in the West and South.
Interestingly, the Midwest was the second best region for internet value, but still ranked below the country’s average score. This further highlights the disproportionate value earned by higher-income and heavily-populated states over others.
Internet For All?
Internet affordability (or lack thereof) can have economic consequences, particularly in the wake of the COVID-19 pandemic.
An IMF study details how high-speed internet has become critical for socioeconomic inclusion for work, education, and access to services.
As more workplaces and schools expect tasks to get done in a remote environment, it’s expected that affordable, high-quality internet will become even more critical going forward.

This article was published as a part of Visual Capitalist's Creator Program, which features data-driven visuals from some of our favorite Creators around the world.


Technology
All of the Grants Given by the U.S. CHIPS Act
Intel, TSMC, and more have received billions in subsidies from the U.S. CHIPS Act in 2024.


All of the Grants Given by the U.S. CHIPS Act
This was originally posted on our Voronoi app. Download the app for free on iOS or Android and discover incredible data-driven charts from a variety of trusted sources.
This visualization shows which companies are receiving grants from the U.S. CHIPS Act, as of April 25, 2024. The CHIPS Act is a federal statute signed into law by President Joe Biden that authorizes $280 billion in new funding to boost domestic research and manufacturing of semiconductors.
The grant amounts visualized in this graphic are intended to accelerate the production of semiconductor fabrication plants (fabs) across the United States.
Data and Company Highlights
The figures we used to create this graphic were collected from a variety of public news sources. The Semiconductor Industry Association (SIA) also maintains a tracker for CHIPS Act recipients, though at the time of writing it does not have the latest details for Micron.
| Company | Federal Grant Amount | Anticipated Investment From Company |
|---|---|---|
| 🇺🇸 Intel | $8,500,000,000 | $100,000,000,000 |
| 🇹🇼 TSMC | $6,600,000,000 | $65,000,000,000 |
| 🇰🇷 Samsung | $6,400,000,000 | $45,000,000,000 |
| 🇺🇸 Micron | $6,100,000,000 | $50,000,000,000 |
| 🇺🇸 GlobalFoundries | $1,500,000,000 | $12,000,000,000 |
| 🇺🇸 Microchip | $162,000,000 | N/A |
| 🇬🇧 BAE Systems | $35,000,000 | N/A |
BAE Systems was not included in the graphic due to size limitations
Intel’s Massive Plans
Intel is receiving the largest share of the pie, with $8.5 billion in grants (plus an additional $11 billion in government loans). This grant accounts for 22% of the CHIPS Act’s total subsidies for chip production.
From Intel’s side, the company is expected to invest $100 billion to construct new fabs in Arizona and Ohio, while modernizing and/or expanding existing fabs in Oregon and New Mexico. Intel could also claim another $25 billion in credits through the U.S. Treasury Department’s Investment Tax Credit.
TSMC Expands its U.S. Presence
TSMC, the world’s largest semiconductor foundry company, is receiving a hefty $6.6 billion to construct a new chip plant with three fabs in Arizona. The Taiwanese chipmaker is expected to invest $65 billion into the project.
The plant’s first fab will be up and running in the first half of 2025, leveraging 4 nm (nanometer) technology. According to TrendForce, the other fabs will produce chips on more advanced 3 nm and 2 nm processes.
The Latest Grant Goes to Micron
Micron, the only U.S.-based manufacturer of memory chips, is set to receive $6.1 billion in grants to support its plans of investing $50 billion through 2030. This investment will be used to construct new fabs in Idaho and New York.

-

 Misc1 week ago
How Hard Is It to Get Into an Ivy League School?
-

 Technology2 weeks ago
Ranked: Semiconductor Companies by Industry Revenue Share
-

 Markets2 weeks ago
Ranked: The World’s Top Flight Routes, by Revenue
-

 Countries2 weeks ago
Population Projections: The World’s 6 Largest Countries in 2075
-

 Markets2 weeks ago
The Top 10 States by Real GDP Growth in 2023
-

 Demographics2 weeks ago
The Smallest Gender Wage Gaps in OECD Countries
-

 United States2 weeks ago
Where U.S. Inflation Hit the Hardest in March 2024
-

 Green2 weeks ago
Top Countries By Forest Growth Since 2001