

How personal are your investments? We chart investment preferences by generation in the U.S. based on a survey of 2,200 investors in 2023.


Video gaming is the most popular form of entertainment. But how people engage with video games looks different by generation.


We've visualized data from the Federal Reserve to provide a comprehensive break down of U.S. assets by generation.


Internet adoption is widespread in the U.S. In fact, only 7% of Americans do not use the internet. Who are these non-adopters?
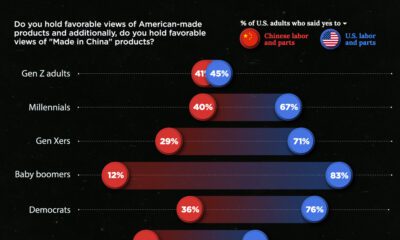

Around 70% of U.S. adults claim to prefer 'made in America' products. This chart breaks down the demographics of patriotic purchases.


This graphic visualizes the ages of every country’s head of state, and compares them with the median population of their respective states.
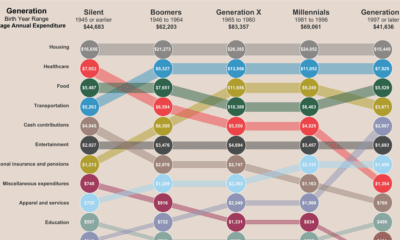

This interactive graphic shows a breakdown of how average Americans spend their money, and how expenses vary across generations.
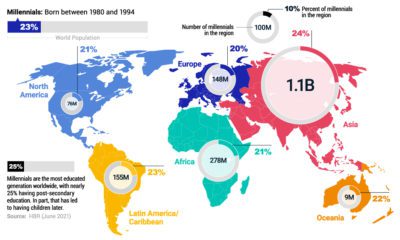

This map shows millennials around the world. Here's why millennials stand to shape society as we know it—from finance to politics.


The majority of U.S. households saw debts rise in 2020. This data looks at the growth in household debt and the existing debt pile, by generation
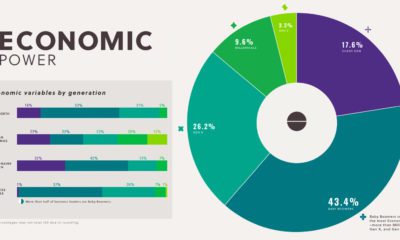

Baby Boomers hold more economic power than Gen X, Millennials, and Gen Z together. See how it all breaks down.


 Creator Program