Personal Finance
Charted: Investment Preferences by Generation in the U.S.
Investment Preferences by Generation in the U.S.
Different generations grow up with different values and different economic realities, causing investment preferences by generation to vary across the board.
The above graphic shows how different generations invest—from millennials to boomers—based on June 2023 survey data from Charles Schwab.
Which Generations Prefer ETF Investing and Personalization?
Which generation prefers ETFs the most, and which cares about investments that reflect their values?
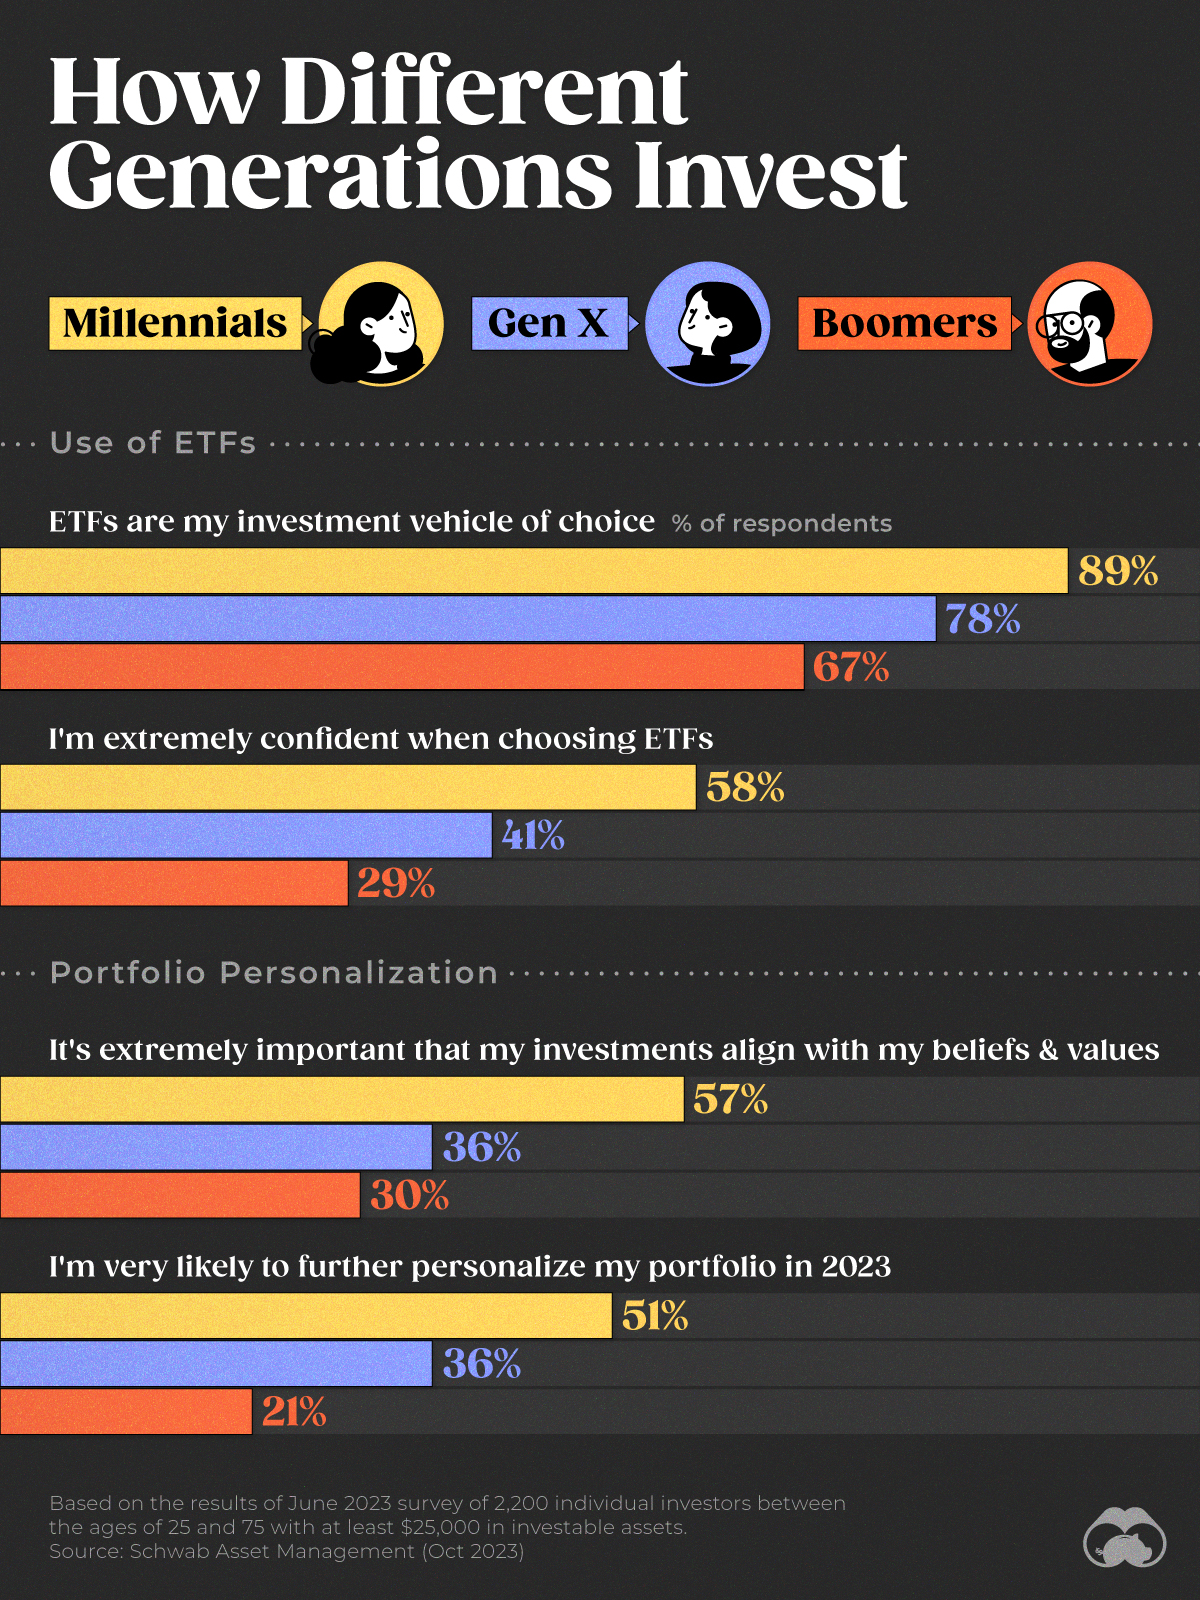
In the table below, we show survey data from 2,200 American investors in 2023 surrounding their views on investing. Here are the shares of different generations that agreed with the following statements:
| Statement by Agreeable Share | Millennials | Gen X | Boomers |
|---|---|---|---|
| ETFs are my investment vehicle of choice | 89% | 78% | 67% |
| I'm extremely confident when choosing ETFs | 58% | 41% | 29% |
| It's extremely important that my investments align with my beliefs & values | 57% | 36% | 30% |
| I'm very likely to further personalize my portfolio in 2023 | 51% | 36% | 21% |
Millennials, who are born between 1981 and 1996, have the strongest preference for ETFs. They also are the most confident when choosing these types of investments.
In addition, 57% said that it was extremely important for their investments to align with their values, which are more individualistic. This was nearly double the share of those in the baby boomer generation, born between 1946 and 1964.
In line with this trend, other personalization features appealed to millennials, while this factor dropped with each subsequent generation significantly.
“Investors’ desire to have more control and alignment of investments with their personal views is a major long-term shift that is still in the early innings”
-David Botset, Head of Equity Product Management and Innovation at Schwab Asset Management


Personal Finance
Chart: The Declining Value of the U.S. Federal Minimum Wage
This graphic compares the nominal vs. inflation-adjusted value of the U.S. minimum wage, from 1940 to 2023.


The Declining Value of the U.S. Federal Minimum Wage
This was originally posted on our Voronoi app. Download the app for free on iOS or Android and discover incredible data-driven charts from a variety of trusted sources.
This graphic illustrates the history of the U.S. federal minimum wage using data compiled by Statista, in both nominal and real (inflation-adjusted) terms. The federal minimum wage was raised to $7.25 per hour in July 2009, where it has remained ever since.
Nominal vs. Real Value
The data we used to create this graphic can be found in the table below.
| Year | Nominal value ($/hour) | Real value ($/hour) |
|---|---|---|
| 1940 | 0.3 | 6.5 |
| 1945 | 0.4 | 6.82 |
| 1950 | 0.75 | 9.64 |
| 1955 | 0.75 | 8.52 |
| 1960 | 1 | 10.28 |
| 1965 | 1.25 | 12.08 |
| 1970 | 1.6 | 12.61 |
| 1975 | 2.1 | 12.04 |
| 1980 | 3.1 | 11.61 |
| 1985 | 3.35 | 9.51 |
| 1990 | 3.8 | 8.94 |
| 1995 | 4.25 | 8.49 |
| 2000 | 5.15 | 9.12 |
| 2005 | 5.15 | 8.03 |
| 2010 | 7.25 | 10.09 |
| 2015 | 7.25 | 9.3 |
| 2018 | 7.25 | 8.78 |
| 2019 | 7.25 | 8.61 |
| 2020 | 7.25 | 8.58 |
| 2021 | 7.25 | 8.24 |
| 2022 | 7.25 | 7.61 |
| 2023 | 7.25 | 7.25 |
What our graphic shows is how inflation has eroded the real value of the U.S. minimum wage over time, despite nominal increases.
For instance, consider the year 1960, when the federal minimum wage was $1 per hour. After accounting for inflation, this would be worth around $10.28 today!
The two lines converge at 2023 because the nominal and real value are identical in present day terms.
Many States Have Their Own Minimum Wage
According to the National Conference of State Legislatures (NCSL), 30 states and Washington, D.C. have implemented a minimum wage that is higher than $7.25.
The following states have adopted the federal minimum: Georgia, Idaho, Indiana, Iowa, Kansas, Kentucky, New Hampshire, North Carolina, North Dakota, Oklahoma, Pennsylvania, Texas, Utah, Wisconsin, and Wyoming.
Meanwhile, the states of Alabama, Louisiana, Mississippi, South Carolina, and Tennessee have no wage minimums, but have to follow the federal minimum.
How Does the U.S. Minimum Wage Rank Globally?
If you found this topic interesting, check out Mapped: Minimum Wage Around the World to see which countries have the highest minimum wage in monthly terms, as of January 2023.

-

 Science1 week ago
Visualizing the Average Lifespans of Mammals
-

 Markets2 weeks ago
The Top 10 States by Real GDP Growth in 2023
-

 Demographics2 weeks ago
The Smallest Gender Wage Gaps in OECD Countries
-

 United States2 weeks ago
Where U.S. Inflation Hit the Hardest in March 2024
-

 Green2 weeks ago
Top Countries By Forest Growth Since 2001
-

 United States2 weeks ago
Ranked: The Largest U.S. Corporations by Number of Employees
-

 Maps2 weeks ago
The Largest Earthquakes in the New York Area (1970-2024)
-

 Green2 weeks ago
Ranked: The Countries With the Most Air Pollution in 2023