Jobs
Charted: Gen Z Job Attitudes Compared with Other Generations


Charted: Gen Z Job Attitudes Compared with Other Generations
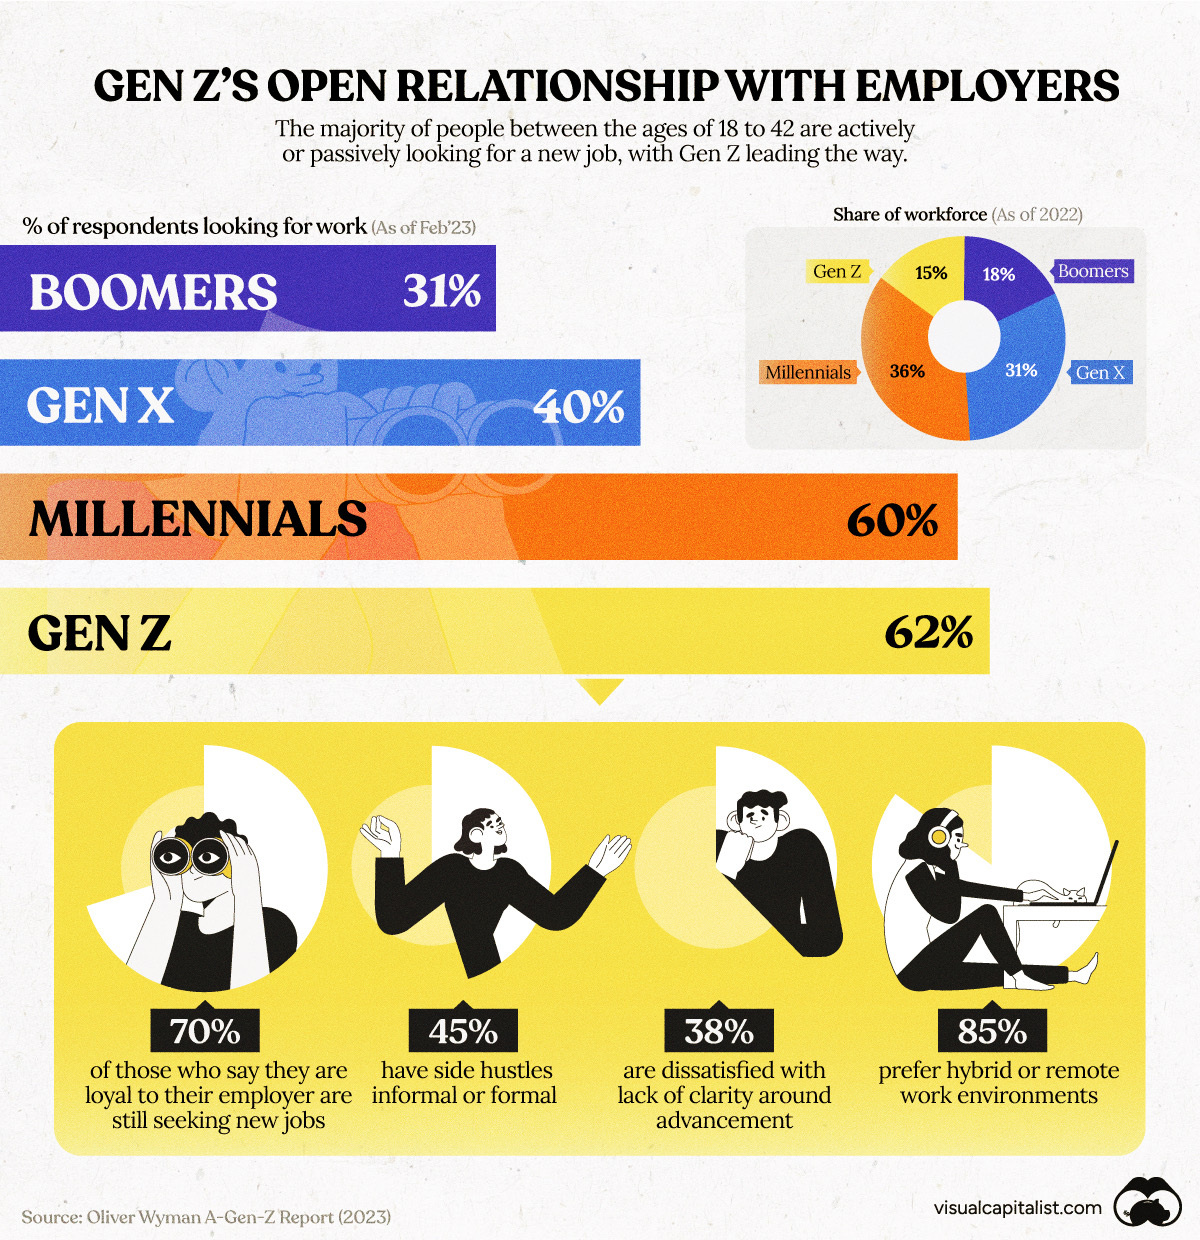
Young working adults from Gen Z—born between 1997-2012—so far have a different relationship with their employers than other generations.
Gone are the days of sticking with one company for an entire 40-year career. According to Oliver Wyman, Gen Z workers shop around when it comes to work: 62% of them are actively or passively looking for new jobs.
This chart uses data from Oliver Wyman’s Gen-Z Report (2023) to showcase the generational divides of survey respondents who said they were either actively or passively looking for new work. The survey assessed 10,000 adults in the United States and United Kingdom.
The Survey Results
As of 2023, Gen Z already makes up approximately 15% of the workforce in the U.S. and UK. By 2031, that share is predicted to climb to 31%, second only to millennials.
And many in this young, up-and-coming labor force are more open about seeking alternative employment compared to their older counterparts:
| Generation | Respondents Looking for Work |
|---|---|
| Gen Z | 62% |
| Millennials | 60% |
| Gen X | 40% |
| Boomers | 31% |
While millennials follow closely behind, far fewer Gen Xers and baby boomers are seeking new roles. Part of this, however, could simply be that those in older generations are far more established in their roles or careers, and are less actively looking for change.
Regardless, Gen Z is incredibly flexible. When compared to other generations, they are also more than twice as likely to have an additional job on the side of their main role.
Shifting Approach to Work
One of the biggest reasons Gen Z actively scours available job postings is because of economic disparities between generations.
Of Gen Z workers, 37% feel underpaid for the amount of hours they work, compared to 29% of non-Gen Z workers. Gen Z women in particular were found to be almost 60% more likely than Gen Z men to leave a job in search of better compensation.
On top of consistently seeking better pay, Gen Z also wants to retire earlier. Looking at average U.S. and UK data, Gen Z’s ideal retirement age is astoundingly young at 54 years old, but most don’t realistically expect to be retired until 60.
Gen Z is important to watch as they are the most diverse, most educated, and most technological savvy generation in history. How they want to work will become increasingly important for employers to consider in order to keep them invested.


Economy
Mapped: Unemployment Claims by State
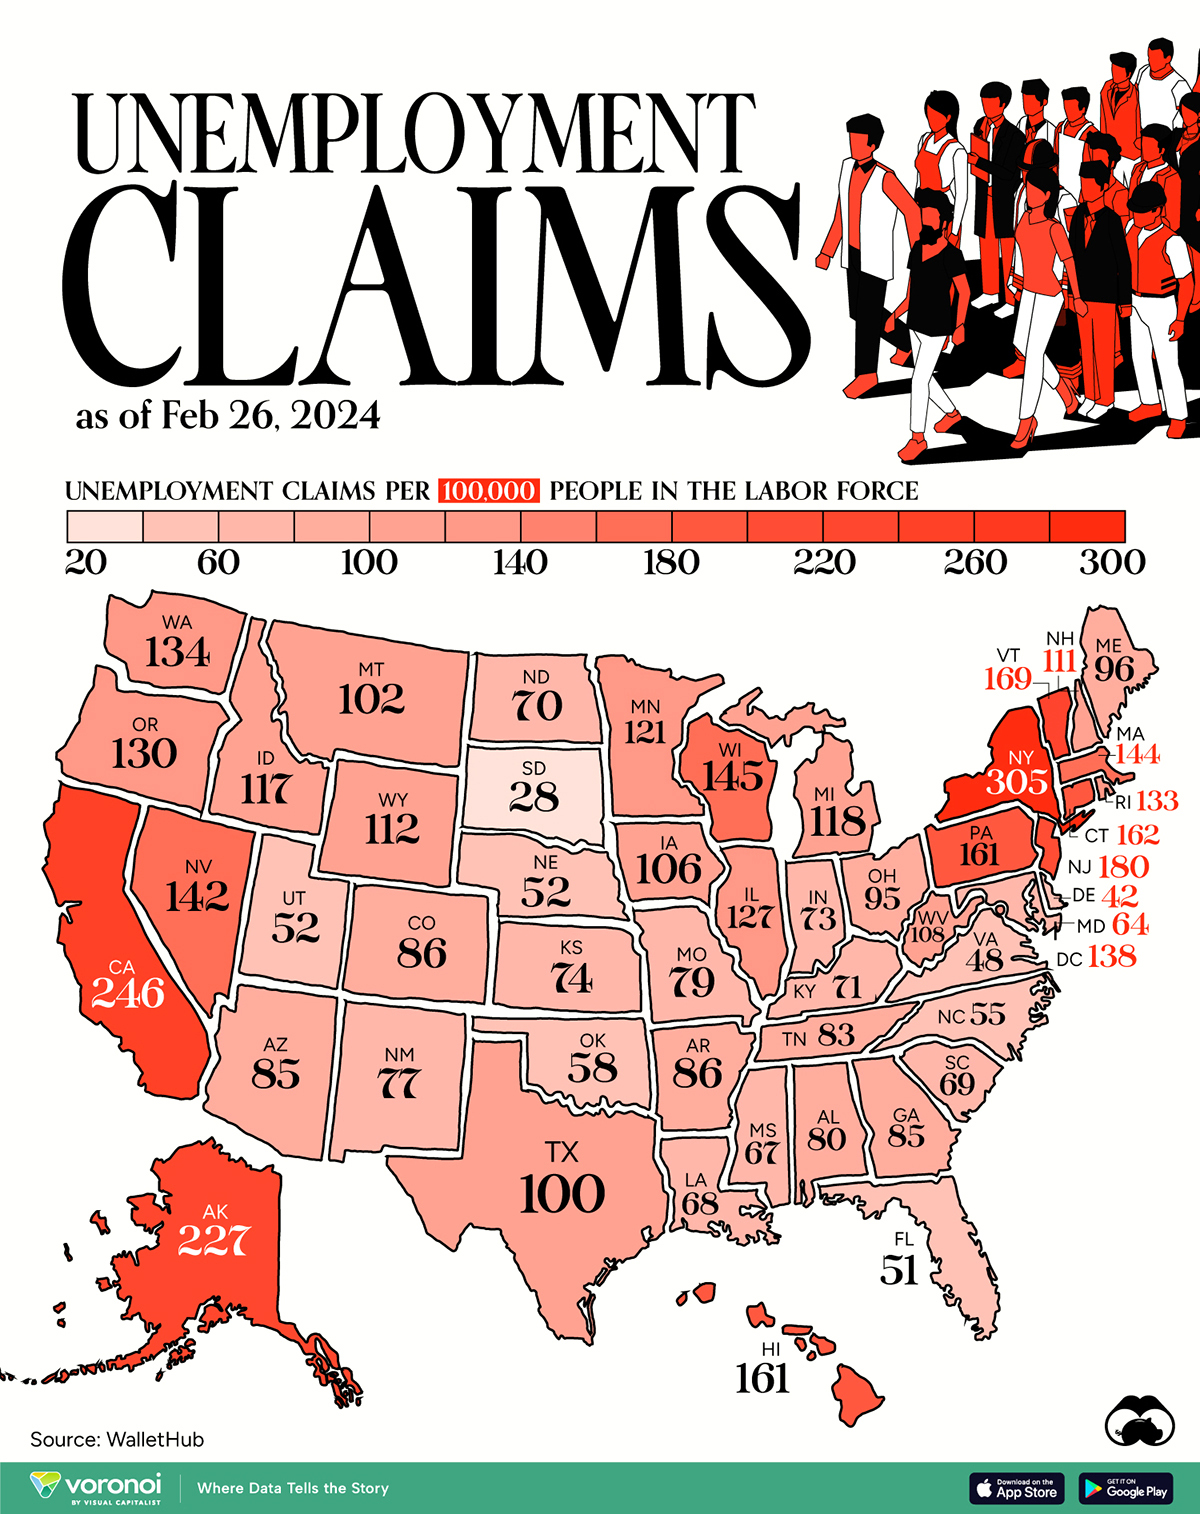
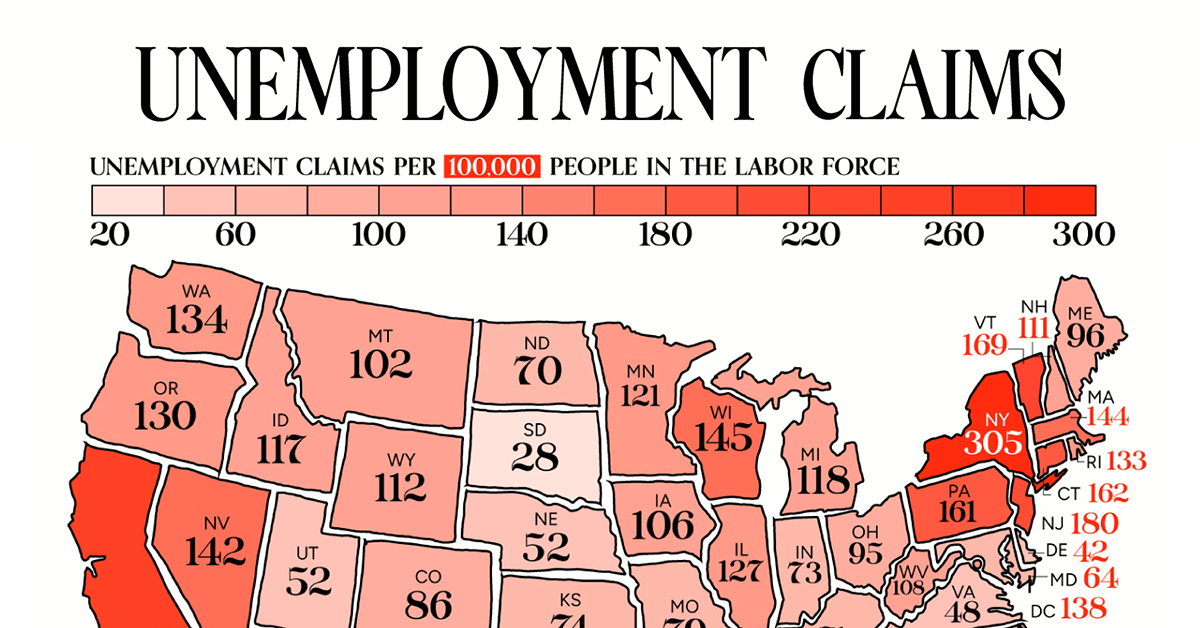
This visual heatmap of unemployment claims by state highlights New York, California, and Alaska leading the country by a wide margin.
Mapped: Weekly Unemployment Claims by State
This was originally posted on our Voronoi app. Download the app for free on iOS or Android and discover incredible data-driven charts from a variety of trusted sources.
Unemployment claims per 100,000 people is a handy metric for gauging the health of the job market. Generally speaking, a higher number of claims suggests that more people are unemployed, which may highlight issues with the economy.
In this graphic, we’ve visualized the number of weekly initial unemployment claims per 100,000 people in the labor force across the U.S., using data from WalletHub. All figures are for the week ending Feb 26, 2024, with data being released in early March.
| State | Unemployment Claims per 100,000 People in the Labor Force |
|---|---|
| New York | 305 |
| California | 246 |
| Alaska | 227 |
| New Jersey | 180 |
| Vermont | 169 |
| Connecticut | 162 |
| Pennsylvania | 161 |
| Hawaii | 161 |
| Wisconsin | 145 |
| Massachusetts | 144 |
| Nevada | 142 |
| DC | 138 |
| Washington | 134 |
| Rhode Island | 133 |
| Oregon | 130 |
| Illinois | 127 |
| Minnesota | 121 |
| Michigan | 118 |
| Idaho | 117 |
| Wyoming | 112 |
| New Hampshire | 111 |
| West Virginia | 108 |
| Iowa | 106 |
| Montana | 102 |
| Texas | 100 |
| Maine | 96 |
| Ohio | 95 |
| Colorado | 86 |
| Arkansas | 86 |
| Arizona | 85 |
| Georgia | 85 |
| Tennessee | 83 |
| Alabama | 80 |
| Missouri | 79 |
| New Mexico | 77 |
| Kansas | 74 |
| Indiana | 73 |
| Kentucky | 71 |
| North Dakota | 70 |
| South Carolina | 69 |
| Louisiana | 68 |
| Mississippi | 67 |
| Maryland | 64 |
| Oklahoma | 58 |
| North Carolina | 55 |
| Nebraska | 52 |
| Utah | 52 |
| Florida | 51 |
| Virginia | 48 |
| Delaware | 42 |
| South Dakota | 28 |
Across the country, there are 6.1 million Americans unemployed as of end of February, resulting in a national unemployment rate of around 3.9%. Notably, this is the highest figure seen since January 2022.
States With the Largest Increases
For further context, we can examine the change in unemployment claims by state for the period of Jan 1- Feb 26, in 2024 and 2023.
States that saw the biggest rise over this period were New York, New Jersey, and Nevada. A top 10 list can be found below.
| State | Change in Unemployment Claims (Jan-Feb, 2023 vs 2024) |
|---|---|
| New York | 2,725% |
| New Jersey | 2,132% |
| Nevada | 505% |
| Arizona | 51% |
| Iowa | 45% |
| Maryland | 35% |
| North Carolina | 34% |
| Virginia | 31% |
| Montana | 25% |
| Oklahoma | 24% |
From a broader perspective, weekly initial claims for unemployment insurance across the U.S. have hovered around the low 200,000s in 2024. This is generally in line with figures seen prior to the COVID-19 pandemic.
In the week of April 4, 2020, unemployment claims spiked to 6.137 million due to COVID-related lockdowns and business closures.
Learn More About the U.S Job Market
Before you go, be sure to check out Visualizing the American Workforce as 100 People to gain a unique perspective on the U.S. economy.

-

 Sports1 week ago
The Highest Earning Athletes in Seven Professional Sports
-

 Countries2 weeks ago
Population Projections: The World’s 6 Largest Countries in 2075
-

 Markets2 weeks ago
The Top 10 States by Real GDP Growth in 2023
-

 Demographics2 weeks ago
The Smallest Gender Wage Gaps in OECD Countries
-

 United States2 weeks ago
Where U.S. Inflation Hit the Hardest in March 2024
-

 Green2 weeks ago
Top Countries By Forest Growth Since 2001
-

 United States2 weeks ago
Ranked: The Largest U.S. Corporations by Number of Employees
-

 Maps2 weeks ago
The Largest Earthquakes in the New York Area (1970-2024)