Money
Who Expects to Get Richer in 2024, by Both Generation and Gender
![]() See this visualization first on the Voronoi app.
See this visualization first on the Voronoi app.
Who Expects to Get Richer in 2024, by Generation and Gender
This was originally posted on our Voronoi app. Download the app for free on Apple or Android and discover incredible data-driven charts from a variety of trusted sources.
The jury is still out on how the global economy is expected to perform in 2024, but as seen during the pandemic, economic turmoil sometimes provides opportunities for the wealthy.
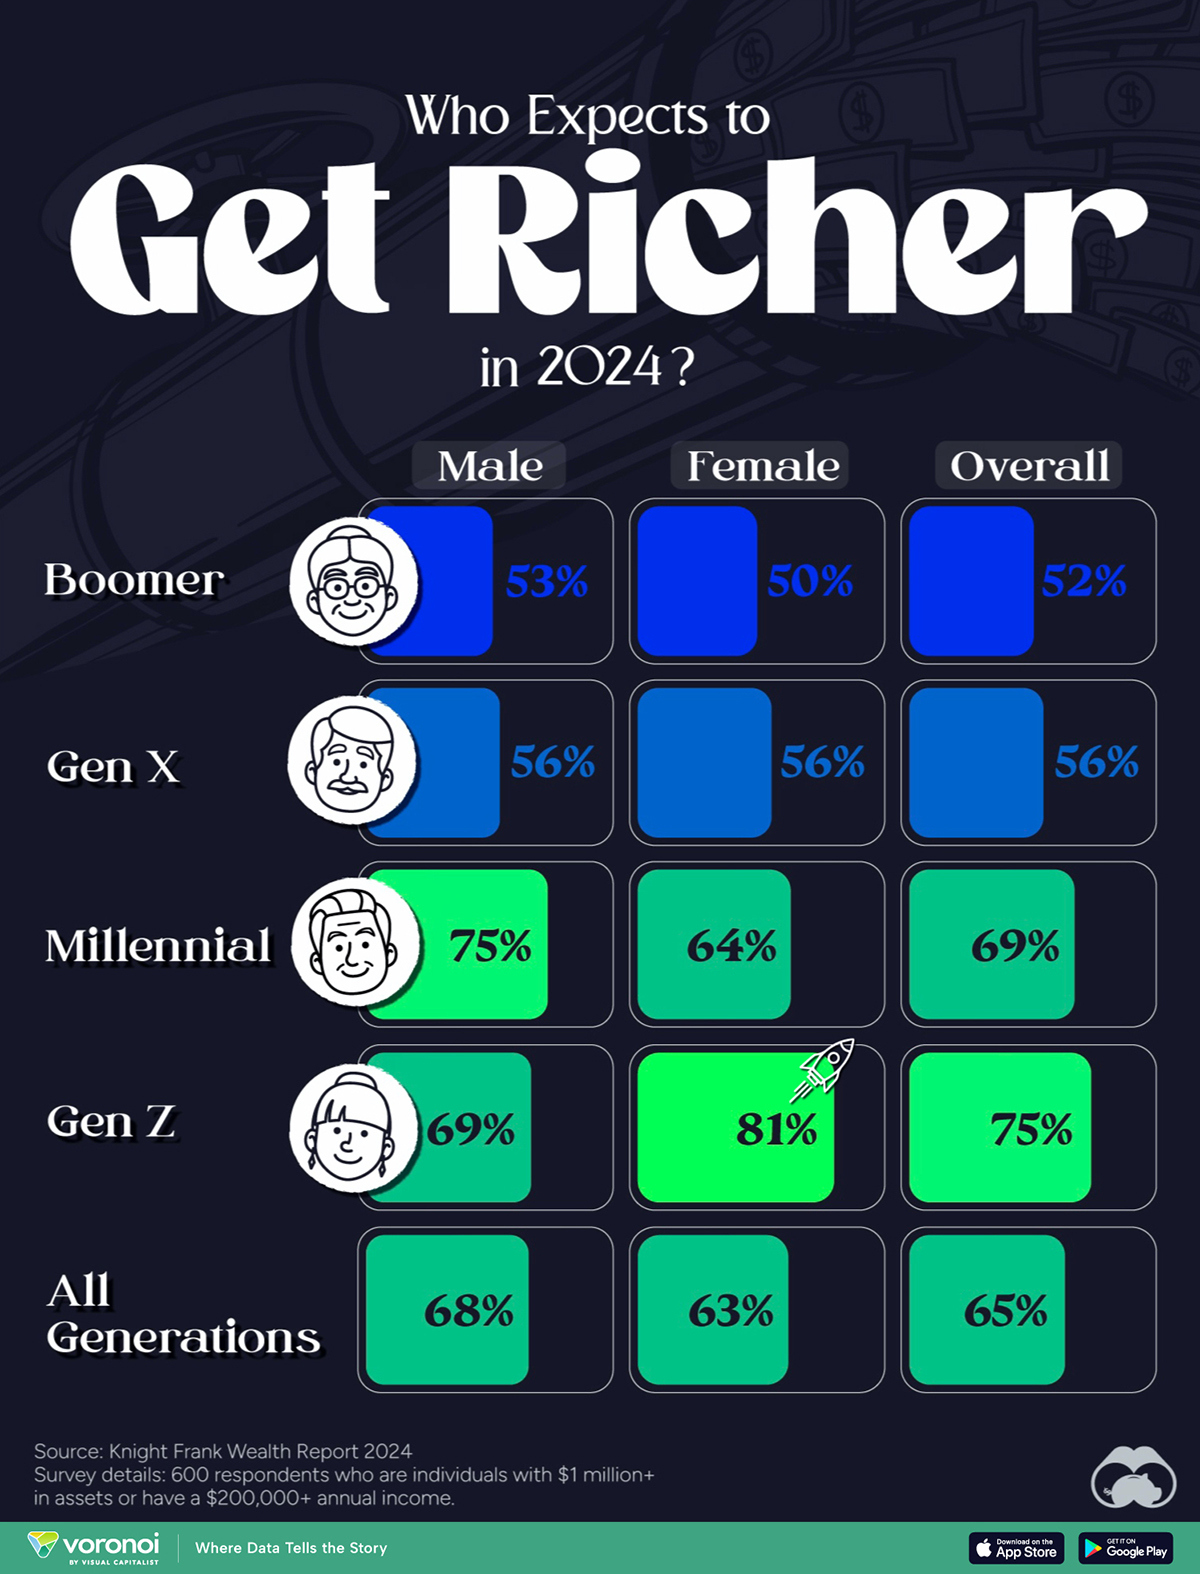
We visualize the percentage of high net worth individual (HNWI) respondents who expect their wealth to increase in 2024, categorized by generation and gender, from the Knight Frank Next Gen Survey, accessible in their latest wealth report.
The survey covered 600 global HNWIs, who are individuals with more than $1 million in assets or make more than $200,000 a year, and then categorized their responses by gender and generation.
Affluent Gen Z Women Eye Financial Gains in 2024
At a glance, there’s a very apparent generational difference in the expectations of getting richer in 2024.
About half (52%) of the surveyed Baby Boomers think their assets will grow, compared to Gen X (56%), Millennials, (69%), and Gen Z (75%).
| Group | Male | Female | Overall |
|---|---|---|---|
| 👴 Boomer | 53% | 50% | 52% |
| 👩🦳 Gen X | 56% | 56% | 56% |
| 👩🦱 Millennial | 75% | 64% | 69% |
| 🧑🦰 Gen Z | 69% | 81% | 75% |
| 👨👩👧👦 All Generations | 68% | 63% | 65% |
Note: Percentage of respondents who said they expect their wealth will increase in 2024.
There’s also a noticeable gender difference. Men tend to be more optimistic than women, with one glaring exception.
A staggering 81% of the surveyed high net worth Gen Z women expect to make hay this year, making them the most optimistic of all the groups.
This corroborates a trend where Gen Z women were also the most optimistic in retirement planning. As CNBC reports, a combination of newer avenues of financial resources, and an openness towards advice, has given them a more optimistic attitude than their older counterparts.
Meanwhile, American Millennials are expected to become the richest generation ever as a $90 trillion asset transfer between Boomer parents and Millennial children begins to take place over the next two decades.
A huge percentage of that wealth comes in the form of property assets accumulated by generations before them. This especially includes houses, whose prices have skyrocketed over the last two decades.


Money
Charted: Which City Has the Most Billionaires in 2024?
Just two countries account for half of the top 20 cities with the most billionaires. And the majority of the other half are found in Asia.


Charted: Which Country Has the Most Billionaires in 2024?
This was originally posted on our Voronoi app. Download the app for free on iOS or Android and discover incredible data-driven charts from a variety of trusted sources.
Some cities seem to attract the rich. Take New York City for example, which has 340,000 high-net-worth residents with investable assets of more than $1 million.
But there’s a vast difference between being a millionaire and a billionaire. So where do the richest of them all live?
Using data from the Hurun Global Rich List 2024, we rank the top 20 cities with the highest number of billionaires in 2024.
A caveat to these rich lists: sources often vary on figures and exact rankings. For example, in last year’s reports, Forbes had New York as the city with the most billionaires, while the Hurun Global Rich List placed Beijing at the top spot.
Ranked: Top 20 Cities with the Most Billionaires in 2024
The Chinese economy’s doldrums over the course of the past year have affected its ultra-wealthy residents in key cities.
Beijing, the city with the most billionaires in 2023, has not only ceded its spot to New York, but has dropped to #4, overtaken by London and Mumbai.
| Rank | City | Billionaires | Rank Change YoY |
|---|---|---|---|
| 1 | 🇺🇸 New York | 119 | +1 |
| 2 | 🇬🇧 London | 97 | +3 |
| 3 | 🇮🇳 Mumbai | 92 | +4 |
| 4 | 🇨🇳 Beijing | 91 | -3 |
| 5 | 🇨🇳 Shanghai | 87 | -2 |
| 6 | 🇨🇳 Shenzhen | 84 | -2 |
| 7 | 🇭🇰 Hong Kong | 65 | -1 |
| 8 | 🇷🇺 Moscow | 59 | No Change |
| 9 | 🇮🇳 New Delhi | 57 | +6 |
| 10 | 🇺🇸 San Francisco | 52 | No Change |
| 11 | 🇹🇭 Bangkok | 49 | +2 |
| 12 | 🇹🇼 Taipei | 45 | +2 |
| 13 | 🇫🇷 Paris | 44 | -2 |
| 14 | 🇨🇳 Hangzhou | 43 | -5 |
| 15 | 🇸🇬 Singapore | 42 | New to Top 20 |
| 16 | 🇨🇳 Guangzhou | 39 | -4 |
| 17T | 🇮🇩 Jakarta | 37 | +1 |
| 17T | 🇧🇷 Sao Paulo | 37 | No Change |
| 19T | 🇺🇸 Los Angeles | 31 | No Change |
| 19T | 🇰🇷 Seoul | 31 | -3 |
In fact all Chinese cities on the top 20 list have lost billionaires between 2023–24. Consequently, they’ve all lost ranking spots as well, with Hangzhou seeing the biggest slide (-5) in the top 20.
Where China lost, all other Asian cities—except Seoul—in the top 20 have gained ranks. Indian cities lead the way, with New Delhi (+6) and Mumbai (+3) having climbed the most.
At a country level, China and the U.S combine to make up half of the cities in the top 20. They are also home to about half of the world’s 3,200 billionaire population.
In other news of note: Hurun officially counts Taylor Swift as a billionaire, estimating her net worth at $1.2 billion.

-

 Education1 week ago
How Hard Is It to Get Into an Ivy League School?
-

 Technology2 weeks ago
Ranked: Semiconductor Companies by Industry Revenue Share
-

 Markets2 weeks ago
Ranked: The World’s Top Flight Routes, by Revenue
-

 Demographics2 weeks ago
Population Projections: The World’s 6 Largest Countries in 2075
-

 Markets2 weeks ago
The Top 10 States by Real GDP Growth in 2023
-

 Demographics2 weeks ago
The Smallest Gender Wage Gaps in OECD Countries
-

 Economy2 weeks ago
Where U.S. Inflation Hit the Hardest in March 2024
-

 Green2 weeks ago
Top Countries By Forest Growth Since 2001