

A survey of 600 high net worth individuals revealed there’s one subset of people who are confident of making it in 2024.
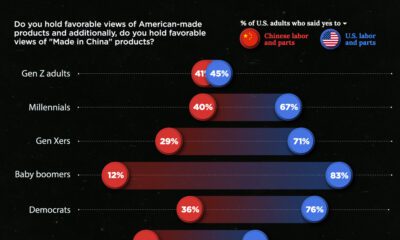

Around 70% of U.S. adults claim to prefer 'made in America' products. This chart breaks down the demographics of patriotic purchases.
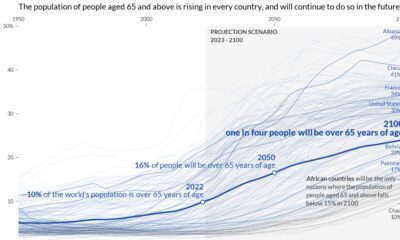

This graphic visualizes the world’s aging population, showing data for every country and territory around the world.
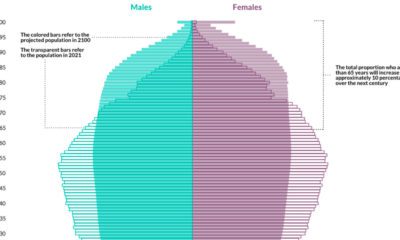

The EU's population is aging rapidly. By 2100, more than 30% of the region’s population is expected to be 65 or older.
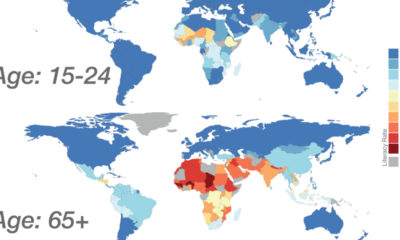

Global literacy mapped by generation, as well as a look at how the data on literacy has changed over time by country.


The pandemic has put the workforce through the wringer. This year-long survey highlights the four biggest back-to-work priorities and challenges that must be addressed.
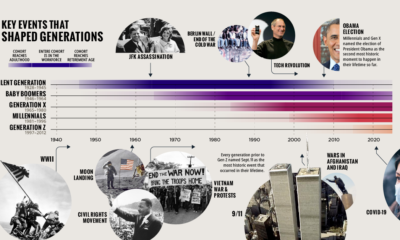

This timeline, from our Generational Power Index report, explores defining events in U.S. history that impacted each generation.
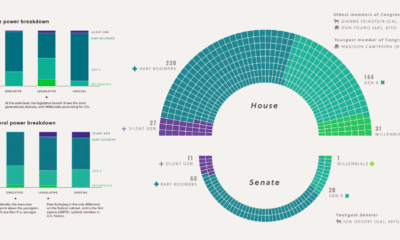

Visual Capitalist's inaugural Generational Power Index (GPI) examines the political power held by each generation and their influence on society.
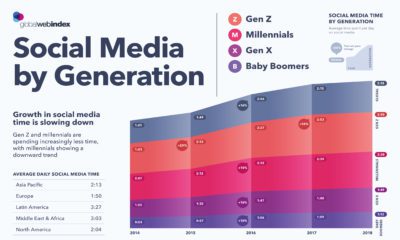

Every generation has the same desire for connection, but the way in which we connect over social media differs across age groups and regions.
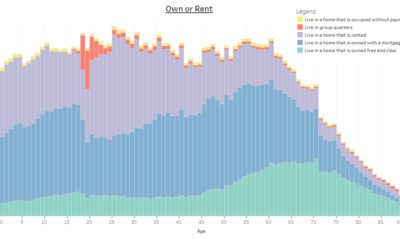

This interactive infographic allows you sort data on the U.S. population using a variety of topics, to see how Americans differ by age.


 Creator Program