Technology
Visualizing Social Media Use by Generation
Visualizing Social Media Use by Generation
Our world has never been more connected than it is today.
Nearly two-thirds of the world’s population is plugged into the matrix, with over 4.4 billion internet users across multiple device types. We use these devices for work and for play—and social media has altered the way we interact both online and offline.
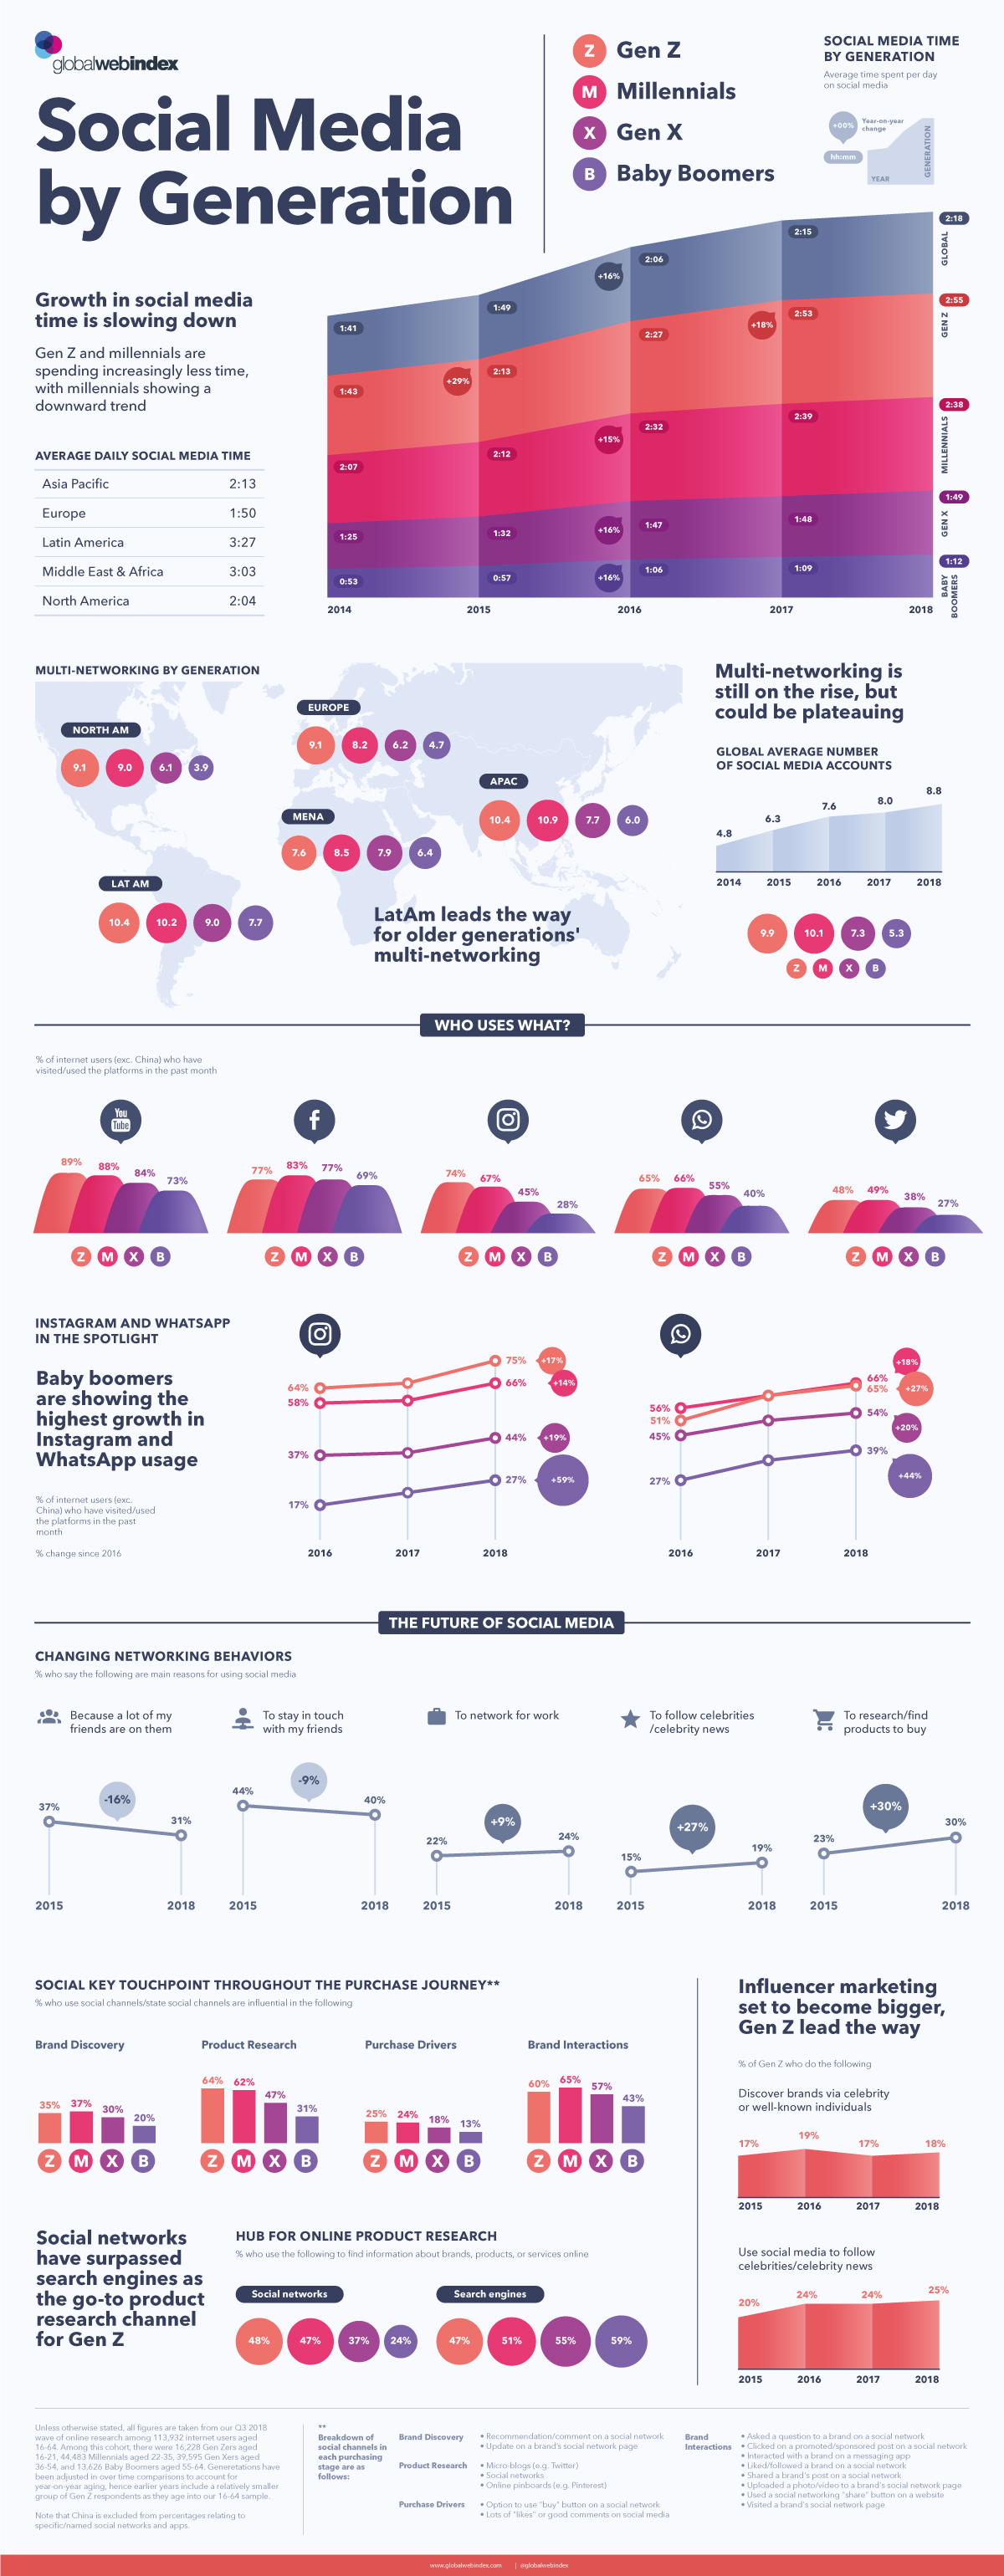
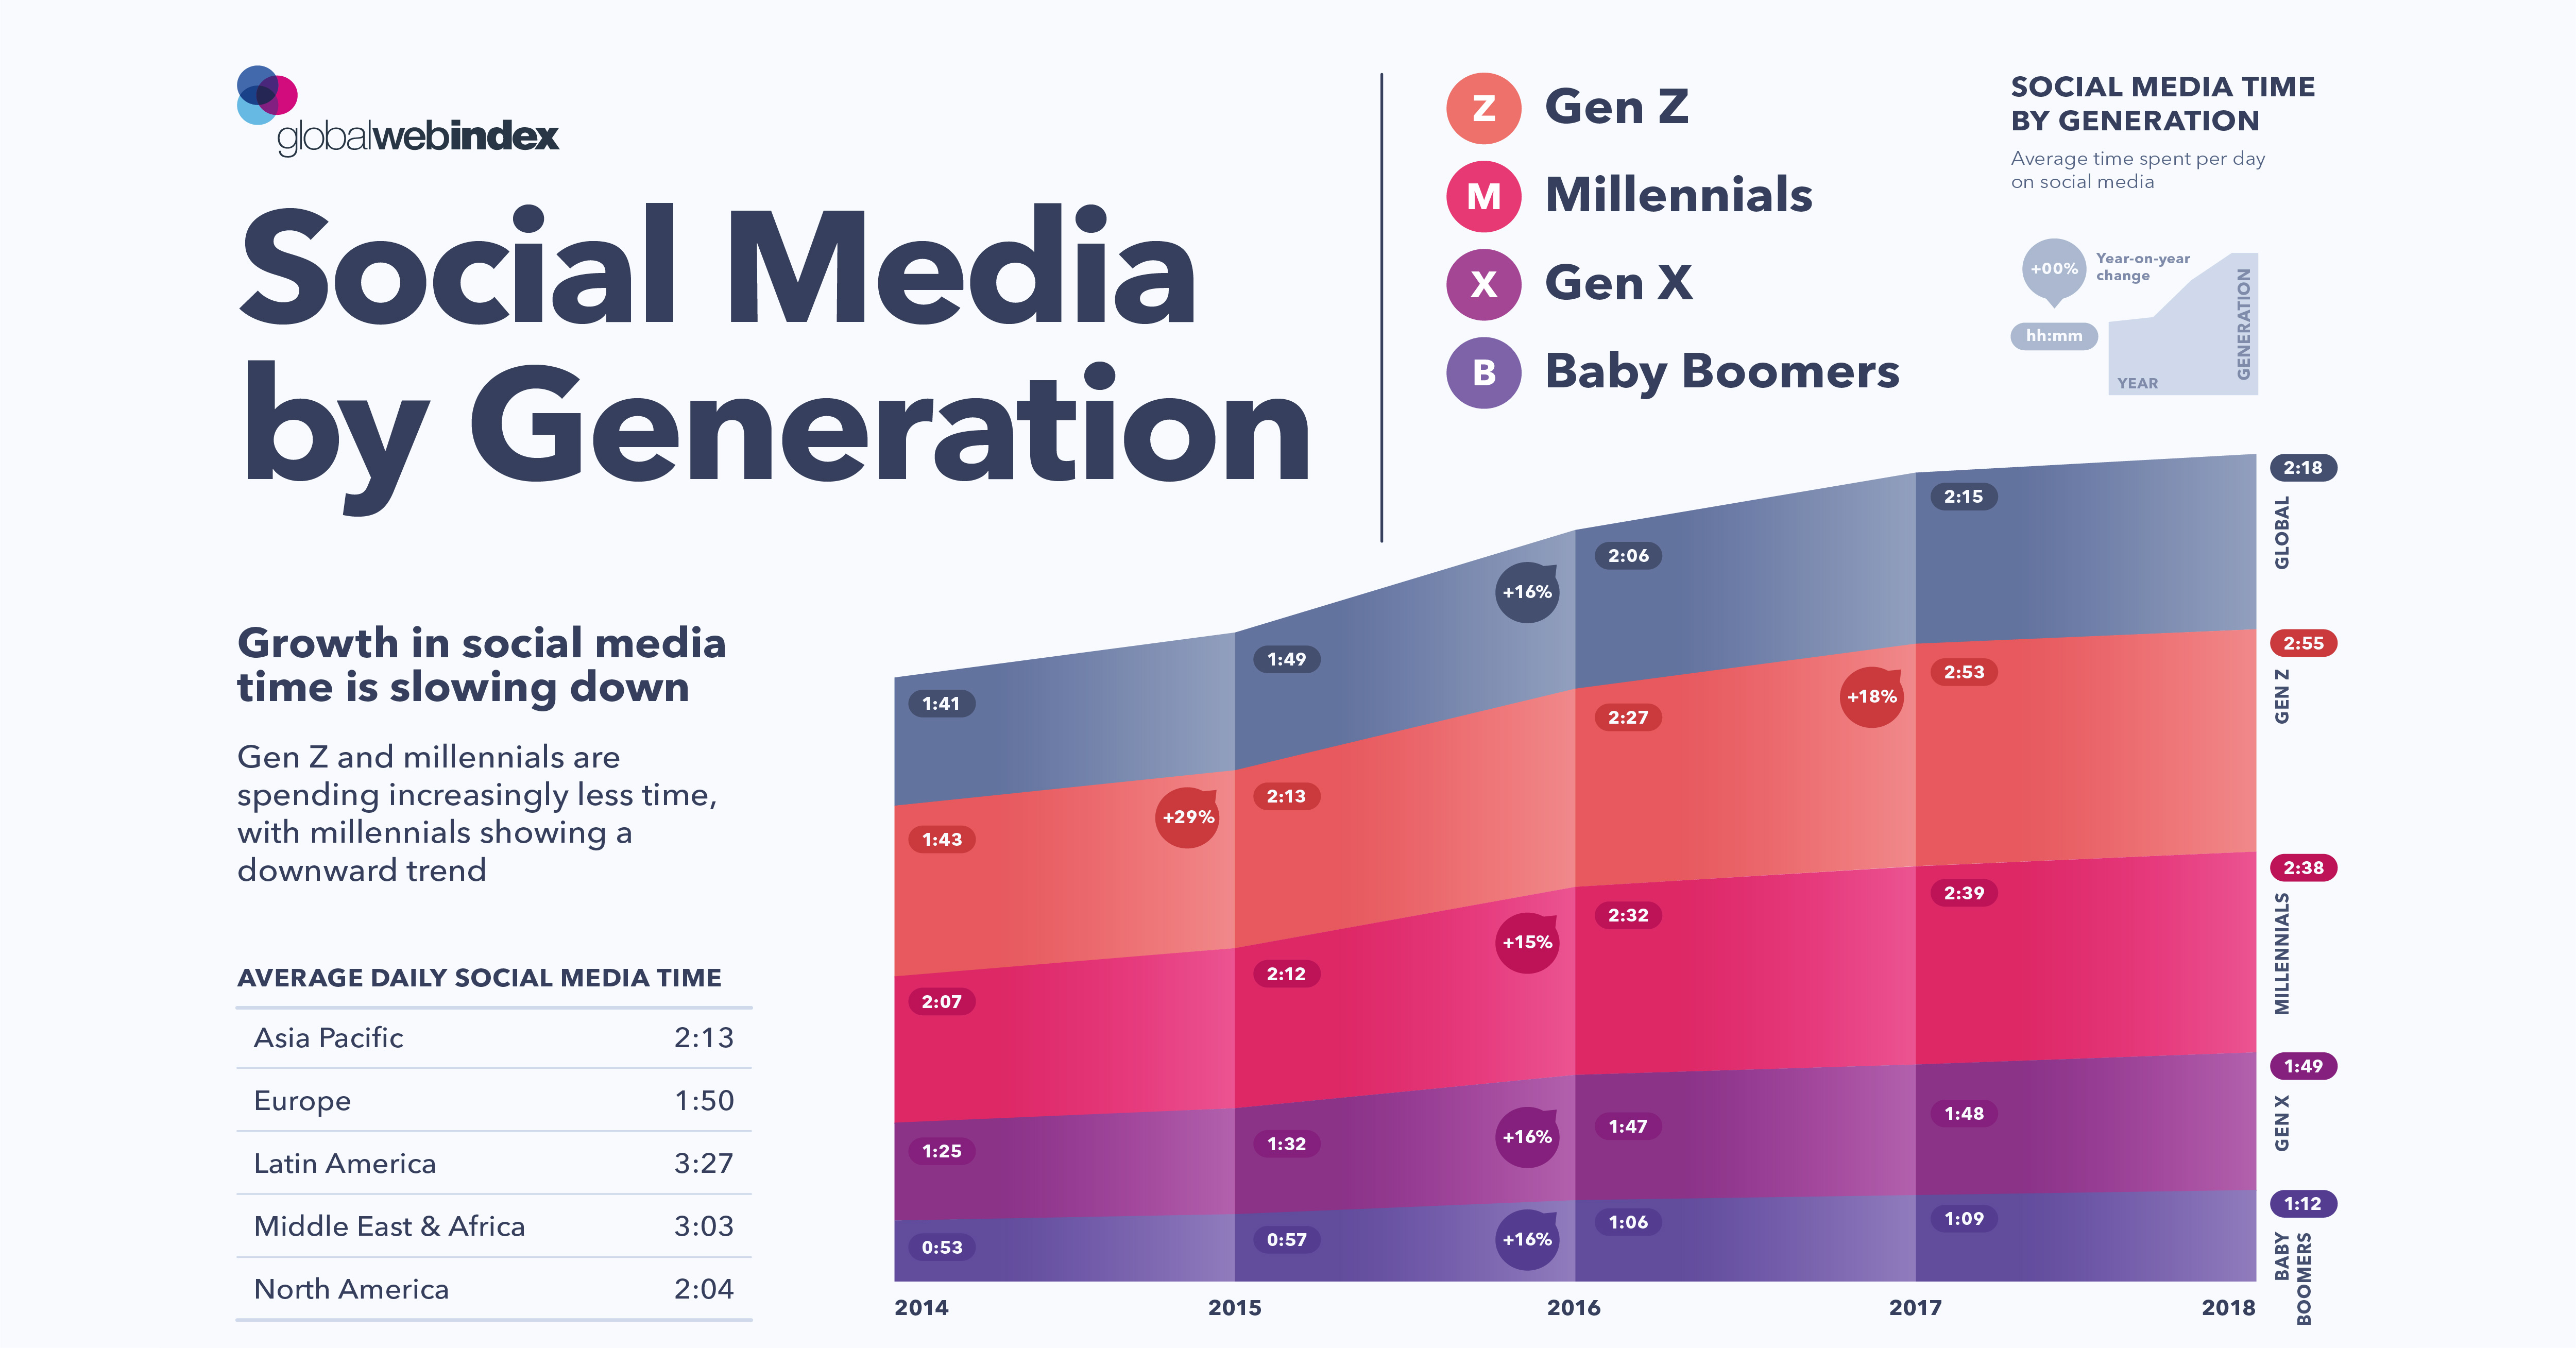
Today’s infographic from Global Web Index compares key generational and regional differences of social media use based on data from nearly 114,000 internet users, highlighting how pervasive social media has become in our lives.
Note: China is excluded from the usage data regarding specific social networks and apps.
From Age to Age: Social Media by Generation
How does the use of social media vary by generation?
Baby Boomers
Boomers currently rank last in nearly every category and metric when it comes to technology and social media use. This generation didn’t grow up inundated with technology in the way today’s youth are.
However, Boomers are showing the greatest increase in activity on social media platforms. For example, usage of Instagram and WhatsApp is up 59% and 44% respectively for this group since 2016, which is more than double the global average.
Generation X
Also known as the ‘MTV Generation’, the Gen X group was the last generation to grow up before the Internet truly took off. The early years of this group were marked by a burst of new technologies, from wireless phones to personal computers.
On average, Gen Xers spend nearly two hours on social media per day—less than Millennials and Gen Z, but more than Boomers.
Millennials
Perhaps surprisingly, Millennials show a slow down in the time spent on social media. From 2017-2018, screen time for Millennials on social media decreased by one minute, to 2 hours 38 minutes per day. This trend points to Millennials seeking real-life experiences and better engagement from the brands they interact with online, rather than passive scrolling.
Other factors also play a role in this evolution─nearly 50% of Millennials admit that their activity on social media has caused them to overspend to impress their networks.
Generation Z
Gen Z is the first group in history that has never known a world without the Internet. Immersed in the online world since birth, Gen Z surpasses Millennials in daily activity on social media with 2 hours 55 minutes spent per day.
North American, Latin American, and European Generation Z-ers lead in the number of social accounts they’re actively using. Many are also moving away from platforms like Facebook in favor of multimedia-heavy sites such as YouTube and Instagram.
Social Media by the Numbers
Social media sites measure the number of unique users on the platform each month as a metric of success. Below is a snapshot of the five major social media sites shown in today’s graphic and their active user count.
Monthly Active Users (MAU) as of July 2019
- Facebook: 2.4 billion
- YouTube: 2 billion
- WhatsApp: 1.6 billion
- Instagram: 1 billion
- Twitter: 330 million
Even more striking is what happens in a social media minute:
- 41.6 million messages sent over Facebook Messenger and WhatsApp
- 347,222 people are scrolling Instagram
- 87,500 people posting to Twitter
- 4.5 million videos on YouTube being watched
Social Media’s Role in Retail
Social media has evolved from simply keeping us connected to our friends. Users can now access career tools, engage with their favorite companies, stay current with global events, and find love.
Across all regions and generations, social media has propelled e-commerce into the limelight. More than ever before, social media sites are being used for product research, brand engagement, and online purchases. For example, Instagram now offers one-click shop features that allow users to buy what they see immediately, with a simple tap on their screens.
The greatest growth in e-commerce, however, has been the influencer industry. These star-studded internet personalities boast massive online followings from a wide range of demographics—and companies are taking notice.
In 2018, 72% of major brands stated that they were outsourcing a significant portion of their marketing resources to online influencers. Followers feel as though they’re getting a product recommendation from a friend, making them more likely to buy quickly.
Social Media Growth
Despite the rate of social media growth slowing down, social media use is still growing. From 2017 to 2018, the average person increased usage by three minutes per day, while becoming a new user of 0.8 social media accounts.
Social media is a broad, multi-faceted, and complex industry that appeals to a wide range of cultures, age groups, and personalities. While growth in social media activity may be slowing down, a growing global population may mean we’ll see more opportunities to stay connected.


Technology
Ranked: Semiconductor Companies by Industry Revenue Share
Nvidia is coming for Intel’s crown. Samsung is losing ground. AI is transforming the space. We break down revenue for semiconductor companies.


Semiconductor Companies by Industry Revenue Share
This was originally posted on our Voronoi app. Download the app for free on Apple or Android and discover incredible data-driven charts from a variety of trusted sources.
Did you know that some computer chips are now retailing for the price of a new BMW?
As computers invade nearly every sphere of life, so too have the chips that power them, raising the revenues of the businesses dedicated to designing them.
But how did various chipmakers measure against each other last year?
We rank the biggest semiconductor companies by their percentage share of the industry’s revenues in 2023, using data from Omdia research.
Which Chip Company Made the Most Money in 2023?
Market leader and industry-defining veteran Intel still holds the crown for the most revenue in the sector, crossing $50 billion in 2023, or 10% of the broader industry’s topline.
All is not well at Intel, however, with the company’s stock price down over 20% year-to-date after it revealed billion-dollar losses in its foundry business.
| Rank | Company | 2023 Revenue | % of Industry Revenue |
|---|---|---|---|
| 1 | Intel | $51B | 9.4% |
| 2 | NVIDIA | $49B | 9.0% |
| 3 | Samsung Electronics | $44B | 8.1% |
| 4 | Qualcomm | $31B | 5.7% |
| 5 | Broadcom | $28B | 5.2% |
| 6 | SK Hynix | $24B | 4.4% |
| 7 | AMD | $22B | 4.1% |
| 8 | Apple | $19B | 3.4% |
| 9 | Infineon Tech | $17B | 3.2% |
| 10 | STMicroelectronics | $17B | 3.2% |
| 11 | Texas Instruments | $17B | 3.1% |
| 12 | Micron Technology | $16B | 2.9% |
| 13 | MediaTek | $14B | 2.6% |
| 14 | NXP | $13B | 2.4% |
| 15 | Analog Devices | $12B | 2.2% |
| 16 | Renesas Electronics Corporation | $11B | 1.9% |
| 17 | Sony Semiconductor Solutions Corporation | $10B | 1.9% |
| 18 | Microchip Technology | $8B | 1.5% |
| 19 | Onsemi | $8B | 1.4% |
| 20 | KIOXIA Corporation | $7B | 1.3% |
| N/A | Others | $126B | 23.2% |
| N/A | Total | $545B | 100% |
Note: Figures are rounded. Totals and percentages may not sum to 100.
Meanwhile, Nvidia is very close to overtaking Intel, after declaring $49 billion of topline revenue for 2023. This is more than double its 2022 revenue ($21 billion), increasing its share of industry revenues to 9%.
Nvidia’s meteoric rise has gotten a huge thumbs-up from investors. It became a trillion dollar stock last year, and broke the single-day gain record for market capitalization this year.
Other chipmakers haven’t been as successful. Out of the top 20 semiconductor companies by revenue, 12 did not match their 2022 revenues, including big names like Intel, Samsung, and AMD.
The Many Different Types of Chipmakers
All of these companies may belong to the same industry, but they don’t focus on the same niche.
According to Investopedia, there are four major types of chips, depending on their functionality: microprocessors, memory chips, standard chips, and complex systems on a chip.
Nvidia’s core business was once GPUs for computers (graphics processing units), but in recent years this has drastically shifted towards microprocessors for analytics and AI.
These specialized chips seem to be where the majority of growth is occurring within the sector. For example, companies that are largely in the memory segment—Samsung, SK Hynix, and Micron Technology—saw peak revenues in the mid-2010s.

-

 Maps2 weeks ago
Mapped: Average Wages Across Europe
-

 Money1 week ago
Which States Have the Highest Minimum Wage in America?
-

 Real Estate1 week ago
Ranked: The Most Valuable Housing Markets in America
-

 Markets1 week ago
Charted: Big Four Market Share by S&P 500 Audits
-

 AI1 week ago
The Stock Performance of U.S. Chipmakers So Far in 2024
-

 Automotive2 weeks ago
Almost Every EV Stock is Down After Q1 2024
-

 Money2 weeks ago
Where Does One U.S. Tax Dollar Go?
-

 Green2 weeks ago
Ranked: Top Countries by Total Forest Loss Since 2001