Politics
Which Generation Has the Most Influence Over U.S. Politics?

Introducing our new index, which ranks U.S. generations on their economic, political, and cultural influence.


Measuring Influence in U.S. Politics, by Generation
Generations are a widely recognized and discussed concept, and it’s assumed people all understand what they refer to. But the true extent of each generation’s clout has remained undetermined—until now.
In our inaugural Generational Power Index (GPI) 2021, we examine the power and influence each generation currently holds on American society, and its potential to evolve in the future.
Political power by generation was one of three key categories we used to quantify the current landscape. Before we dive into the results, here’s how the Political Power category was calculated.
Measuring Generational Power
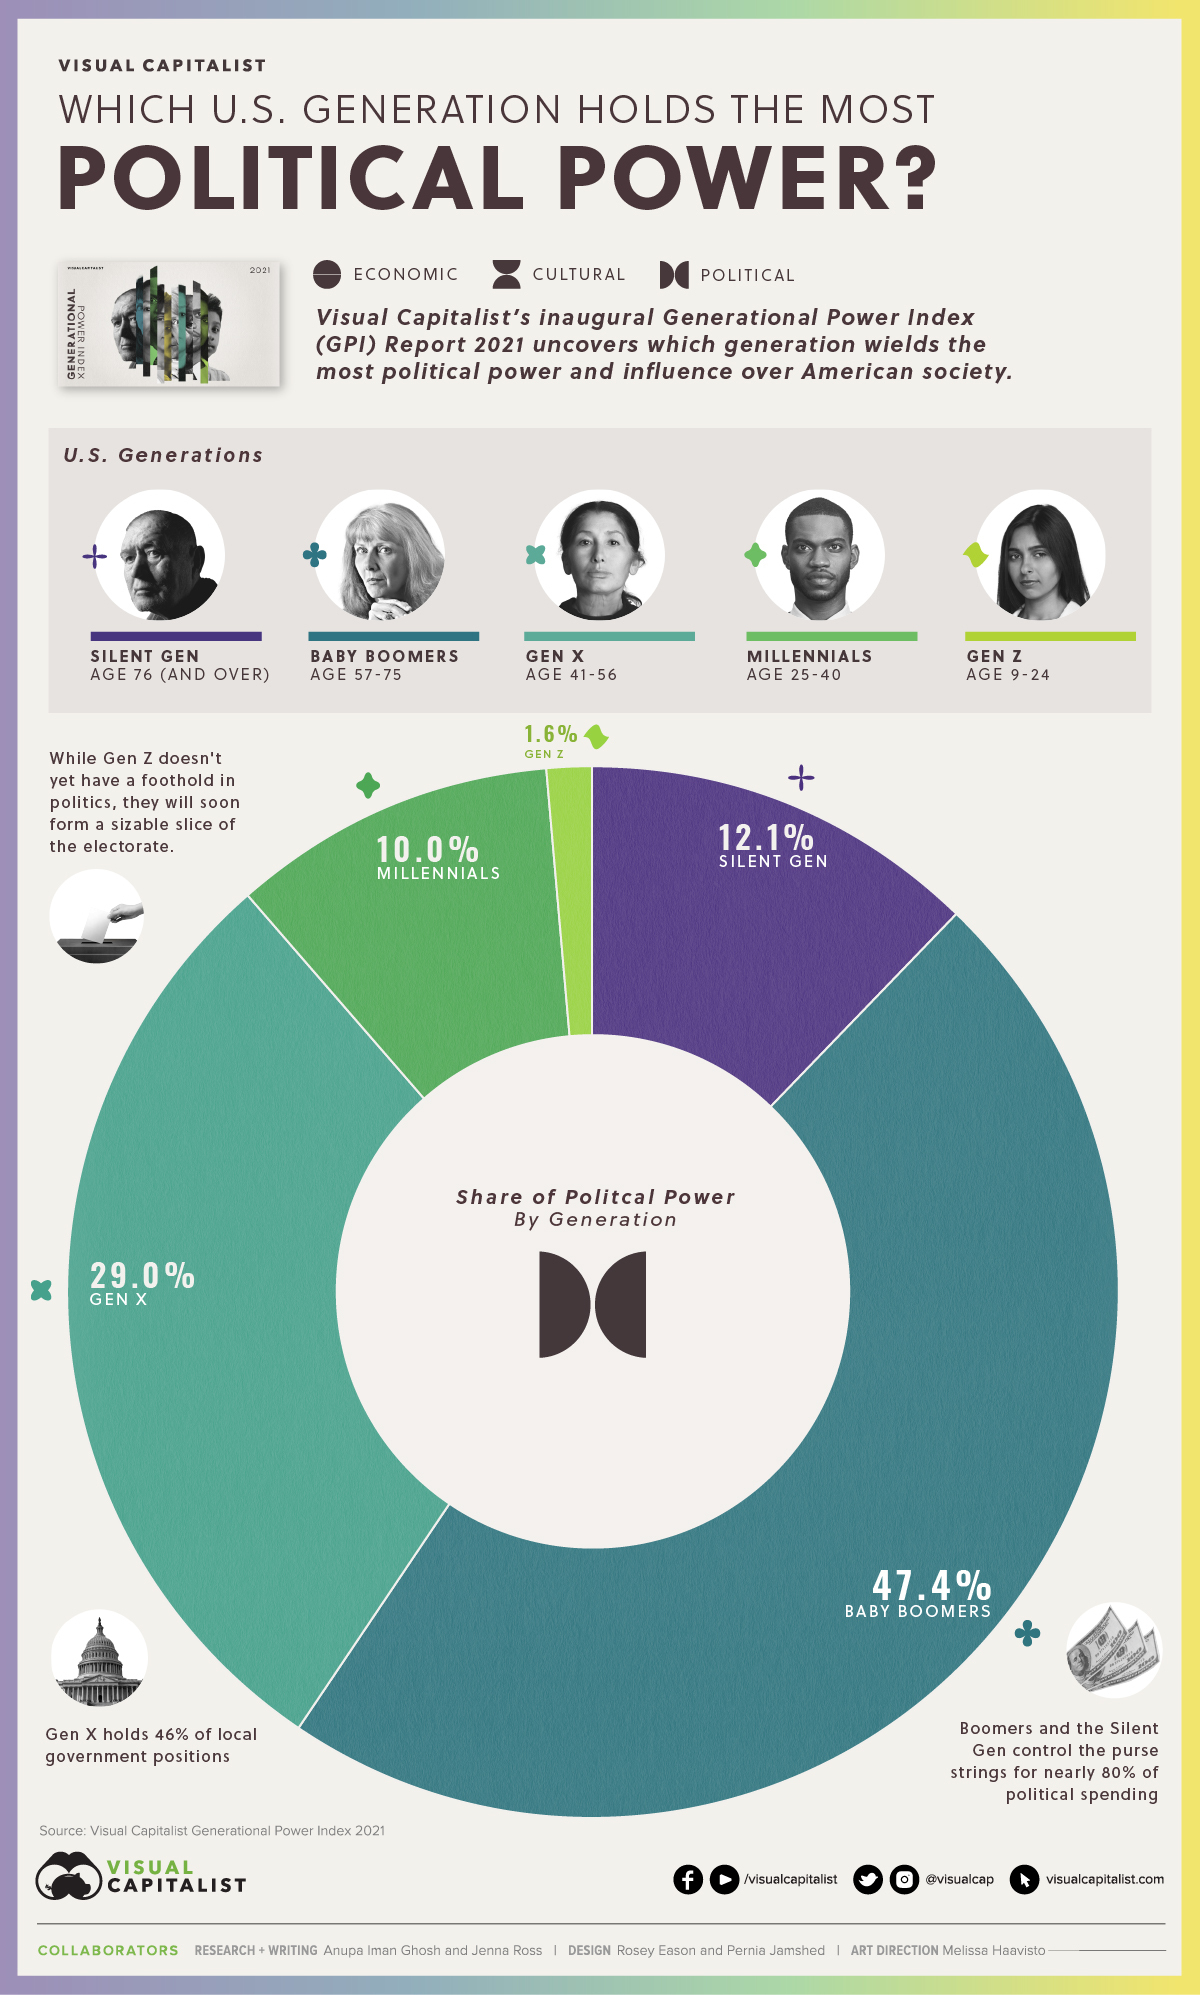
To begin with, here’s how we categorized each generation:
| Generation | Age range (years) | Birth year range |
|---|---|---|
| The Silent Generation | 76 and over | 1928-1945 |
| Baby Boomers | 57-75 | 1946-1964 |
| Gen X | 41-56 | 1965-1980 |
| Millennials | 25-40 | 1981-1996 |
| Gen Z | 9-24 | 1997-2012 |
| Gen Alpha | 8 and below | 2013-present |
Using these age groups as a framework, we then calculated the Political Power category using these distinct equally-weighted variables:
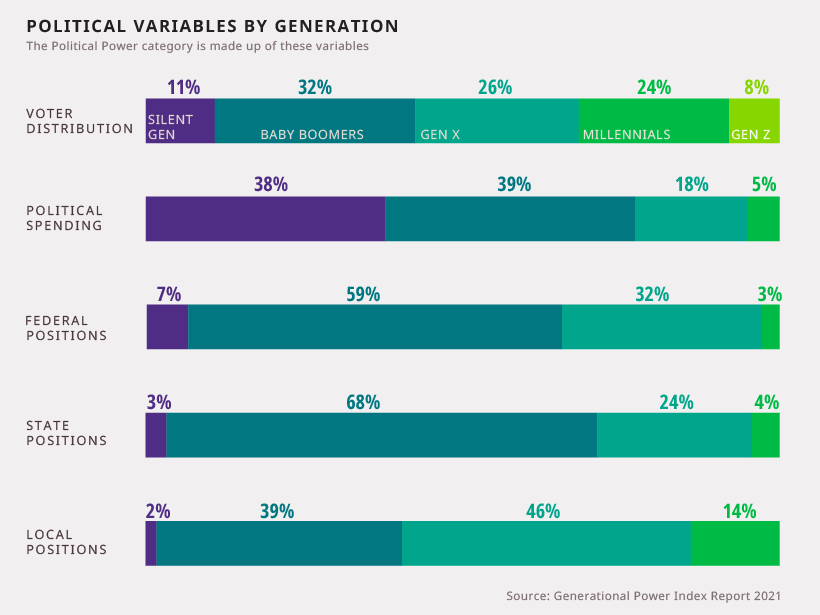
With this methodology in mind, here’s how the Political Power category shakes out, using insights from the GPI.
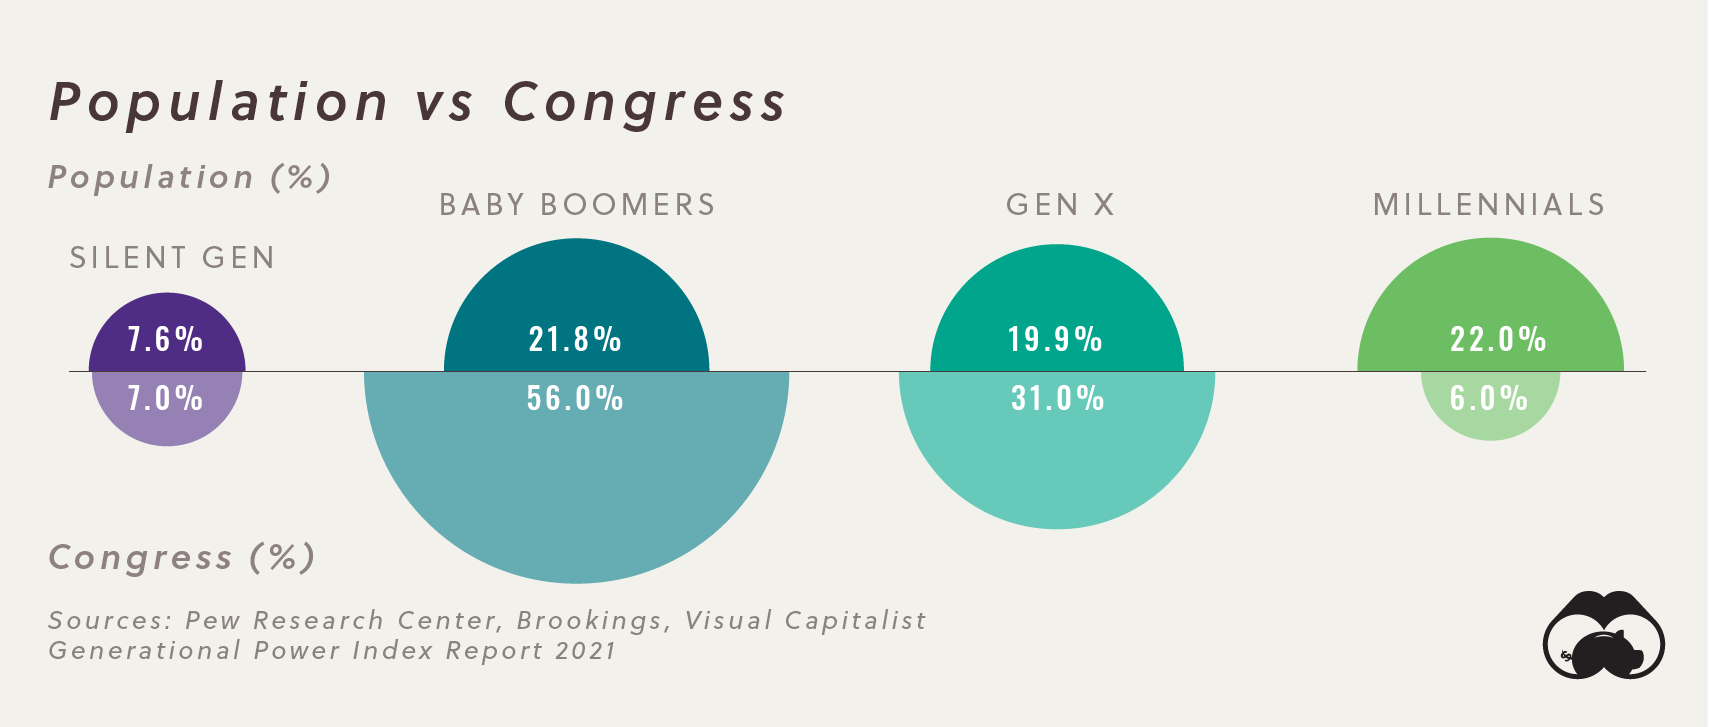
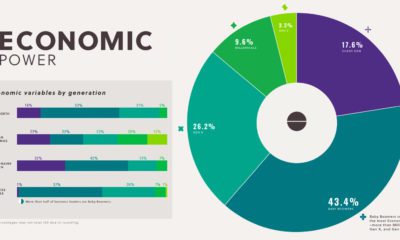
Share of Political Power by Generation
Baby Boomers dominated with over 47% of the total political power by generation. This cohort has particular strength in the judicial system and in Congress.
| Generation | Political Power Share |
|---|---|
| Baby Boomers | 47.4% |
| Gen X | 29.0% |
| Millennials | 10.0% |
| Silent | 12.1% |
| Gen Z | 1.6% |
Baby Boomers, along with the Silent Generation also control 80% of political spending. Meanwhile, Gen X accounts for nearly half (46%) of local government positions.
Both voters and politicians play key roles in shaping American society. Thus, two variables worth looking closer at are the evolving electoral base and the composition of Congress.
The Changing Face of the U.S. Voter
Younger generations have very different perceptions on everything from cannabis to climate change. This is starting to be reflected in legislation.
2016 was a watershed moment for politicians vying for the vote—it was the last election in which Baby Boomers made up over a third of U.S. voters. Collectively, Boomers’ voting power will decline from here on out.
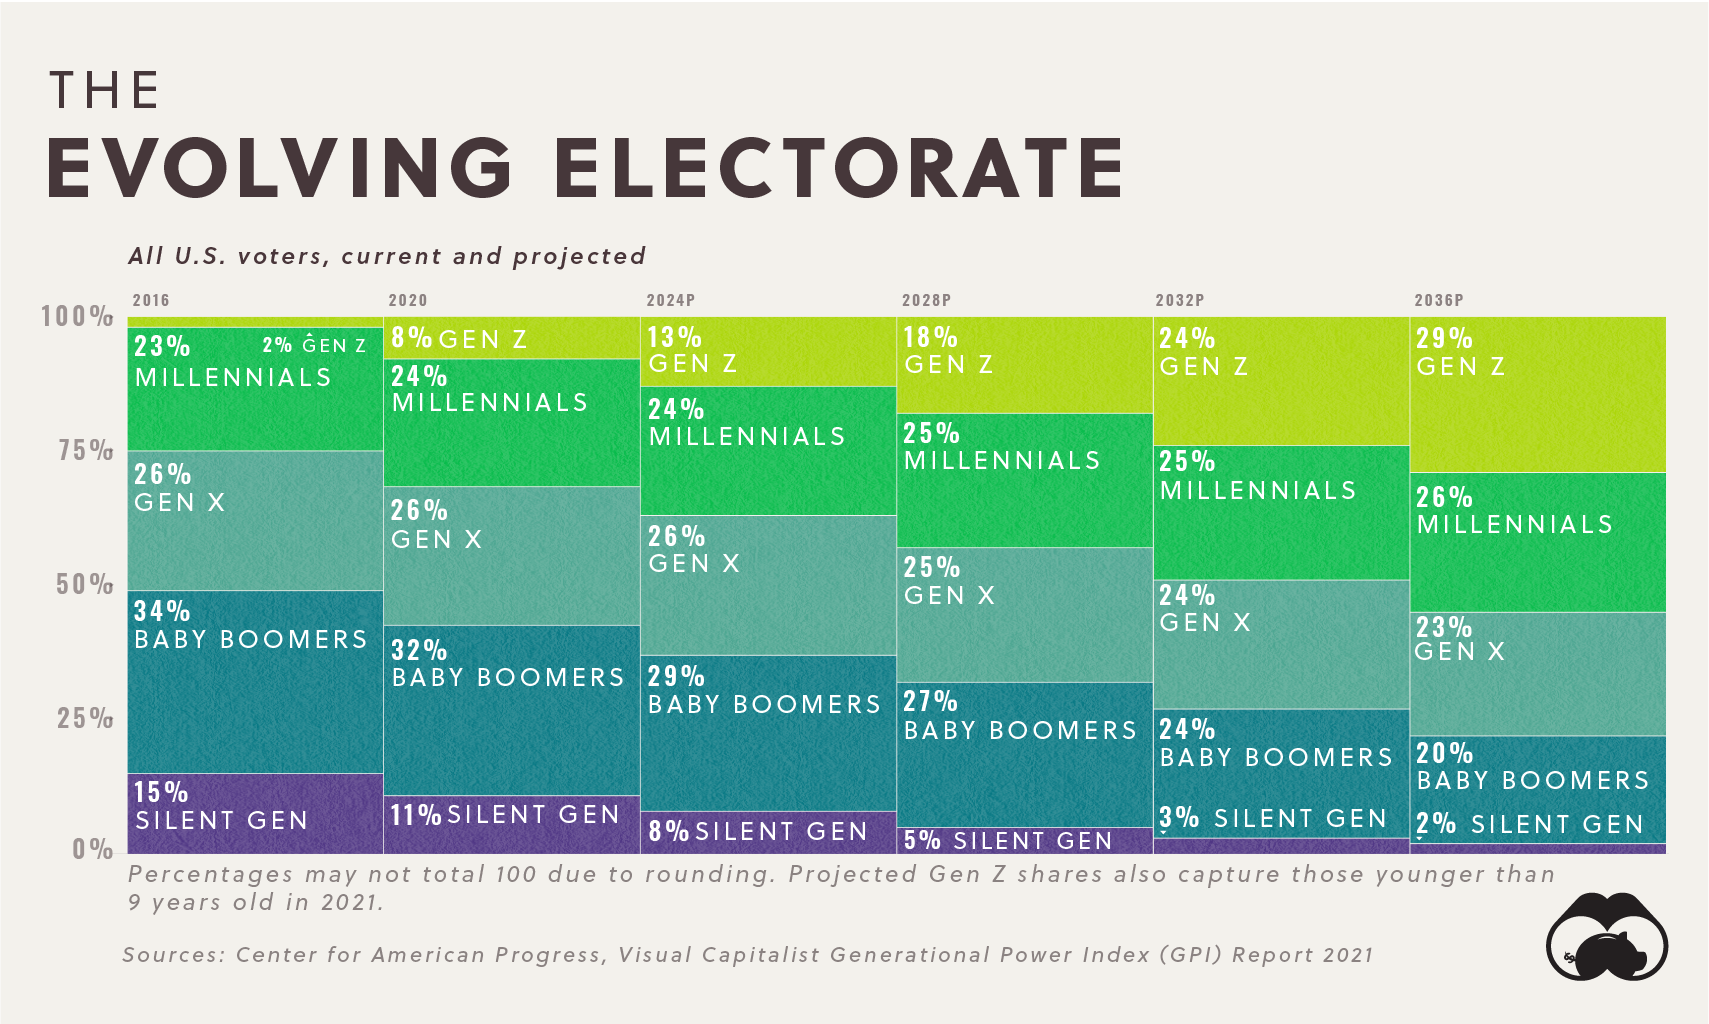
Within the next two decades, the combined voting power of Millennials and Gen Z will skyrocket from 32% in 2020 up to 55% by 2036.
Meanwhile, a decade from now, the oldest members of Gen Alpha (those born in 2013 and later) will enter the playing field and become eligible to vote in 2031.
The View from the Top
Having examined generational power in the electorate, we now turn our attention to the people on the other side of the democratic equation—the politicians.
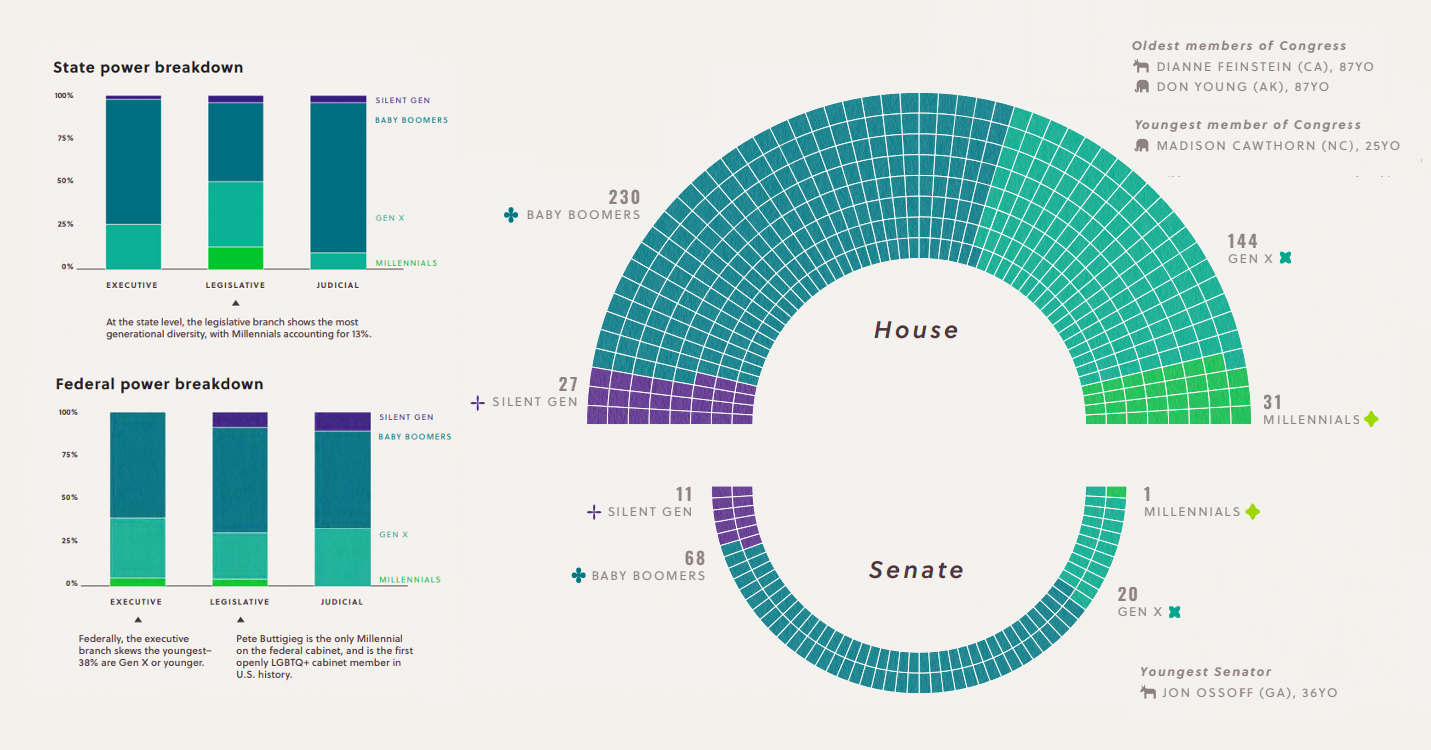
In most cases, it takes many decades of experience and reputation building to reach the highest offices in the land. That’s why the median age of Congress (61.2) is much higher than the median age of the U.S. population at large (38.1).
At this point in time, Baby Boomers are in the sweet spot, and it shows in the numbers. Boomers represent 298 of 532 Congressional seats (56% of all seats), and Gen X’s growing contingent of members represents 31%.
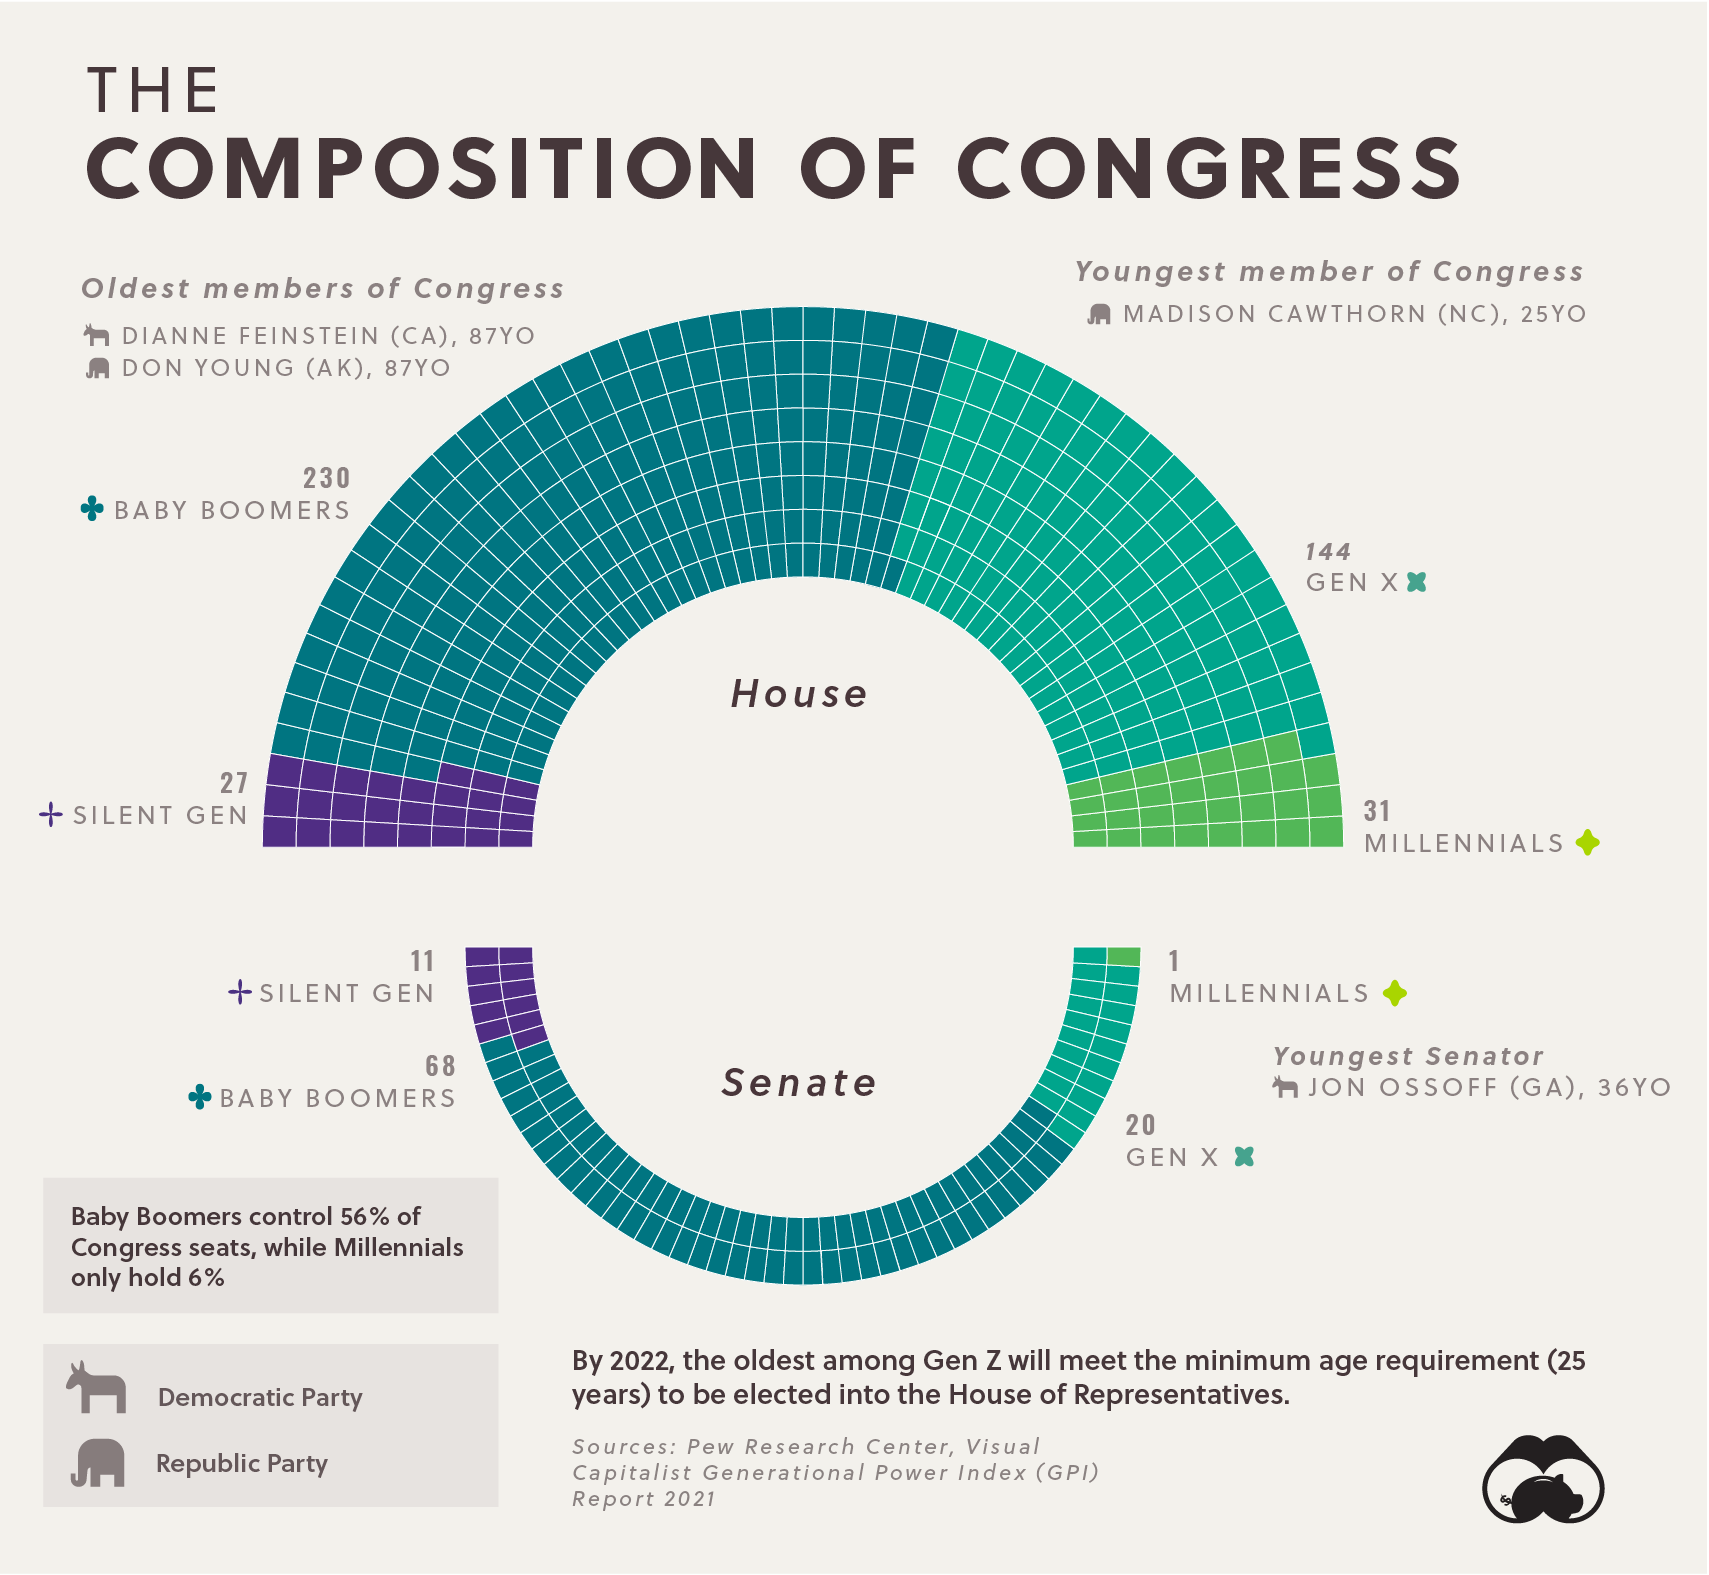
On one end of the spectrum, the Silent Generation still occupies 7% of seats, which roughly reflects the group’s share of the U.S. population. California’s Democratic Senator Dianne Feinstein and Republican Don Young are both 87 years old, the latter having represented Alaska for 25 terms.
On the other end of the spectrum, Millennials currently claim 32 seats, just 6% of the total. As of 2021, this entire cohort now meets the minimum age requirement (25) to serve in the House of Representatives. The youngest member of Congress is Republican Madison Cawthorn, a representative for North Carolina at just 25 years old. Meanwhile, Senator Jon Ossoff is the youngest Senator in the country, serving Georgia at 36 years old.
This difference in political power by generation is stark considering that both Boomers and Millennials both make up similar proportions of the U.S. population at large. In that sense, Millennials are greatly underrepresented in Congress compared to Boomers.
Gen Z Waiting Patiently in the Wings
Gen Z’s current age range is a natural reason why they don’t yet have a foothold in government. But by 2022, the oldest members of Gen Z will turn 25, meeting the minimum age requirement to get elected into the House of Representatives.
With the oldest members of this generation soon turning 25, how long will it be before a representative from Gen Z occupies a seat in the Capitol Building?
Download the Generational Power Report (.pdf)


Economy
The Bloc Effect: International Trade with Geopolitical Allies on the Rise
Rising geopolitical tensions are shaping the future of international trade, but what is the effect on trading among G7 and BRICS countries?


The Bloc Effect: International Trade with Allies on the Rise
International trade has become increasingly fragmented over the last five years as countries have shifted to trading more with their geopolitical allies.
This graphic from The Hinrich Foundation, the first in a three-part series covering the future of trade, provides visual context to the growing divide in trade in G7 and pre-expansion BRICS countries, which are used as proxies for geopolitical blocs.
Trade Shifts in G7 and BRICS Countries
This analysis uses IMF data to examine differences in shares of exports within and between trading blocs from 2018 to 2023. For example, we looked at the percentage of China’s exports with other BRICS members as well as with G7 members to see how these proportions shifted in percentage points (pp) over time.
Countries traded nearly $270 billion more with allies in 2023 compared to 2018. This shift came at the expense of trade with rival blocs, which saw a decline of $314 billion.
Country Change in Exports Within Bloc (pp) Change in Exports With Other Bloc (pp)
🇮🇳 India 0.0 3.9
🇷🇺 Russia 0.7 -3.8
🇮🇹 Italy 0.8 -0.7
🇨🇦 Canada 0.9 -0.7
🇫🇷 France 1.0 -1.1
🇪🇺 EU 1.1 -1.5
🇩🇪 Germany 1.4 -2.1
🇿🇦 South Africa 1.5 1.5
🇺🇸 U.S. 1.6 -0.4
🇯🇵 Japan 2.0 -1.7
🇨🇳 China 2.1 -5.2
🇧🇷 Brazil 3.7 -3.3
🇬🇧 UK 10.2 0.5
All shifts reported are in percentage points. For example, the EU saw its share of exports to G7 countries rise from 74.3% in 2018 to 75.4% in 2023, which equates to a 1.1 percentage point increase.
The UK saw the largest uptick in trading with other countries within the G7 (+10.2 percentage points), namely the EU, as the post-Brexit trade slump to the region recovered.
Meanwhile, the U.S.-China trade dispute caused China’s share of exports to the G7 to fall by 5.2 percentage points from 2018 to 2023, the largest decline in our sample set. In fact, partly as a result of the conflict, the U.S. has by far the highest number of harmful tariffs in place.
The Russia-Ukraine War and ensuing sanctions by the West contributed to Russia’s share of exports to the G7 falling by 3.8 percentage points over the same timeframe.
India, South Africa, and the UK bucked the trend and continued to witness advances in exports with the opposing bloc.
Average Trade Shifts of G7 and BRICS Blocs
Though results varied significantly on a country-by-country basis, the broader trend towards favoring geopolitical allies in international trade is clear.
Bloc Change in Exports Within Bloc (pp) Change in Exports With Other Bloc (pp)
Average 2.1 -1.1
BRICS 1.6 -1.4
G7 incl. EU 2.4 -1.0
Overall, BRICS countries saw a larger shift away from exports with the other bloc, while for G7 countries the shift within their own bloc was more pronounced. This implies that though BRICS countries are trading less with the G7, they are relying more on trade partners outside their bloc to make up for the lost G7 share.
A Global Shift in International Trade and Geopolitical Proximity
The movement towards strengthening trade relations based on geopolitical proximity is a global trend.
The United Nations categorizes countries along a scale of geopolitical proximity based on UN voting records.
According to the organization’s analysis, international trade between geopolitically close countries rose from the first quarter of 2022 (when Russia first invaded Ukraine) to the third quarter of 2023 by over 6%. Conversely, trade with geopolitically distant countries declined.
The second piece in this series will explore China’s gradual move away from using the U.S. dollar in trade settlements.
Visit the Hinrich Foundation to learn more about the future of geopolitical trade

-

 Misc4 hours ago
Visualizing the Most Common Pets in the U.S.
Lions, tigers, and bears, oh my!—these animals do not feature on this list of popular American household pets.
-

 Economy3 days ago
Economic Growth Forecasts for G7 and BRICS Countries in 2024
The IMF has released its economic growth forecasts for 2024. How do the G7 and BRICS countries compare?
-

 United States2 weeks ago
Ranked: The Largest U.S. Corporations by Number of Employees
We visualized the top U.S. companies by employees, revealing the massive scale of retailers like Walmart, Target, and Home Depot.
-

 Economy2 weeks ago
Where U.S. Inflation Hit the Hardest in March 2024
We visualized product categories that saw the highest % increase in price due to U.S. inflation as of March 2024.
-

 Economy1 month ago
G20 Inflation Rates: Feb 2024 vs COVID Peak
We visualize inflation rates across G20 countries as of Feb 2024, in the context of their COVID-19 pandemic peak.
-

 Economy1 month ago
Mapped: Unemployment Claims by State
This visual heatmap of unemployment claims by state highlights New York, California, and Alaska leading the country by a wide margin.


-

 Science1 week ago
Visualizing the Average Lifespans of Mammals
-

 Markets2 weeks ago
The Top 10 States by Real GDP Growth in 2023
-

 Demographics2 weeks ago
The Smallest Gender Wage Gaps in OECD Countries
-
Economy2 weeks ago
Where U.S. Inflation Hit the Hardest in March 2024
-

 Green2 weeks ago
Top Countries By Forest Growth Since 2001
-
United States2 weeks ago
Ranked: The Largest U.S. Corporations by Number of Employees
-

 Maps2 weeks ago
The Largest Earthquakes in the New York Area (1970-2024)
-

 Green2 weeks ago
Ranked: The Countries With the Most Air Pollution in 2023