Politics
Charted: The Richest Politicians in the U.S.

Charted: The Richest Politicians in the U.S.
Entering politics doesn’t require a specific income, yet many politicians are multimillionaires.
At some of the highest echelons of U.S. politics are federal and state-level politicians worth hundreds of millions of dollars, if not billions. Who is the wealthiest U.S. politician today?
This graphic visualizes the net worth of America’s 12 richest politicians, using consolidated data as of June 2023 from GoBankingRates.
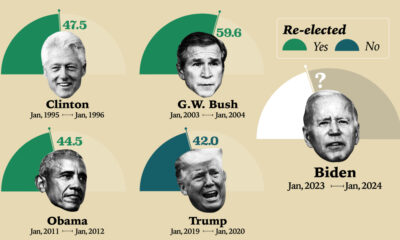
Which Politician is Richer Than Donald Trump?
The list of richest politicians in the U.S. includes three billionaires, with the most famous being former U.S. President Donald Trump.
His wealth is closely tied to The Trump Organization, which has interests in real estate, hotels, casinos, and media. But Trump is not the wealthiest U.S. politician by most estimtates.
At the top is the Governor of Illinois Jay Robert Pritzker. A longtime financial supporter of the Democratic Party, he is a member of the wealthy Pritzker family, which owns Hyatt Hotels & Resorts.
| Politician | Title | Party Affiliation | Net Worth |
|---|---|---|---|
| J.B. Pritzker | Governor of Illinois | Democrat | $3.4B |
| Donald Trump | 45th President | Republican | $2B |
| Doug Burgum | Governor of North Dakota | Republican | $1.1B |
| Darrell Issa | Representative (CA 48th District) | Republican | $460M |
| Jim Justice | Governor of West Virginia | Republican | $450M |
| Jared Polis | Governor of Colorado | Democrat | $400M |
| Glenn Youngkin | Governor of Virginia | Republican | $400M |
| Mitt Romney | Senator, Utah | Republican | $300M |
| Rick Scott | Senator, Florida | Republican | $300M |
| Mark Warner | Senator, Virginia | Democrat | $215M |
| Scott Peters | Representative (CA 50th District) | Democrat | $200M |
| Michael McCaul | Representative (TX 10th District) | Republican | $200M |
Completing the billionaires list is North Dakota’s Governor Doug Burgum. In 2001, Burgum sold the accounting software company Great Plains Software to Microsoft for $1.1 billion and later founded several investment firms.
The wealthiest serving member of Congress is Republican Rep. Darrell Issa from California. Issa served as the CEO of Directed Electronics, which he co-founded in 1982. It is one of the largest makers of automobile aftermarket security and convenience products in the United States.
At the bottom of the list is Texas Rep. Michael McCaul. Before being elected to Congress in 2005, the Republican served as Chief of Counter-Terrorism and National Security in the U.S. Attorney’s office, and led the Joint Terrorism Task Force.


Economy
The Bloc Effect: International Trade with Geopolitical Allies on the Rise
Rising geopolitical tensions are shaping the future of international trade, but what is the effect on trading among G7 and BRICS countries?


The Bloc Effect: International Trade with Allies on the Rise
International trade has become increasingly fragmented over the last five years as countries have shifted to trading more with their geopolitical allies.
This graphic from The Hinrich Foundation, the first in a three-part series covering the future of trade, provides visual context to the growing divide in trade in G7 and pre-expansion BRICS countries, which are used as proxies for geopolitical blocs.
Trade Shifts in G7 and BRICS Countries
This analysis uses IMF data to examine differences in shares of exports within and between trading blocs from 2018 to 2023. For example, we looked at the percentage of China’s exports with other BRICS members as well as with G7 members to see how these proportions shifted in percentage points (pp) over time.
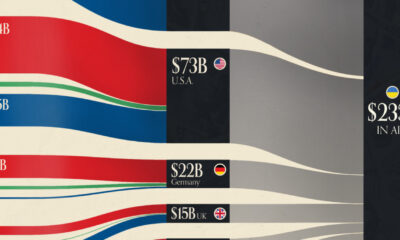
Countries traded nearly $270 billion more with allies in 2023 compared to 2018. This shift came at the expense of trade with rival blocs, which saw a decline of $314 billion.
Country Change in Exports Within Bloc (pp) Change in Exports With Other Bloc (pp)
🇮🇳 India 0.0 3.9
🇷🇺 Russia 0.7 -3.8
🇮🇹 Italy 0.8 -0.7
🇨🇦 Canada 0.9 -0.7
🇫🇷 France 1.0 -1.1
🇪🇺 EU 1.1 -1.5
🇩🇪 Germany 1.4 -2.1
🇿🇦 South Africa 1.5 1.5
🇺🇸 U.S. 1.6 -0.4
🇯🇵 Japan 2.0 -1.7
🇨🇳 China 2.1 -5.2
🇧🇷 Brazil 3.7 -3.3
🇬🇧 UK 10.2 0.5
All shifts reported are in percentage points. For example, the EU saw its share of exports to G7 countries rise from 74.3% in 2018 to 75.4% in 2023, which equates to a 1.1 percentage point increase.
The UK saw the largest uptick in trading with other countries within the G7 (+10.2 percentage points), namely the EU, as the post-Brexit trade slump to the region recovered.
Meanwhile, the U.S.-China trade dispute caused China’s share of exports to the G7 to fall by 5.2 percentage points from 2018 to 2023, the largest decline in our sample set. In fact, partly as a result of the conflict, the U.S. has by far the highest number of harmful tariffs in place.
The Russia-Ukraine War and ensuing sanctions by the West contributed to Russia’s share of exports to the G7 falling by 3.8 percentage points over the same timeframe.
India, South Africa, and the UK bucked the trend and continued to witness advances in exports with the opposing bloc.
Average Trade Shifts of G7 and BRICS Blocs
Though results varied significantly on a country-by-country basis, the broader trend towards favoring geopolitical allies in international trade is clear.
Bloc Change in Exports Within Bloc (pp) Change in Exports With Other Bloc (pp)
Average 2.1 -1.1
BRICS 1.6 -1.4
G7 incl. EU 2.4 -1.0
Overall, BRICS countries saw a larger shift away from exports with the other bloc, while for G7 countries the shift within their own bloc was more pronounced. This implies that though BRICS countries are trading less with the G7, they are relying more on trade partners outside their bloc to make up for the lost G7 share.
A Global Shift in International Trade and Geopolitical Proximity
The movement towards strengthening trade relations based on geopolitical proximity is a global trend.
The United Nations categorizes countries along a scale of geopolitical proximity based on UN voting records.
According to the organization’s analysis, international trade between geopolitically close countries rose from the first quarter of 2022 (when Russia first invaded Ukraine) to the third quarter of 2023 by over 6%. Conversely, trade with geopolitically distant countries declined.
The second piece in this series will explore China’s gradual move away from using the U.S. dollar in trade settlements.
Visit the Hinrich Foundation to learn more about the future of geopolitical trade

-

 Economy3 days ago
Economic Growth Forecasts for G7 and BRICS Countries in 2024
The IMF has released its economic growth forecasts for 2024. How do the G7 and BRICS countries compare?
-

 United States2 weeks ago
Ranked: The Largest U.S. Corporations by Number of Employees
We visualized the top U.S. companies by employees, revealing the massive scale of retailers like Walmart, Target, and Home Depot.
-

 Economy2 weeks ago
Where U.S. Inflation Hit the Hardest in March 2024
We visualized product categories that saw the highest % increase in price due to U.S. inflation as of March 2024.
-

 Economy1 month ago
G20 Inflation Rates: Feb 2024 vs COVID Peak
We visualize inflation rates across G20 countries as of Feb 2024, in the context of their COVID-19 pandemic peak.
-

 Economy1 month ago
Mapped: Unemployment Claims by State
This visual heatmap of unemployment claims by state highlights New York, California, and Alaska leading the country by a wide margin.
-

 Economy2 months ago
Confidence in the Global Economy, by Country
Will the global economy be stronger in 2024 than in 2023?


-

 Debt1 week ago
How Debt-to-GDP Ratios Have Changed Since 2000
-

 Demographics2 weeks ago
Population Projections: The World’s 6 Largest Countries in 2075
-

 Markets2 weeks ago
The Top 10 States by Real GDP Growth in 2023
-

 Demographics2 weeks ago
The Smallest Gender Wage Gaps in OECD Countries
-
Economy2 weeks ago
Where U.S. Inflation Hit the Hardest in March 2024
-

 Green2 weeks ago
Top Countries By Forest Growth Since 2001
-
United States2 weeks ago
Ranked: The Largest U.S. Corporations by Number of Employees
-

 Maps2 weeks ago
The Largest Earthquakes in the New York Area (1970-2024)