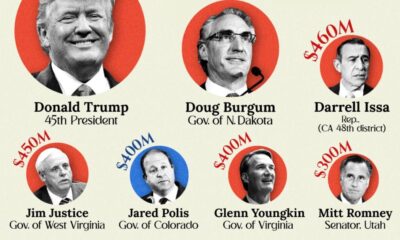

Donald Trump, Mitt Romney, J.B. Pritzker. This infographic is a snapshot of the richest politicians in the U.S.
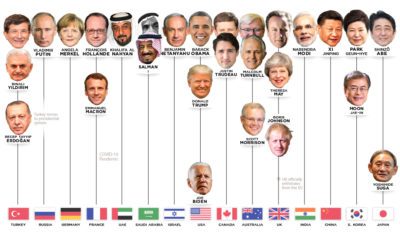

Who has led the world's 15 most powerful countries over the last 50 years? This visual looks at world leaders from 1970 to today.
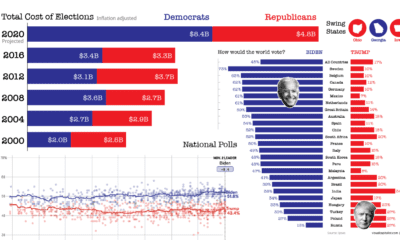

Buckle up your seatbelts—we look at 9 key data-driven charts to get you prepped for this consequential day in U.S. election history.
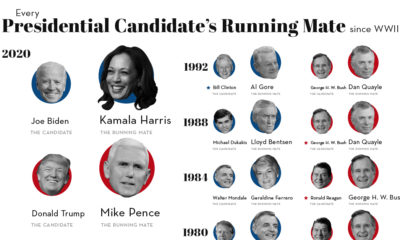

Picking the right VP makes all the difference to a President's success. We look at running mates of all Presidential hopefuls since 1940.
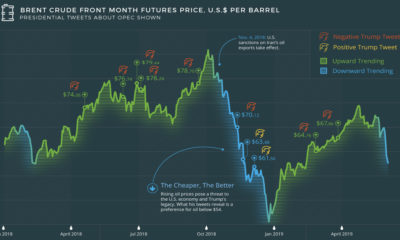

What goes through the head of a U.S. president? The tweets of U.S. President Donald Trump reveal a contentious relationship with the price of oil and...
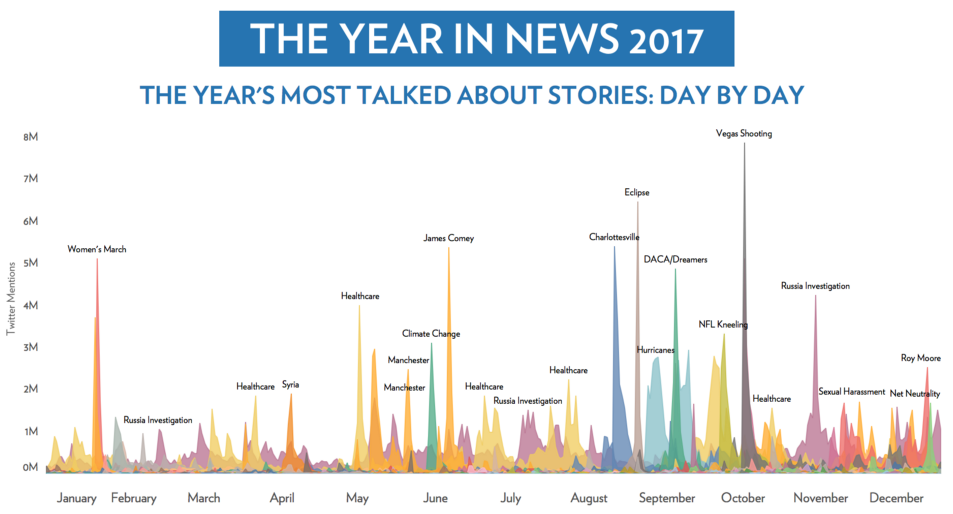
What were the most talked about news stories of 2017? This infographic crunches the data on 2.8 billion tweets to find out.
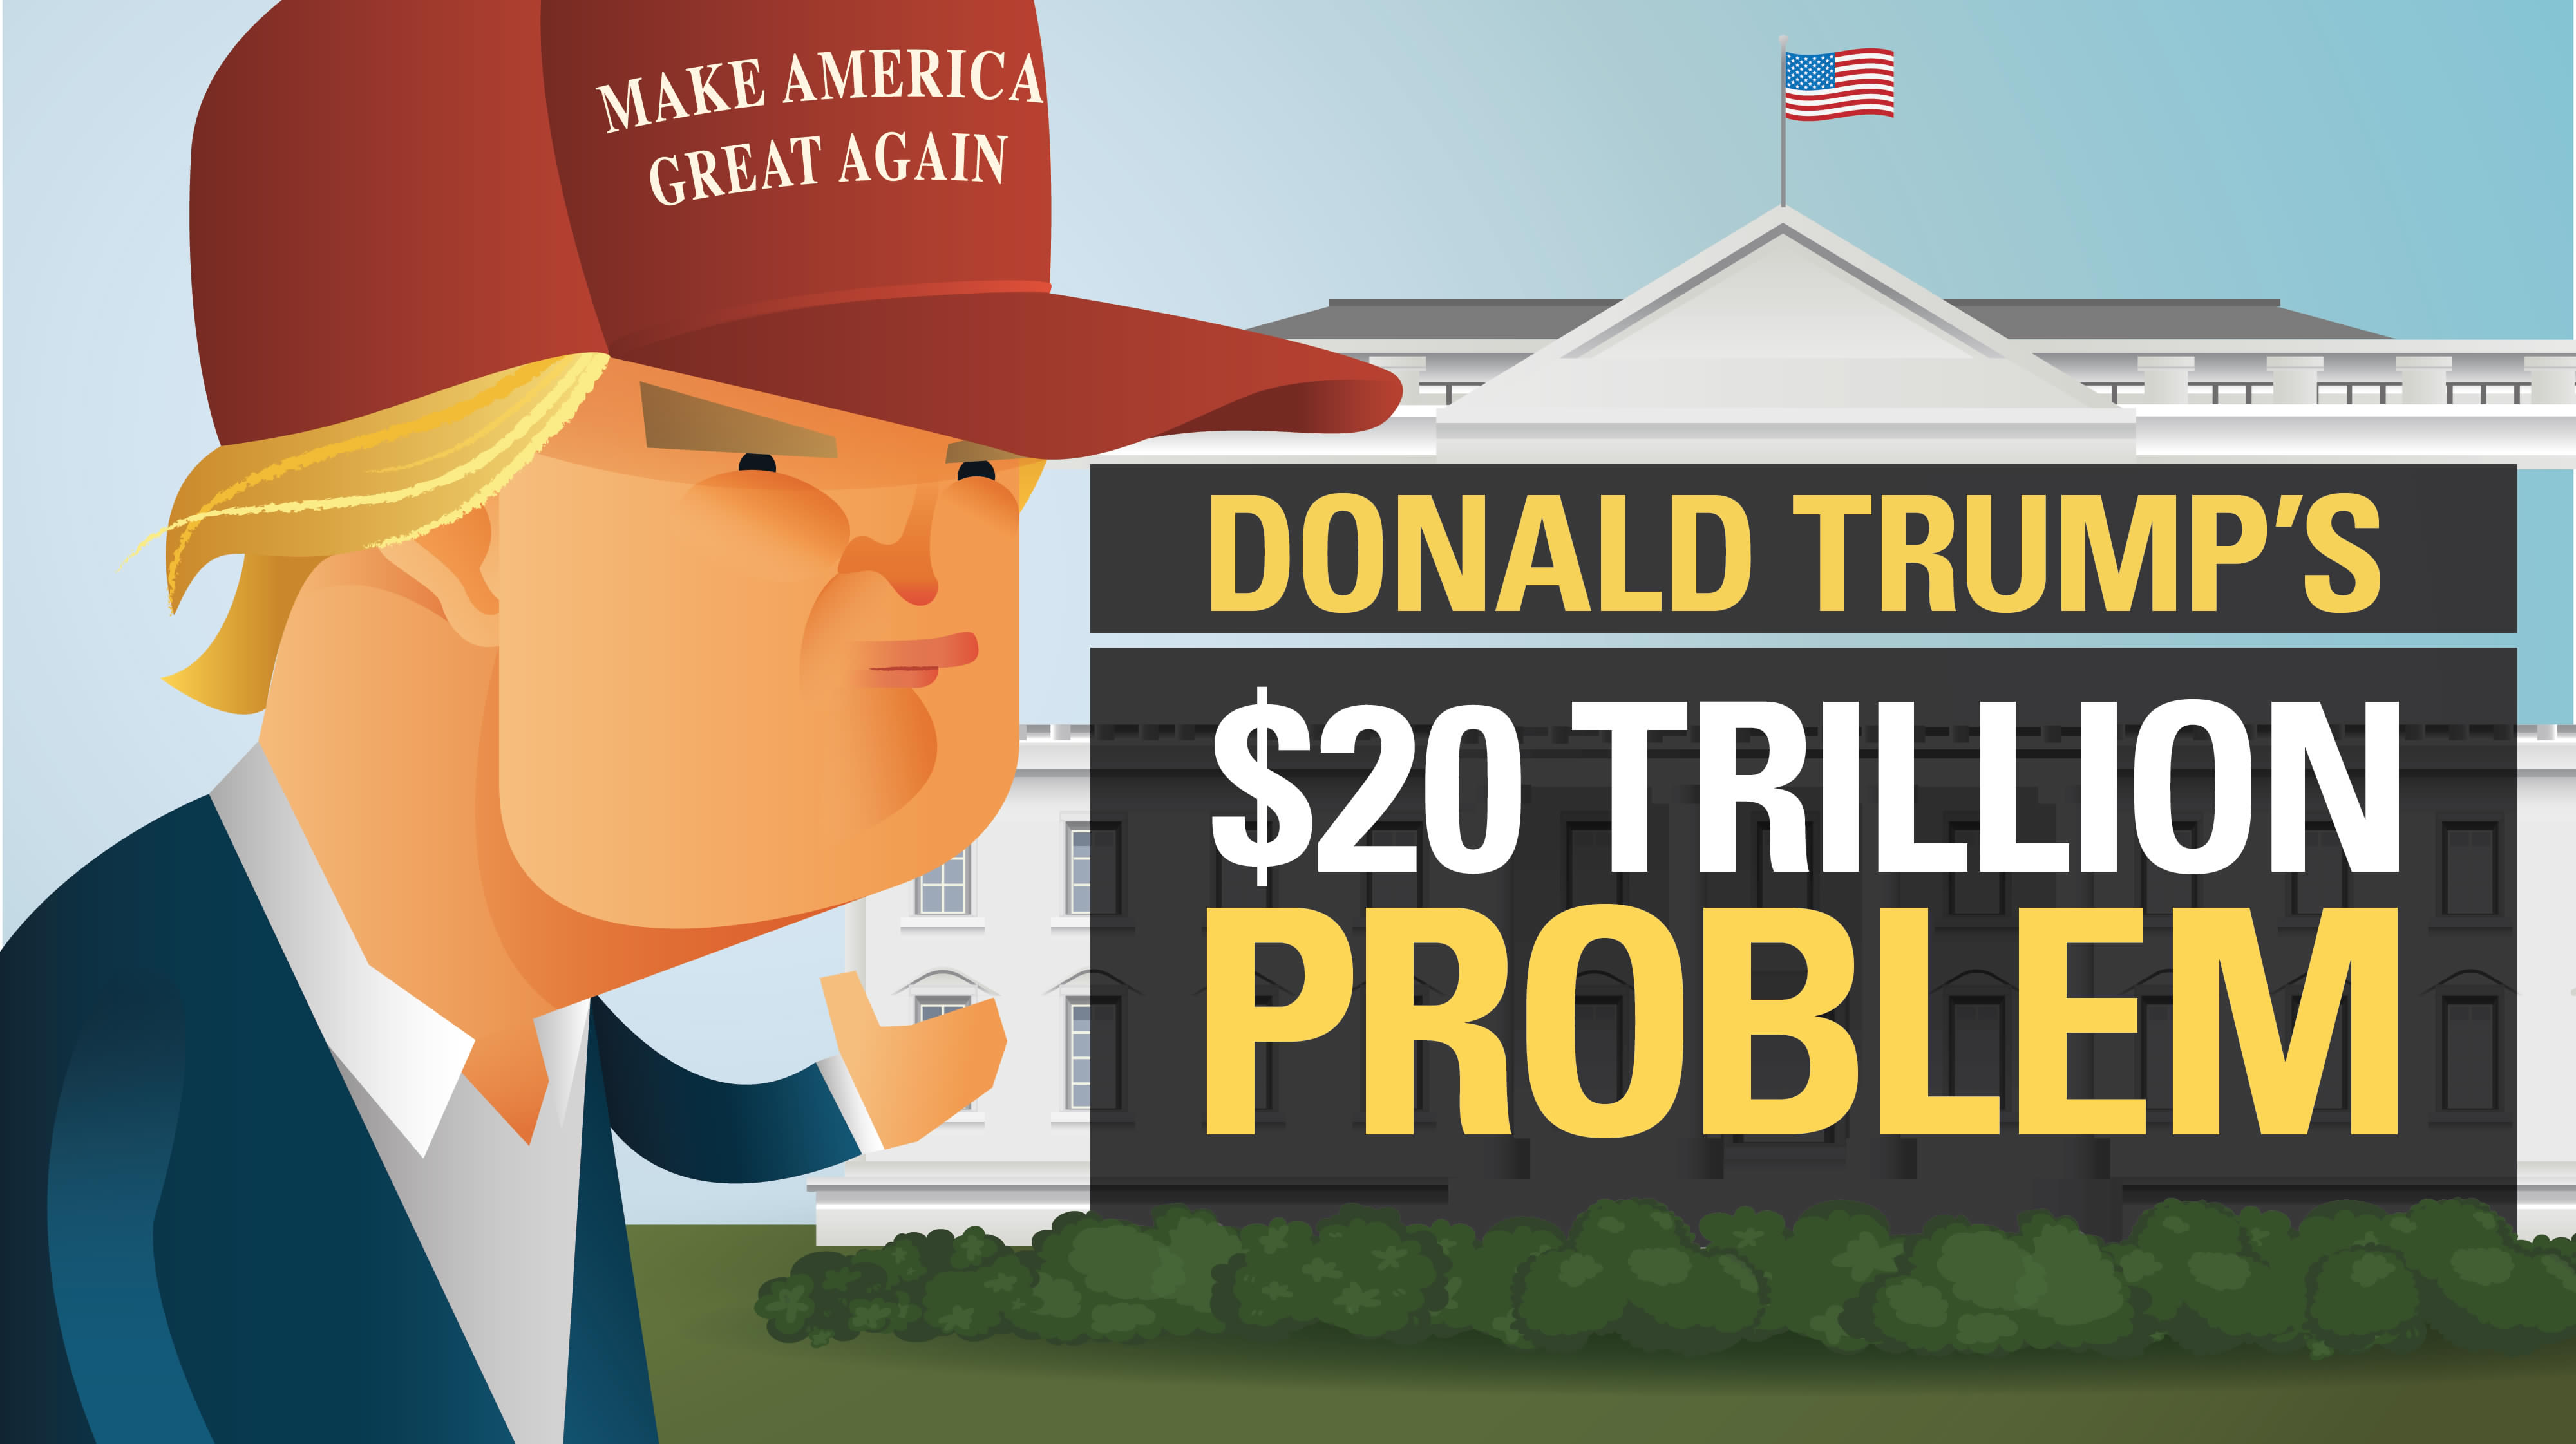
The new president faces many pressing issues - but for many, one looms above all others: how will President Trump deal with a $20 trillion national...
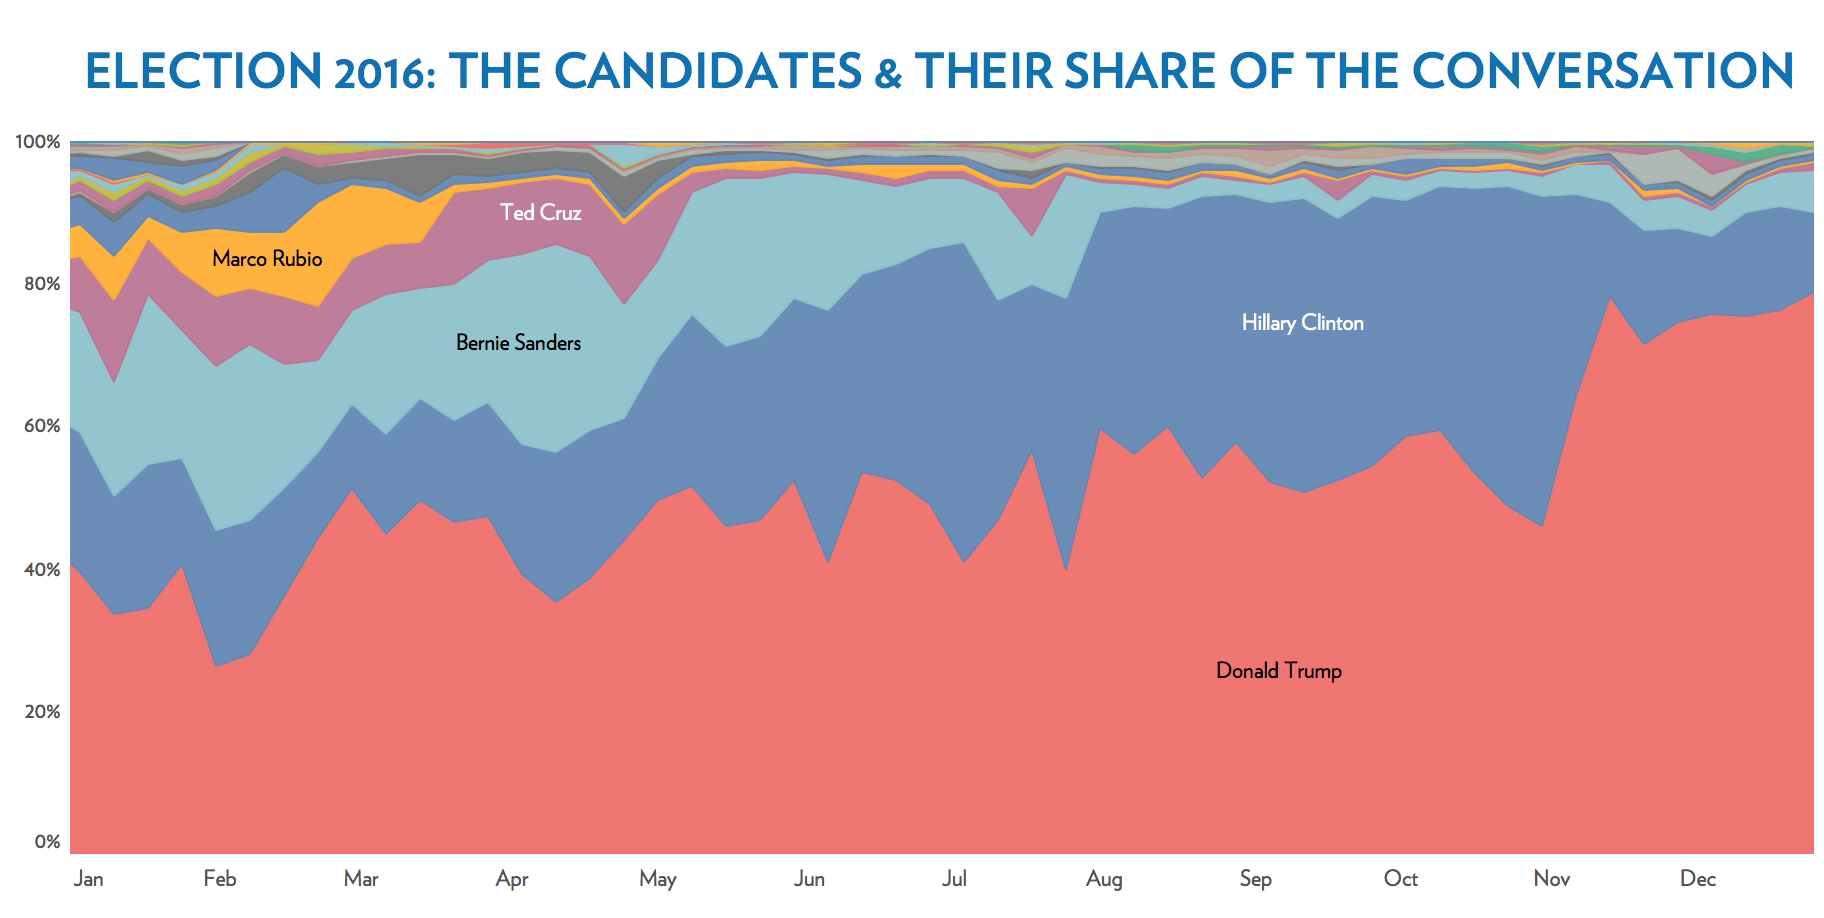
An in-depth analysis of over 2 billion tweets shows who and what dominated the news cycle of 2016 in the United States.
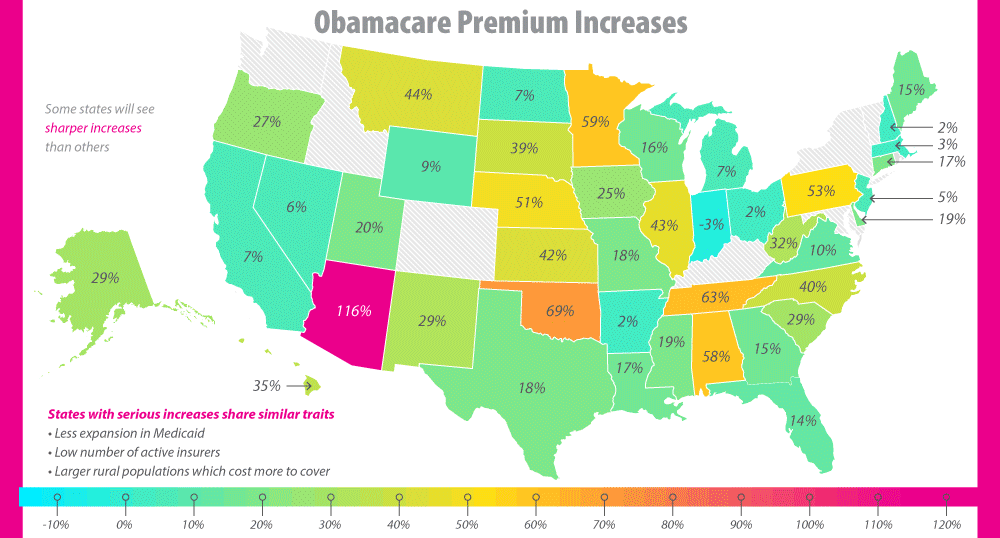
The future of Obamacare is uncertain, to say the least. See the major issues that have surfaced, including the skyrocketing premiums, in this infographic.

Election day is finally here. Here's 10 charts and maps that will be central to the story as America makes its historical decision.


