Money
Visualized: The Richest Families in America


Visualizing the Richest Families in America
When we think about the richest people in America, individual names often come to mind like Elon Musk, Jeff Bezos, and Bill Gates. But often, it’s the richest families in America that hold a deeper legacy, and sometimes, even deeper pockets.
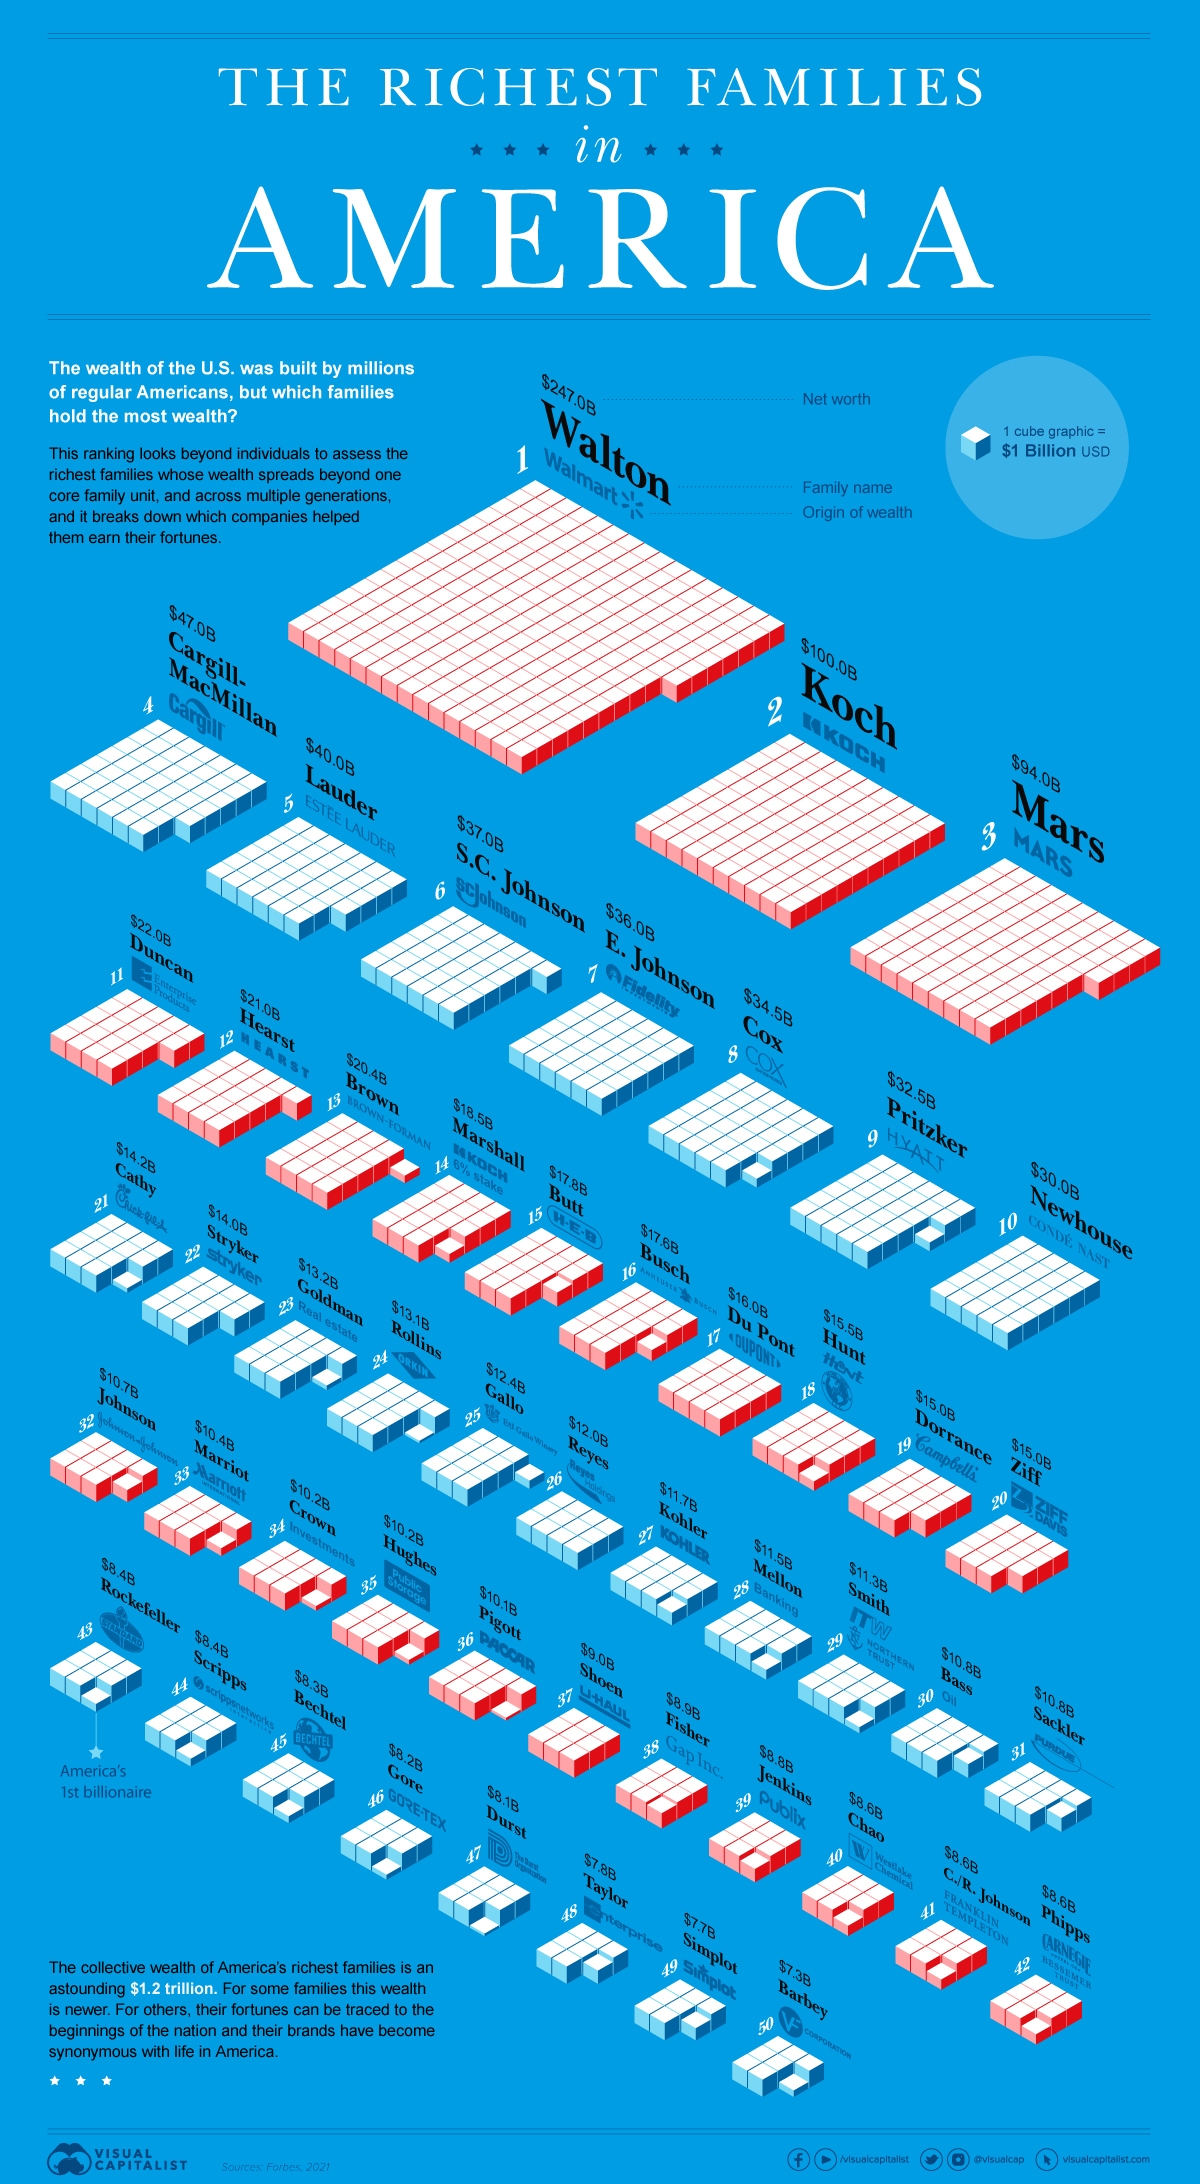
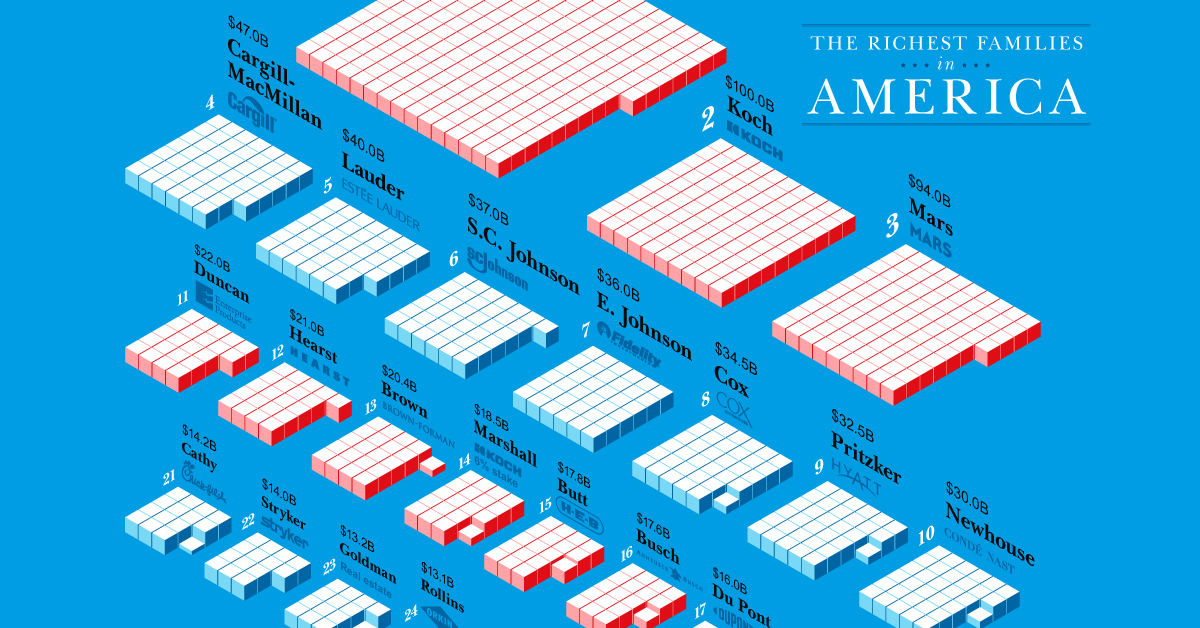
The country’s 50 richest families hold a collective wealth of $1.2 trillion. This ranking goes beyond nuclear family units and self-made fortunes, and it instead measures the wealth of multi-generational or extended families.
Our visualization, which leverages the latest data from Forbes, reveals the wealthiest families in America and the enterprises that helped them earn their billions.
Editor’s note on methodology: in this ranking, Forbes leaves out self-made entrepreneurs that appear with their nuclear families on the billionaires list. For example, Jeff Bezos founded Amazon and Rupert Murdoch founded News Corp, but these successes did not come from family wealth that was passed down to them.
Family Matters
Say the name Rockefeller or Vanderbilt, and everyone knows who you’re talking about—but how do these household names hold up in the modern rankings?
Below are the 50 richest families in America, based on net worth:
| Rank | Family | Net Worth | Origin of Wealth |
|---|---|---|---|
| #1 | Walton Family | $247.0B | Walmart |
| #2 | Koch Family | $100.0B | Koch Industries |
| #3 | Mars Family | $94.0B | Mars Inc. |
| #4 | Cargill-MacMillan Family | $47.0B | Cargill Inc. |
| #5 | Lauder Family | $40.0B | Estee Lauder |
| #6 | S.C. Johnson Family | $37.0B | SC Johnson |
| #7 | Edward Johnson Family | $36.0B | Fidelity |
| #8 | Cox Family | $34.5B | Cox Enterprises |
| #9 | Pritzker Family | $32.5B | Hyatt Hotels |
| #10 | Newhouse Family | $30.0B | Condé Nast |
| #11 | Duncan Family | $22.0B | Enterprise Products Partners L.P. |
| #12 | Hearst Family | $21.0B | Hearst Corporation |
| #13 | Brown Family | $20.4B | Brown–Forman |
| #14 | Marshall Family | $18.5B | Koch Industries (6% stake) |
| #15 | Butt Family | $17.8B | H-E-B |
| #16 | Busch Family | $17.6B | Anheuser-Busch |
| #17 | Du Pont Family | $16.0B | DuPont |
| #18 | Hunt Family | $15.5B | Hunt Oil and Petro-Hunt |
| #19 | Dorrance Family | $15.0B | Campbell Soup Co. |
| #20 | Ziff Family | $15.0B | Ziff-Davis |
| #21 | Cathy Family | $14.2B | Chick-fil-A |
| #22 | Stryker Family | $14.0B | Stryker |
| #23 | Goldman Family | $13.2B | Real Estate |
| #24 | Rollins Family | $13.1B | Orkin Pest control |
| #25 | Gallo Family | $12.4B | E&J Gallo Winery |
| #26 | Reyes Family | $12.0B | Reyes Holdings |
| #27 | Kohler Family | $11.7B | Kohler Co. |
| #28 | Mellon Family | $11.5B | Banking |
| #29 | Smith Family | $11.3B | Illinois Tool Works, Northern Trust |
| #30 | Bass Family | $10.8B | Oil |
| #31 | Sackler Family | $10.8B | Purdue Pharma |
| #32 | Johnson Family | $10.7B | Johnson & Johnson |
| #33 | Marriott Family | $10.4B | Marriott International |
| #34 | Crown Family | $10.2B | Investments |
| #35 | Hughes Family | $10.2B | Public Storage Inc. |
| #36 | Pigott Family | $10.1B | Paccar |
| #37 | Shoen Family | $9.0B | U-Haul |
| #38 | Fisher Family | $8.9B | Gap Inc. |
| #39 | Jenkins Family | $8.8B | Publix Super Markets |
| #40 | Chao Family | $8.6B | Westlake Chemical Corp. |
| #41 | (Charles & Rupert) Johnson Family | $8.6B | Franklin Resources Inc. |
| #42 | Phipps Family | $8.6B | Carnegie Steel, Bessemer Trust |
| #43 | Rockefeller Family | $8.4B | Standard Oil |
| #44 | E.W. Scripps Family | $8.4B | Scripps Network Interactive |
| #45 | Bechtel Family | $8.3B | Bechtel |
| #46 | Gore Family | $8.2B | Gore-Tex |
| #47 | Durst Family | $8.1B | Real Estate |
| #48 | Taylor Family | $7.8B | Enterprise Rent-A-Car |
| #49 | Simplot Family | $7.7B | Simplot |
| #50 | Barbey Family | $7.3B | VF Corp |
The richest family in the U.S. is the Waltons, founders of Walmart. Their net worth adds to an approximate $247 billion, making them also the richest family in the world. Over the last year, they’ve grown their family fortune by $25 billion, equal to nearly $3 million per hour.
Interestingly, the Vanderbilts—the railroad tycoons that were once the richest family in the country in the late 19th century—have been ousted from the rankings entirely. Other notable American families, like Ford and Astor, have lost their place on the list as well.
On the other hand, the Rockefellers still hold their status today, ranked at number 43 with a net worth of $8.4 billion. John D. Rockefeller became America’s first billionaire back in 1916, despite the breaking up of Standard Oil for antitrust reasons.
Building Wealth
Over the last five years, nearly every family on this list has seen wealth increase. Many of the behemoth companies on which these families built their fortunes are staples in America, like Campbell’s Soup, Cargill, Dixie Cups, Estee Lauder, and M&Ms and Snickers.
For example, the South’s beloved fast food chain, Chick-fil-A, was founded by the Cathy family and generated $12.67 billion in sales as of the latest annual data, making it the third most popular chain restaurant in the country.
Some of the newer families to make the list also owe it to the success of their enterprises:
- The Kohler family: Kohler Co. (manufacturers of kitchenware, plumbing products, furniture, etc.)
- The Taylor family: Enterprise Rent-A-Car (car rental services)
However, a few families have experienced significant losses since the last Forbes ranking. Here’s a look at some notable net worth decreases:
| Family | Company | Change in Net Worth from 2015-2020 |
|---|---|---|
| Hearst | Hearst Corporation | $-7.0B |
| Rockefeller | Standard Oil | $-2.6B |
| Sackler | Purdu Pharma | $-2.2B |
| Fisher | Gap Inc. | Negative growth (exact $ amount unknown) |
| Johnson (Charles and Rupert) | Mutual Funds | Negative growth (exact $ amount unknown) |
Purdue Pharma recently filed for bankruptcy. The Sackler family’s plan is to reformulate the company into a new venture whose profits would go towards the opioid crisis, for which they are largely blamed. It would also cost the family around $4.3 billion directly.
Keeping it in the Family
While some families may have experienced decreases in their wealth, for many this is just a small bump in the road.
Overall, the richest families in America are the keepers of immense wealth that has accumulated over generations. For some, their names are now cultural landmarks across the U.S. and their brands have become synonymous with life in America.


Money
Charted: Which City Has the Most Billionaires in 2024?
Just two countries account for half of the top 20 cities with the most billionaires. And the majority of the other half are found in Asia.


Charted: Which Country Has the Most Billionaires in 2024?
This was originally posted on our Voronoi app. Download the app for free on iOS or Android and discover incredible data-driven charts from a variety of trusted sources.
Some cities seem to attract the rich. Take New York City for example, which has 340,000 high-net-worth residents with investable assets of more than $1 million.
But there’s a vast difference between being a millionaire and a billionaire. So where do the richest of them all live?
Using data from the Hurun Global Rich List 2024, we rank the top 20 cities with the highest number of billionaires in 2024.
A caveat to these rich lists: sources often vary on figures and exact rankings. For example, in last year’s reports, Forbes had New York as the city with the most billionaires, while the Hurun Global Rich List placed Beijing at the top spot.
Ranked: Top 20 Cities with the Most Billionaires in 2024
The Chinese economy’s doldrums over the course of the past year have affected its ultra-wealthy residents in key cities.
Beijing, the city with the most billionaires in 2023, has not only ceded its spot to New York, but has dropped to #4, overtaken by London and Mumbai.
| Rank | City | Billionaires | Rank Change YoY |
|---|---|---|---|
| 1 | 🇺🇸 New York | 119 | +1 |
| 2 | 🇬🇧 London | 97 | +3 |
| 3 | 🇮🇳 Mumbai | 92 | +4 |
| 4 | 🇨🇳 Beijing | 91 | -3 |
| 5 | 🇨🇳 Shanghai | 87 | -2 |
| 6 | 🇨🇳 Shenzhen | 84 | -2 |
| 7 | 🇭🇰 Hong Kong | 65 | -1 |
| 8 | 🇷🇺 Moscow | 59 | No Change |
| 9 | 🇮🇳 New Delhi | 57 | +6 |
| 10 | 🇺🇸 San Francisco | 52 | No Change |
| 11 | 🇹🇭 Bangkok | 49 | +2 |
| 12 | 🇹🇼 Taipei | 45 | +2 |
| 13 | 🇫🇷 Paris | 44 | -2 |
| 14 | 🇨🇳 Hangzhou | 43 | -5 |
| 15 | 🇸🇬 Singapore | 42 | New to Top 20 |
| 16 | 🇨🇳 Guangzhou | 39 | -4 |
| 17T | 🇮🇩 Jakarta | 37 | +1 |
| 17T | 🇧🇷 Sao Paulo | 37 | No Change |
| 19T | 🇺🇸 Los Angeles | 31 | No Change |
| 19T | 🇰🇷 Seoul | 31 | -3 |
In fact all Chinese cities on the top 20 list have lost billionaires between 2023–24. Consequently, they’ve all lost ranking spots as well, with Hangzhou seeing the biggest slide (-5) in the top 20.
Where China lost, all other Asian cities—except Seoul—in the top 20 have gained ranks. Indian cities lead the way, with New Delhi (+6) and Mumbai (+3) having climbed the most.
At a country level, China and the U.S combine to make up half of the cities in the top 20. They are also home to about half of the world’s 3,200 billionaire population.
In other news of note: Hurun officially counts Taylor Swift as a billionaire, estimating her net worth at $1.2 billion.

-

 Sports1 week ago
The Highest Earning Athletes in Seven Professional Sports
-

 Countries2 weeks ago
Population Projections: The World’s 6 Largest Countries in 2075
-

 Markets2 weeks ago
The Top 10 States by Real GDP Growth in 2023
-

 Demographics2 weeks ago
The Smallest Gender Wage Gaps in OECD Countries
-

 United States2 weeks ago
Where U.S. Inflation Hit the Hardest in March 2024
-

 Green2 weeks ago
Top Countries By Forest Growth Since 2001
-

 United States2 weeks ago
Ranked: The Largest U.S. Corporations by Number of Employees
-

 Maps2 weeks ago
The Largest Earthquakes in the New York Area (1970-2024)