Energy
Chart: The Evolution of Standard Oil
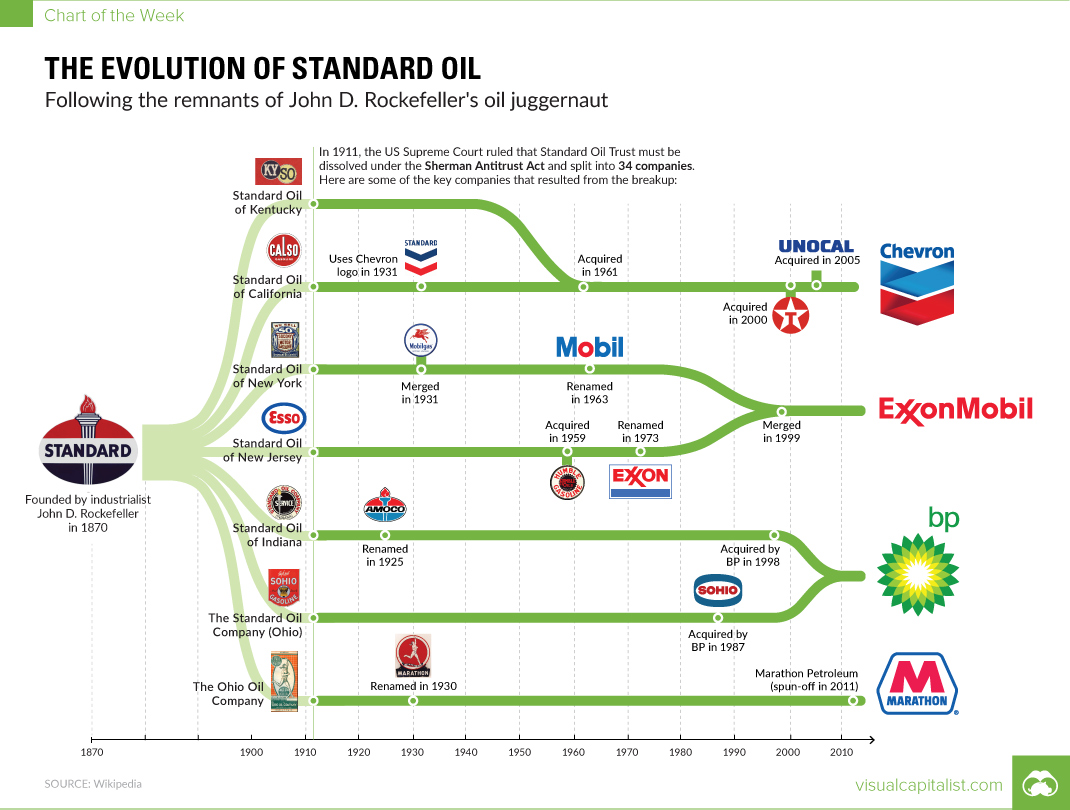
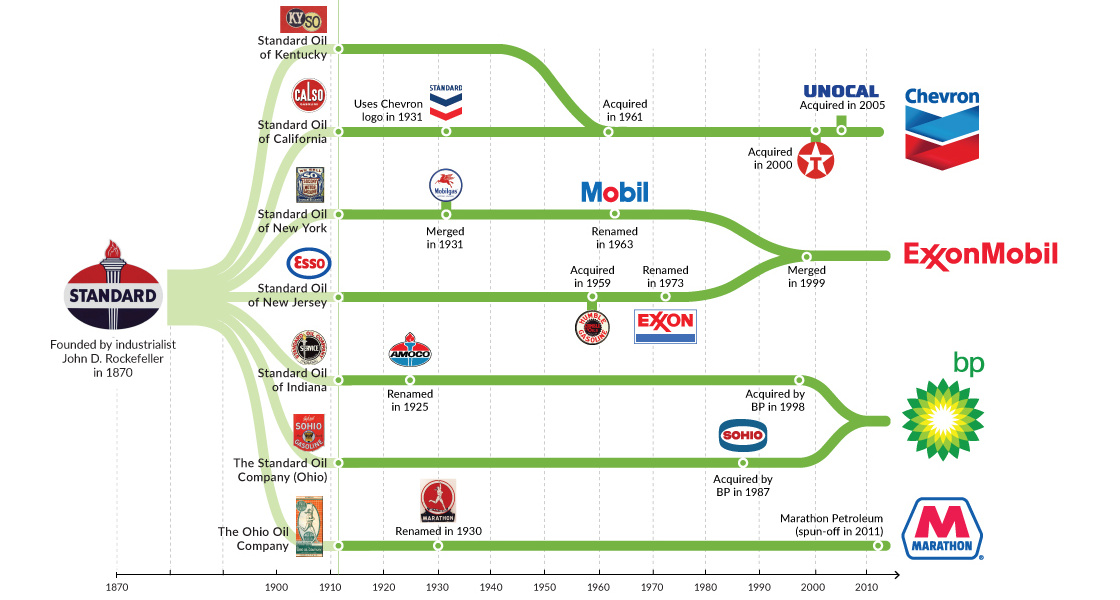
The Evolution of Standard Oil
Rockefeller’s juggernaut was split into 34 companies
The Chart of the Week is a weekly Visual Capitalist feature on Fridays.
A couple of weeks ago, we published an infographic showing how the list of the most valuable companies in the U.S. has changed drastically over the last 100 years.
Near the top of that list in 1917 is The Standard Oil Company of New Jersey, which is just one of the 34 forced spin-offs from the original Standard Oil juggernaut that was split up in 1911.
In today’s chart, we look at the “fragments” of Standard Oil, and who owns these assets today.
Monopoly Decision
At the turn of the 20th century, John D. Rockefeller’s Standard Oil was a force to be reckoned with. In the year 1904, it controlled 91% of oil production and 85% of final sales in the United States.
As a result, an antitrust case was filed against the company in 1906 under the Sherman Antitrust Act, arguing that the company used tactics such as raising prices in areas where it had a monopoly, while price gouging in areas where it still faced competition.
By the time the Standard Oil was broken up in 1911, its market share had eroded to 64%, and there were at least 147 refining companies competing with it in the United States. Meanwhile, John D. Rockefeller had left the company, yet the value of his stock doubled as a result of the split. This made him the world’s richest person at the time.
Resulting Companies
The company was split into 34 separate entities, mainly based on geographical area.
Today, the biggest of these companies form the core of the U.S. oil industry:
- Standard Oil of New Jersey: Merged with Humble Oil and eventually became Exxon
- Standard Oil of New York: Merged with Vacuum Oil, and eventually became Mobil
- Standard Oil of California: Acquired Standard Oil of Kentucky, Texaco, and Unocal, and is now Chevron
- Standard Oil of Indiana: Renamed Amoco, and was acquired by BP
- Standard Oil of Ohio: Acquired by BP
- The Ohio Oil Company: Became Marathon Oil, which eventually also spun-off Marathon Petroleum
But that’s not all – the Standard Oil asset portfolio also carried some other interesting brands that you’d recognize today:
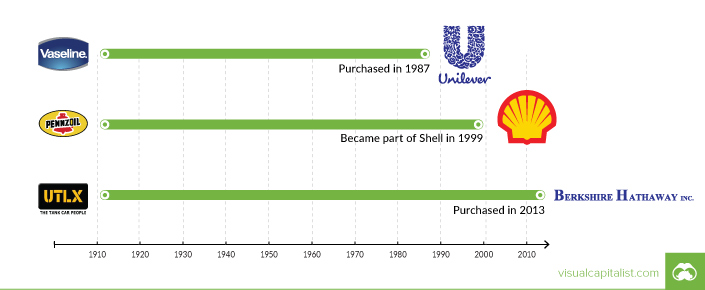
Yes, even Vaseline was originally a part of Standard Oil. Inventor Robert Chesebrough derived the product from petroleum residue, and the spun-off company (Chesebrough Manufacturing Company) was purchased by Unilever in 1987.
Meanwhile, the Union Tank Car Company is a part of Berkshire Hathaway today – and Pennzoil is owned by Royal Dutch Shell.


Energy
Charted: 4 Reasons Why Lithium Could Be the Next Gold Rush
Visual Capitalist has partnered with EnergyX to show why drops in prices and growing demand may make now the right time to invest in lithium.


4 Reasons Why You Should Invest in Lithium
Lithium’s importance in powering EVs makes it a linchpin of the clean energy transition and one of the world’s most precious minerals.
In this graphic, Visual Capitalist partnered with EnergyX to explore why now may be the time to invest in lithium.
1. Lithium Prices Have Dropped
One of the most critical aspects of evaluating an investment is ensuring that the asset’s value is higher than its price would indicate. Lithium is integral to powering EVs, and, prices have fallen fast over the last year:
| Date | LiOH·H₂O* | Li₂CO₃** |
|---|---|---|
| Feb 2023 | $76 | $71 |
| March 2023 | $71 | $61 |
| Apr 2023 | $43 | $33 |
| May 2023 | $43 | $33 |
| June 2023 | $47 | $45 |
| July 2023 | $44 | $40 |
| Aug 2023 | $35 | $35 |
| Sept 2023 | $28 | $27 |
| Oct 2023 | $24 | $23 |
| Nov 2023 | $21 | $21 |
| Dec 2023 | $17 | $16 |
| Jan 2024 | $14 | $15 |
| Feb 2024 | $13 | $14 |
Note: Monthly spot prices were taken as close to the 14th of each month as possible.
*Lithium hydroxide monohydrate MB-LI-0033
**Lithium carbonate MB-LI-0029
2. Lithium-Ion Battery Prices Are Also Falling
The drop in lithium prices is just one reason to invest in the metal. Increasing economies of scale, coupled with low commodity prices, have caused the cost of lithium-ion batteries to drop significantly as well.
In fact, BNEF reports that between 2013 and 2023, the price of a Li-ion battery dropped by 82%.
| Year | Price per KWh |
|---|---|
| 2023 | $139 |
| 2022 | $161 |
| 2021 | $150 |
| 2020 | $160 |
| 2019 | $183 |
| 2018 | $211 |
| 2017 | $258 |
| 2016 | $345 |
| 2015 | $448 |
| 2014 | $692 |
| 2013 | $780 |

3. EV Adoption is Sustainable
One of the best reasons to invest in lithium is that EVs, one of the main drivers behind the demand for lithium, have reached a price point similar to that of traditional vehicle.
According to the Kelly Blue Book, Tesla’s average transaction price dropped by 25% between 2022 and 2023, bringing it in line with many other major manufacturers and showing that EVs are a realistic transport option from a consumer price perspective.
| Manufacturer | September 2022 | September 2023 |
|---|---|---|
| BMW | $69,000 | $72,000 |
| Ford | $54,000 | $56,000 |
| Volkswagon | $54,000 | $56,000 |
| General Motors | $52,000 | $53,000 |
| Tesla | $68,000 | $51,000 |
4. Electricity Demand in Transport is Growing
As EVs become an accessible transport option, there’s an investment opportunity in lithium. But possibly the best reason to invest in lithium is that the IEA reports global demand for the electricity in transport could grow dramatically by 2030:
| Transport Type | 2022 | 2025 | 2030 |
|---|---|---|---|
| Buses 🚌 | 23,000 GWh | 50,000 GWh | 130,000 GWh |
| Cars 🚙 | 65,000 GWh | 200,000 GWh | 570,000 GWh |
| Trucks 🛻 | 4,000 GWh | 15,000 GWh | 94,000 GWh |
| Vans 🚐 | 6,000 GWh | 16,000 GWh | 72,000 GWh |
The Lithium Investment Opportunity
Lithium presents a potentially classic investment opportunity. Lithium and battery prices have dropped significantly, and recently, EVs have reached a price point similar to other vehicles. By 2030, the demand for clean energy, especially in transport, will grow dramatically.
With prices dropping and demand skyrocketing, now is the time to invest in lithium.
EnergyX is poised to exploit lithium demand with cutting-edge lithium extraction technology capable of extracting 300% more lithium than current processes.

-

 Lithium4 days ago
Ranked: The Top 10 EV Battery Manufacturers in 2023
Asia dominates this ranking of the world’s largest EV battery manufacturers in 2023.
-

 Energy1 week ago
The World’s Biggest Nuclear Energy Producers
China has grown its nuclear capacity over the last decade, now ranking second on the list of top nuclear energy producers.
-

 Energy1 month ago
The World’s Biggest Oil Producers in 2023
Just three countries accounted for 40% of global oil production last year.
-

 Energy1 month ago
How Much Does the U.S. Depend on Russian Uranium?
Currently, Russia is the largest foreign supplier of nuclear power fuel to the U.S.
-

 Uranium2 months ago
Charted: Global Uranium Reserves, by Country
We visualize the distribution of the world’s uranium reserves by country, with 3 countries accounting for more than half of total reserves.
-

 Energy3 months ago
Visualizing the Rise of the U.S. as Top Crude Oil Producer
Over the last decade, the United States has established itself as the world’s top producer of crude oil, surpassing Saudi Arabia and Russia.

-

 Misc1 week ago
How Hard Is It to Get Into an Ivy League School?
-

 Technology2 weeks ago
Ranked: Semiconductor Companies by Industry Revenue Share
-

 Markets2 weeks ago
Ranked: The World’s Top Flight Routes, by Revenue
-

 Demographics2 weeks ago
Population Projections: The World’s 6 Largest Countries in 2075
-

 Markets2 weeks ago
The Top 10 States by Real GDP Growth in 2023
-

 Demographics2 weeks ago
The Smallest Gender Wage Gaps in OECD Countries
-

 United States2 weeks ago
Where U.S. Inflation Hit the Hardest in March 2024
-

 Green2 weeks ago
Top Countries By Forest Growth Since 2001