Technology
Most Valuable U.S. Companies Over 100 Years
The Most Valuable Companies in America Over 100 Years
How much does the business world shift in a century?
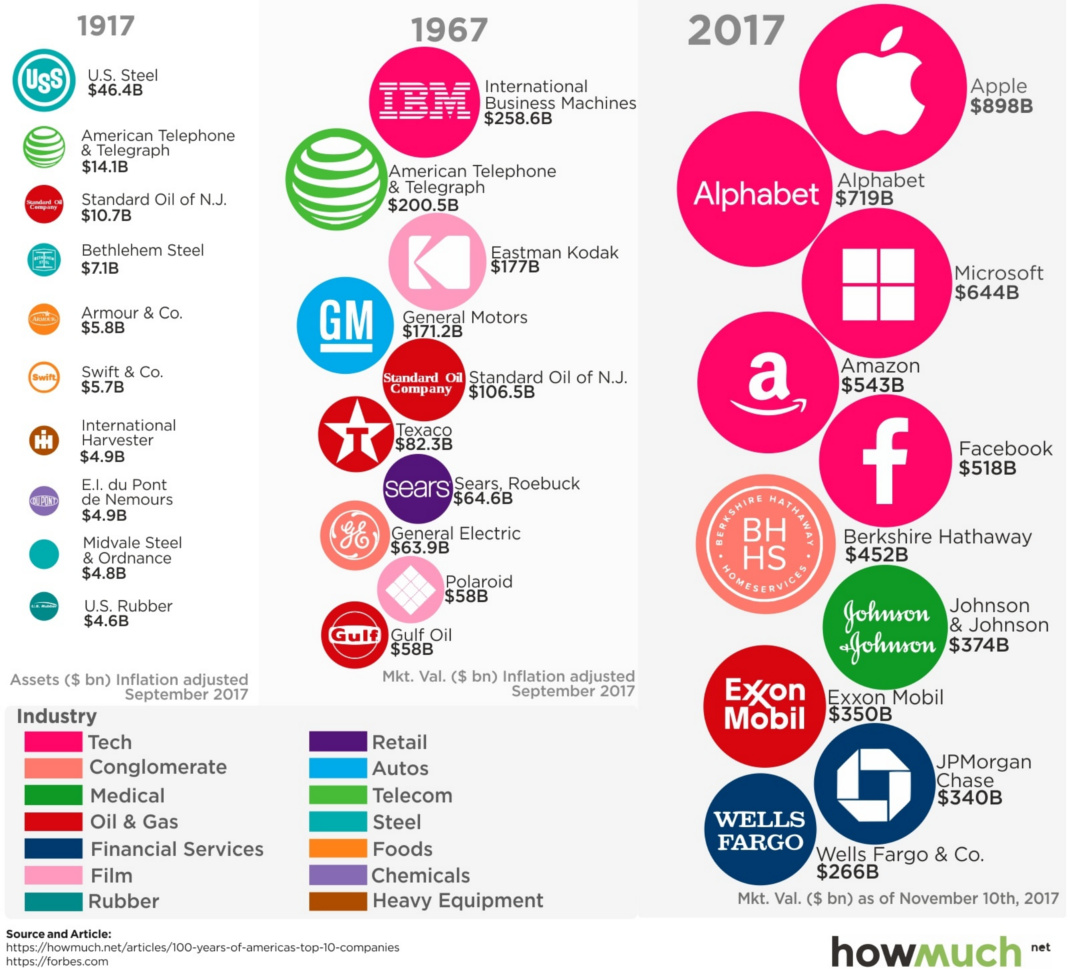
Today’s visualization comes from HowMuch.net, and it uses Forbes data to show how the list of the top 10 companies in the U.S. has evolved over the last 100 years.
1917: The Industrialist Era
In 1911, both John D. Rockefeller’s Standard Oil and J.P. Morgan’s U.S. Steel (which was formed from Andrew Carnegie’s steel company and others) were facing antitrust action.
Standard Oil, which controlled over 90% of all oil in the United States by 1900, got split up into 34 independent companies after a ruling by the Supreme Court. However, U.S. Steel, which controlled 67% of steel in the country, was able to weather the antitrust storm at the time.
In the chart showing data for 1917, you can see that U.S. Steel – which was considered the world’s first “billion dollar” company – reigned supreme in the U.S. based on the value of its assets. Meanwhile, Standard Oil of N.J. (a fragment of the Standard Oil breakup) was still able to finish in the third spot on the list.
1967: The Hardware Era
Fast forward 50 years, and oil is still big.
Standard Oil of N.J. (eventually to be re-named as Exxon Corp. in 1972) is the fifth biggest company in the country. Texaco and Gulf Oil, both of which later merged into Chevron (another Standard Oil offshoot) also make the top 10 in terms of market valuation.
Aside from energy, the 1967 list seems dominated by companies that make tangible things. IBM was making some of the first and most advanced computers, GM was the largest U.S. auto manufacturer, and both Kodak and Polaroid made cameras. General Electric, a conglomerate, made everything from computers to jet engines at this time.
2017: The Platform Era
Fast forward to now, and platforms like Facebook, Amazon, Google, Microsoft, and Apple have taken over.
We’ve shown how these five companies make their billions, and also how Facebook and Google are able to dominate global ad revenues through scale.
Meanwhile, many of the stalwarts from 1967 have fallen: Polaroid and Kodak both filed for bankruptcy, and Sears Canada filed for bankruptcy months ago. And of the big names from 1917, only AT&T remains of significance.
This raises the question: what will the next 50 years hold – and how many names from the 2017 list will remain?


Technology
Ranked: Semiconductor Companies by Industry Revenue Share
Nvidia is coming for Intel’s crown. Samsung is losing ground. AI is transforming the space. We break down revenue for semiconductor companies.


Semiconductor Companies by Industry Revenue Share
This was originally posted on our Voronoi app. Download the app for free on Apple or Android and discover incredible data-driven charts from a variety of trusted sources.
Did you know that some computer chips are now retailing for the price of a new BMW?
As computers invade nearly every sphere of life, so too have the chips that power them, raising the revenues of the businesses dedicated to designing them.
But how did various chipmakers measure against each other last year?
We rank the biggest semiconductor companies by their percentage share of the industry’s revenues in 2023, using data from Omdia research.
Which Chip Company Made the Most Money in 2023?
Market leader and industry-defining veteran Intel still holds the crown for the most revenue in the sector, crossing $50 billion in 2023, or 10% of the broader industry’s topline.
All is not well at Intel, however, with the company’s stock price down over 20% year-to-date after it revealed billion-dollar losses in its foundry business.
| Rank | Company | 2023 Revenue | % of Industry Revenue |
|---|---|---|---|
| 1 | Intel | $51B | 9.4% |
| 2 | NVIDIA | $49B | 9.0% |
| 3 | Samsung Electronics | $44B | 8.1% |
| 4 | Qualcomm | $31B | 5.7% |
| 5 | Broadcom | $28B | 5.2% |
| 6 | SK Hynix | $24B | 4.4% |
| 7 | AMD | $22B | 4.1% |
| 8 | Apple | $19B | 3.4% |
| 9 | Infineon Tech | $17B | 3.2% |
| 10 | STMicroelectronics | $17B | 3.2% |
| 11 | Texas Instruments | $17B | 3.1% |
| 12 | Micron Technology | $16B | 2.9% |
| 13 | MediaTek | $14B | 2.6% |
| 14 | NXP | $13B | 2.4% |
| 15 | Analog Devices | $12B | 2.2% |
| 16 | Renesas Electronics Corporation | $11B | 1.9% |
| 17 | Sony Semiconductor Solutions Corporation | $10B | 1.9% |
| 18 | Microchip Technology | $8B | 1.5% |
| 19 | Onsemi | $8B | 1.4% |
| 20 | KIOXIA Corporation | $7B | 1.3% |
| N/A | Others | $126B | 23.2% |
| N/A | Total | $545B | 100% |
Note: Figures are rounded. Totals and percentages may not sum to 100.
Meanwhile, Nvidia is very close to overtaking Intel, after declaring $49 billion of topline revenue for 2023. This is more than double its 2022 revenue ($21 billion), increasing its share of industry revenues to 9%.
Nvidia’s meteoric rise has gotten a huge thumbs-up from investors. It became a trillion dollar stock last year, and broke the single-day gain record for market capitalization this year.
Other chipmakers haven’t been as successful. Out of the top 20 semiconductor companies by revenue, 12 did not match their 2022 revenues, including big names like Intel, Samsung, and AMD.
The Many Different Types of Chipmakers
All of these companies may belong to the same industry, but they don’t focus on the same niche.
According to Investopedia, there are four major types of chips, depending on their functionality: microprocessors, memory chips, standard chips, and complex systems on a chip.
Nvidia’s core business was once GPUs for computers (graphics processing units), but in recent years this has drastically shifted towards microprocessors for analytics and AI.
These specialized chips seem to be where the majority of growth is occurring within the sector. For example, companies that are largely in the memory segment—Samsung, SK Hynix, and Micron Technology—saw peak revenues in the mid-2010s.

-

 Automotive2 weeks ago
Tesla Is Once Again the World’s Best-Selling EV Company
-

 AI1 week ago
The Stock Performance of U.S. Chipmakers So Far in 2024
-

 Automotive1 week ago
Almost Every EV Stock is Down After Q1 2024
-

 Money1 week ago
Where Does One U.S. Tax Dollar Go?
-

 Green2 weeks ago
Ranked: Top Countries by Total Forest Loss Since 2001
-

 Markets2 weeks ago
Visualizing America’s Shortage of Affordable Homes
-

 Maps2 weeks ago
Mapped: Average Wages Across Europe
-

 Mining2 weeks ago
Charted: The Value Gap Between the Gold Price and Gold Miners