Money
Mapped: The Wealthiest Billionaire in Each U.S. State in 2021
Check out the latest 2023 update of the wealthiest billionaire in every U.S. state.
Mapping the Wealthiest Billionaires in Each U.S. State
Check out the latest 2023 update of the wealthiest billionaire in every U.S. state.
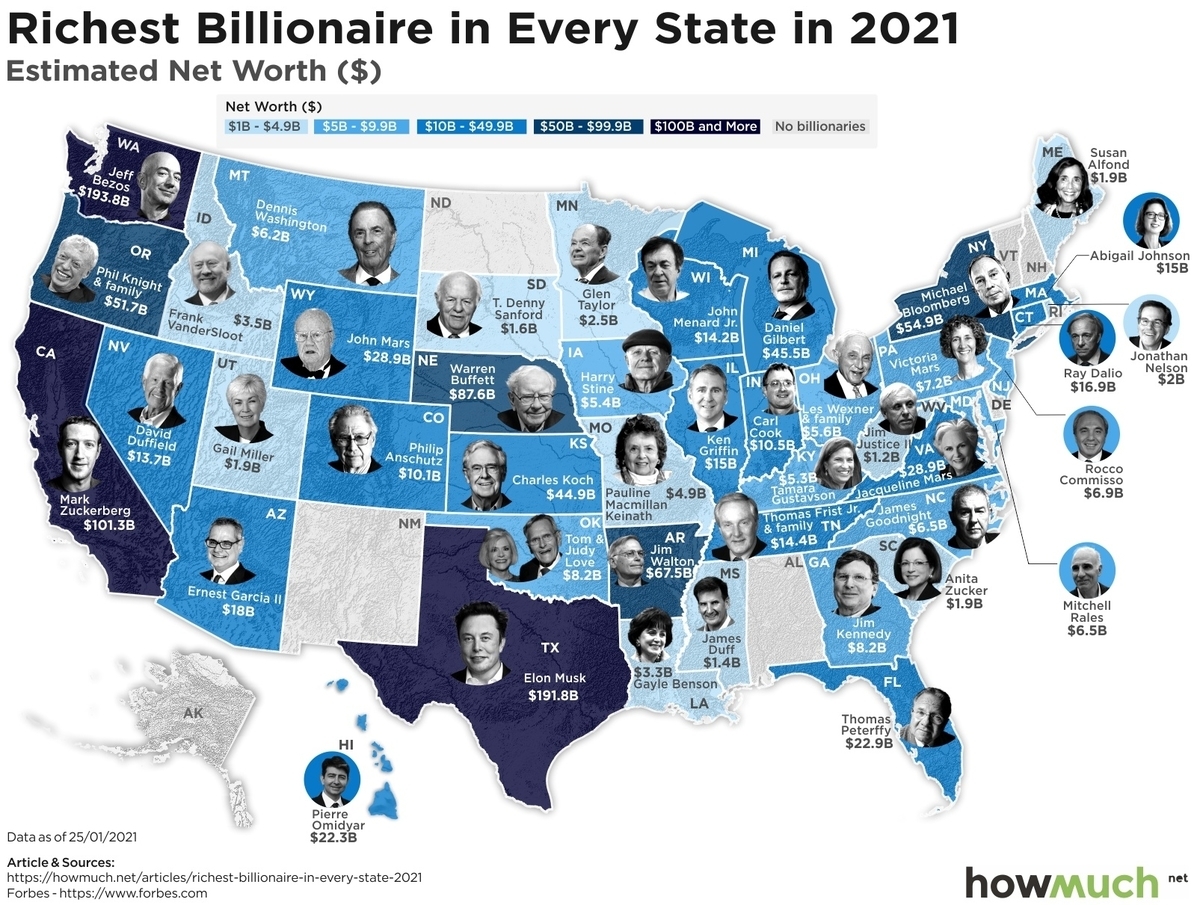
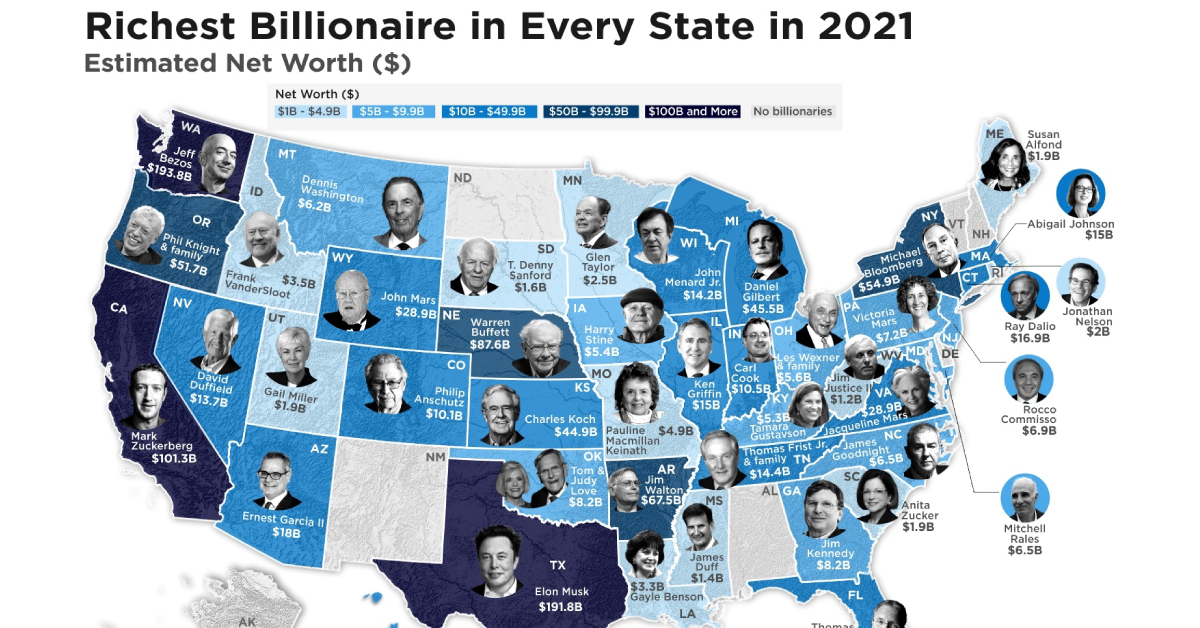
It is a testament to the burgeoning wealth of the U.S. that there is a billionaire in nearly every U.S. state. The country is home to around 800 billionaires among its 330 million people.
This map from HowMuch.Net reveals the wealthiest billionaire in each U.S. state.
The Richest of the Rich
Billionaires are a constant across the United States. The only states that don’t house one of these high-net-worth individuals are: Alabama, New Mexico, North Dakota, Alaska, Vermont, New Hampshire, Rhode Island, and Delaware.
Here’s a further breakdown that shows the wealthiest billionaire in each U.S. state:
| Billionaire | Net Worth (Billions) | State |
|---|---|---|
| Jeff Bezos | $193.8 | Washington |
| Elon Musk | $191.8 | Texas |
| Mark Zuckerberg | $101.3 | California |
| Warren Buffet | $87.6 | Nebraska |
| Jim Walton | $67.5 | Arkansas |
| Michael Bloomberg | $54.9 | New York |
| Phil Knight and Family | $51.7 | Oregon |
| Daniel Gilbert | $45.5 | Michigan |
| Charles Koch | $44.9 | Kansas |
| John Mars | $29.8 | Wyoming |
| Jacqueline Mars | $28.9 | Virginia |
| Thomas Peterffy | $22.9 | Florida |
| Pierre Omidyar | $22.3 | Hawaii |
| Ernest Garcia II | $18 | Arizona |
| Ray Dalio | $16.9 | Connecticut |
| Ken Griffin | $15 | Illinois |
| Abigail Johnson | $15 | Massachusetts |
| Thomas First Jr. and Family | $14.4 | Tennessee |
| John Menard Jr. | $14.2 | Wisconsin |
| David Duffield | $13.7 | Nevada |
| Carl Cook | $10.5 | Indiana |
| Philip Anschutz | $10.1 | Colorado |
| Tom and Judy Love | $8.2 | Oklahoma |
| Jim Kennedy | $8.2 | Georgia |
| Victoria Mars | $7.2 | Pennsylvania |
| Rocco Commisso | $6.9 | New Jersey |
| James Goodnight | $6.5 | North Carolina |
| Mitchell Rales | $6.5 | Maryland |
| Dennis Washington | $6.2 | Montana |
| Les Wexner and Family | $5.6 | Ohio |
| Harry Stine | $5.4 | Iowa |
| Tamara Gustavson | $5.3 | Kentucky |
| Pauline Macmillan Keinath | $4.9 | Missouri |
| Frank VanderSloot | $3.5 | Idaho |
| Gayle Benson | $3.3 | Louisiana |
| Glen Taylor | $2.5 | Minnesota |
| Jonathan Nelson | $2 | Rhode Island |
| Anita Zucker | $1.9 | South Carolina |
| Gail Miller | $1.9 | Utah |
| Susan Alfond | $1.9 | Maine |
| T. Denny Sanford | $1.6 | South Dakota |
| James Duff | $1.4 | Mississippi |
| Jim Justice | $1.2 | West Virginia |
Among the richest of the rich in the U.S., most are men, but there are 10 female billionaires who are the wealthiest in their respective states.
Jeff Bezos is worth an astounding $193.8 billion. Amazon became increasingly successful during the pandemic, as lockdown orders caused many people to have to stay home and shop online rather than in stores.
The runner up, Elon Musk, is worth $191.8 billion. The recent boom in Elon Musk’s net worth was due to the sharp rise in Tesla’s share prices. Recently, Elon Musk shifted his residence to the state of Texas, a move which is indicative of a larger trend of internal migration away from America’s most pricey urban areas.
Mind the Gap
Many of these individuals have actually become more wealthy during the COVID-19 pandemic, widening the existing gap of wealth inequality within the country.
Together Jeff Bezos, Elon Musk, Mark Zuckerberg, Bill Gates, and Warren Buffet (the five richest American billionaires) experienced a collective 85% increase in their wealth since the pandemic took hold. This equates to an added $303 billion in wealth.
In contrast, the median wealth of American households is about $121,700, and due to COVID-19, there has been a rising inability to cover bills and a risk of mass home loss in the country.
Overall, while we rely on companies like Amazon for our socially-distanced shopping and Facebook to keep us connected during the pandemic, Jeff Bezos and Mark Zuckerberg will likely continue to accrue immense fortunes. The wealthiest billionaires in the U.S. are likely to continue growing their net worth, pandemic or not, and have been consistently outpacing the lower to upper-middle income groups.


Money
Charted: Which City Has the Most Billionaires in 2024?
Just two countries account for half of the top 20 cities with the most billionaires. And the majority of the other half are found in Asia.


Charted: Which Country Has the Most Billionaires in 2024?
This was originally posted on our Voronoi app. Download the app for free on iOS or Android and discover incredible data-driven charts from a variety of trusted sources.
Some cities seem to attract the rich. Take New York City for example, which has 340,000 high-net-worth residents with investable assets of more than $1 million.
But there’s a vast difference between being a millionaire and a billionaire. So where do the richest of them all live?
Using data from the Hurun Global Rich List 2024, we rank the top 20 cities with the highest number of billionaires in 2024.
A caveat to these rich lists: sources often vary on figures and exact rankings. For example, in last year’s reports, Forbes had New York as the city with the most billionaires, while the Hurun Global Rich List placed Beijing at the top spot.
Ranked: Top 20 Cities with the Most Billionaires in 2024
The Chinese economy’s doldrums over the course of the past year have affected its ultra-wealthy residents in key cities.
Beijing, the city with the most billionaires in 2023, has not only ceded its spot to New York, but has dropped to #4, overtaken by London and Mumbai.
| Rank | City | Billionaires | Rank Change YoY |
|---|---|---|---|
| 1 | 🇺🇸 New York | 119 | +1 |
| 2 | 🇬🇧 London | 97 | +3 |
| 3 | 🇮🇳 Mumbai | 92 | +4 |
| 4 | 🇨🇳 Beijing | 91 | -3 |
| 5 | 🇨🇳 Shanghai | 87 | -2 |
| 6 | 🇨🇳 Shenzhen | 84 | -2 |
| 7 | 🇭🇰 Hong Kong | 65 | -1 |
| 8 | 🇷🇺 Moscow | 59 | No Change |
| 9 | 🇮🇳 New Delhi | 57 | +6 |
| 10 | 🇺🇸 San Francisco | 52 | No Change |
| 11 | 🇹🇭 Bangkok | 49 | +2 |
| 12 | 🇹🇼 Taipei | 45 | +2 |
| 13 | 🇫🇷 Paris | 44 | -2 |
| 14 | 🇨🇳 Hangzhou | 43 | -5 |
| 15 | 🇸🇬 Singapore | 42 | New to Top 20 |
| 16 | 🇨🇳 Guangzhou | 39 | -4 |
| 17T | 🇮🇩 Jakarta | 37 | +1 |
| 17T | 🇧🇷 Sao Paulo | 37 | No Change |
| 19T | 🇺🇸 Los Angeles | 31 | No Change |
| 19T | 🇰🇷 Seoul | 31 | -3 |
In fact all Chinese cities on the top 20 list have lost billionaires between 2023–24. Consequently, they’ve all lost ranking spots as well, with Hangzhou seeing the biggest slide (-5) in the top 20.
Where China lost, all other Asian cities—except Seoul—in the top 20 have gained ranks. Indian cities lead the way, with New Delhi (+6) and Mumbai (+3) having climbed the most.
At a country level, China and the U.S combine to make up half of the cities in the top 20. They are also home to about half of the world’s 3,200 billionaire population.
In other news of note: Hurun officially counts Taylor Swift as a billionaire, estimating her net worth at $1.2 billion.

-

 Debt1 week ago
How Debt-to-GDP Ratios Have Changed Since 2000
-

 Demographics2 weeks ago
Population Projections: The World’s 6 Largest Countries in 2075
-

 Markets2 weeks ago
The Top 10 States by Real GDP Growth in 2023
-

 Demographics2 weeks ago
The Smallest Gender Wage Gaps in OECD Countries
-

 United States2 weeks ago
Where U.S. Inflation Hit the Hardest in March 2024
-

 Green2 weeks ago
Top Countries By Forest Growth Since 2001
-

 United States2 weeks ago
Ranked: The Largest U.S. Corporations by Number of Employees
-

 Maps2 weeks ago
The Largest Earthquakes in the New York Area (1970-2024)