Globalization
Visualizing the UK and EU Trade Relationship


Visualizing the UK and EU Trade Relationship
With Brexit solidified and a new trade deal having been struck between the UK and the EU, it appears that a sense of normalcy has returned to the European continent.
The Trade and Cooperation Agreement (TCA) between the two entities came into effect on January 1st, 2021, corresponding with the UK officially leaving the EU Single Market and Customs Union on the same day. The new deal will help the status quo of trade continue, but how important is trade between the EU and the UK?
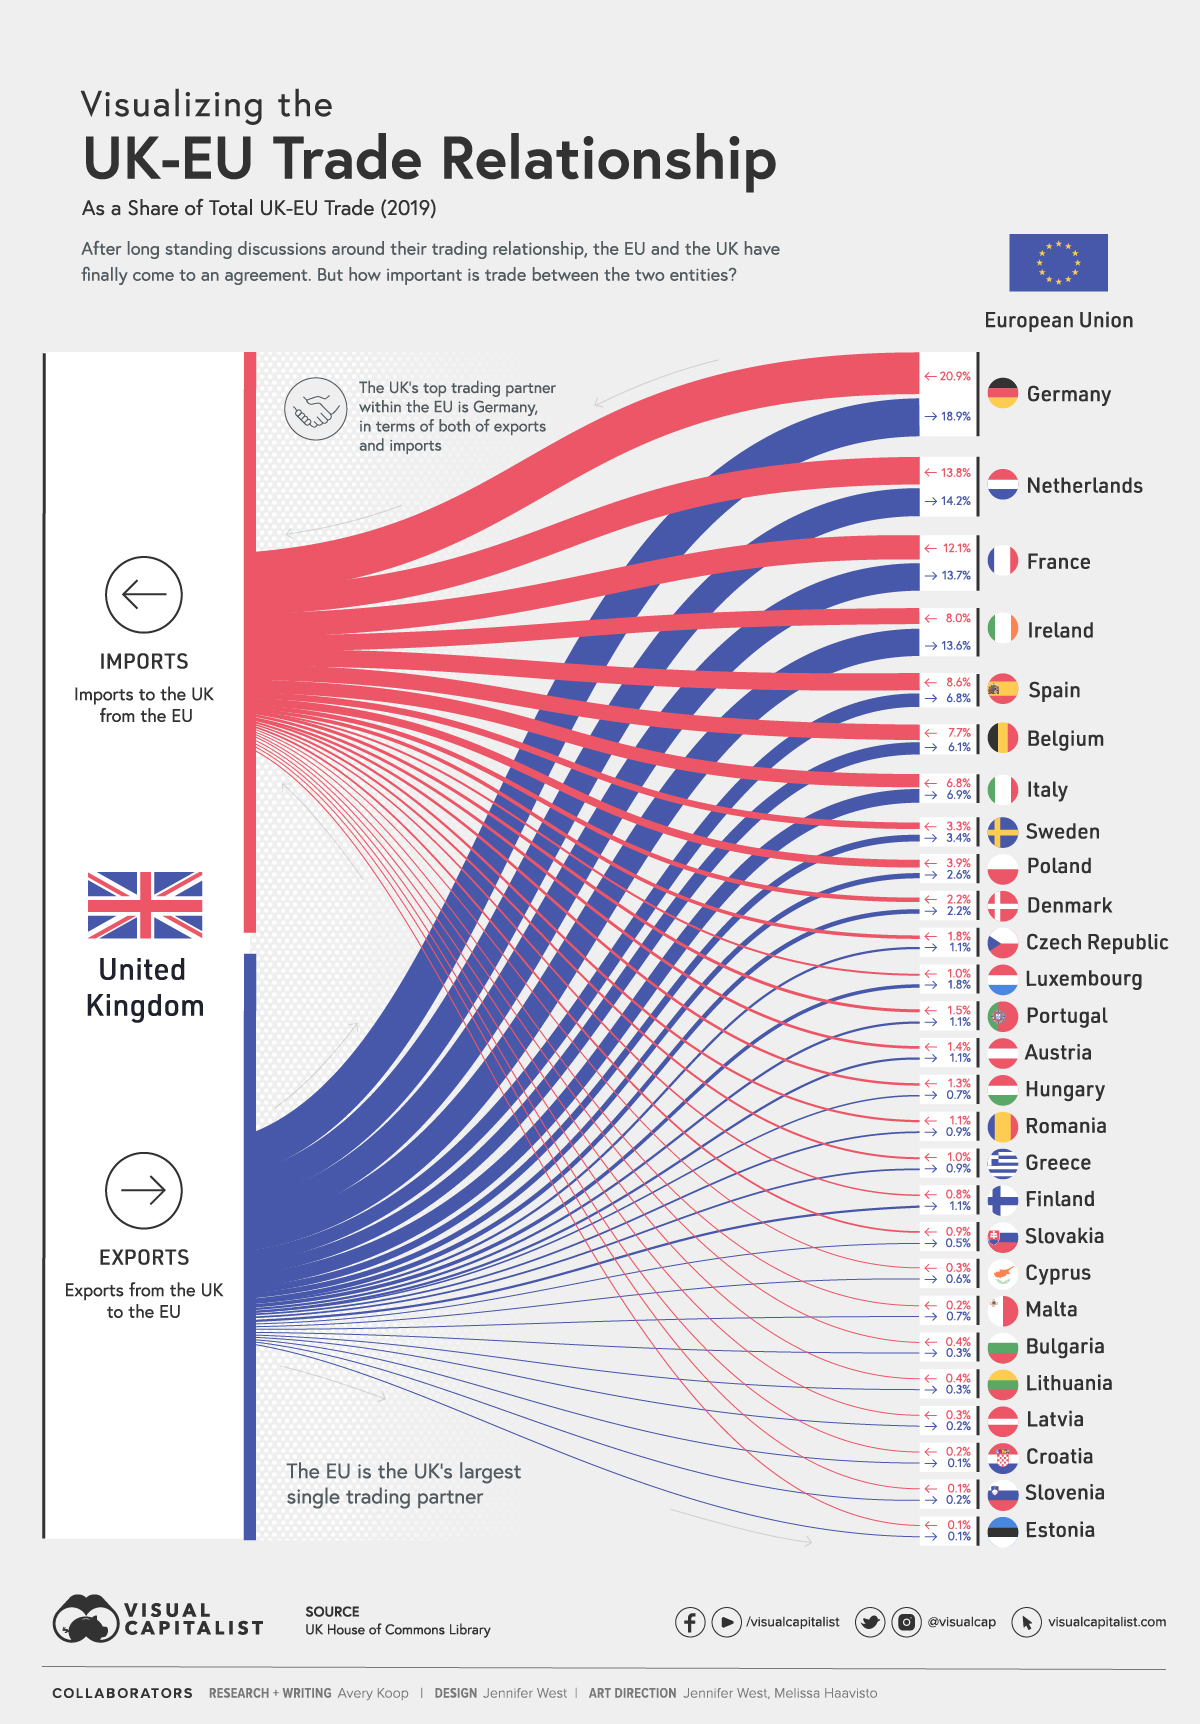
This visualization, using data from the British House of Commons’ Statistics on UK-EU Trade Briefing Paper, reveals the significance of trade between the UK and EU member states.
Who Does the UK Trade With in the EU?
The EU is the UK’s biggest global trading partner, representing 47% of the country’s total trade.
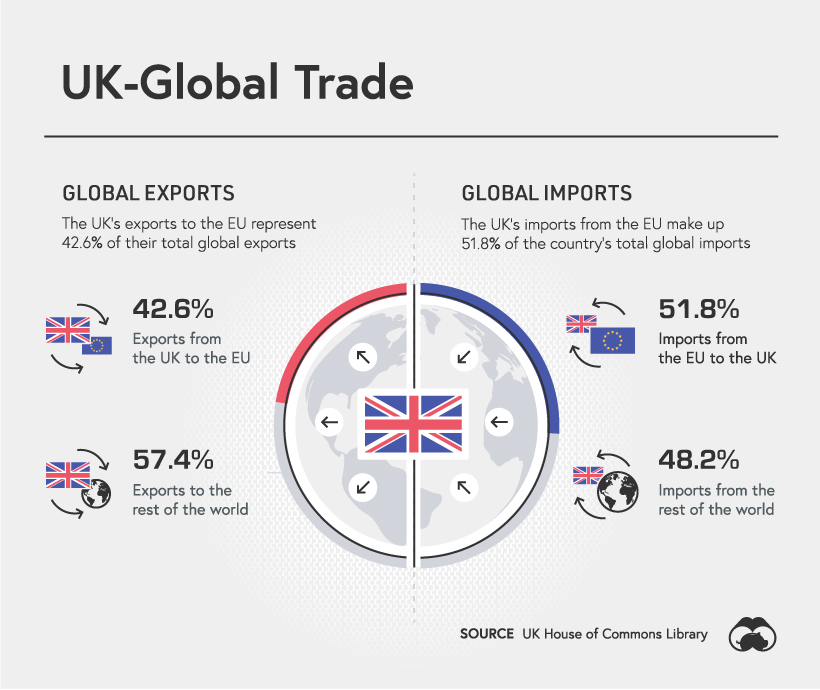
To break it down further, the EU is the buyer of 42.6% of the UK’s total exports, while also being the source of 51.8% of their total imports. Here’s a closer look at exports and imports by country.
| Country | % of UK's Exports to the EU | % of UK Imports from the EU |
|---|---|---|
| 🇩🇪 Germany | 18.9% | 20.9% |
| 🇳🇱 Netherlands | 14.2% | 13.8% |
| 🇫🇷 France | 13.7% | 12.1% |
| 🇮🇪 Ireland | 13.6% | 8.0% |
| 🇮🇹 Italy | 6.9% | 6.8% |
| 🇪🇸 Spain | 6.8% | 8.6% |
| 🇧🇪 Belgium | 6.1% | 7.7% |
| 🇸🇪 Sweden | 3.4% | 3.3% |
| 🇵🇱 Poland | 2.6% | 3.9% |
| 🇩🇰 Denmark | 2.2% | 2.2% |
| 🇱🇺 Luxembourg | 1.8% | 1.0% |
| 🇦🇹 Austria | 1.1% | 1.4% |
| 🇨🇿 Czech Repbulic | 1.1% | 1.8% |
| 🇫🇮 Finland | 1.1% | 0.8% |
| 🇵🇹 Portugal | 1.1% | 1.5% |
| 🇬🇷 Greece | 0.9% | 1.0% |
| 🇷🇴 Romania | 0.9% | 1.1% |
| 🇭🇺 Hungary | 0.7% | 1.3% |
| 🇲🇹 Malta | 0.7% | 0.2% |
| 🇨🇾 Cyprus | 0.6% | 0.3% |
| 🇸🇰 Slovakia | 0.5% | 0.9% |
| 🇧🇬 Bulgaria | 0.3% | 0.4% |
| 🇱🇹 Lithuania | 0.3% | 0.4% |
| 🇱🇻 Latvia | 0.2% | 0.3% |
| 🇸🇮 Slovenia | 0.2% | 0.1% |
| 🇭🇷 Croatia | 0.1% | 0.2% |
| 🇪🇪 Estonia | 0.1% | 0.1% |
| 🇪🇺 Total EU 28 | 100% | 100% |
The UK’s biggest trading partners within the EU are Ireland, Germany, the Netherlands, and France. Germany comes in at number one, making up nearly 21% of the UK’s imports and receiving almost 19% of the country’s exports.
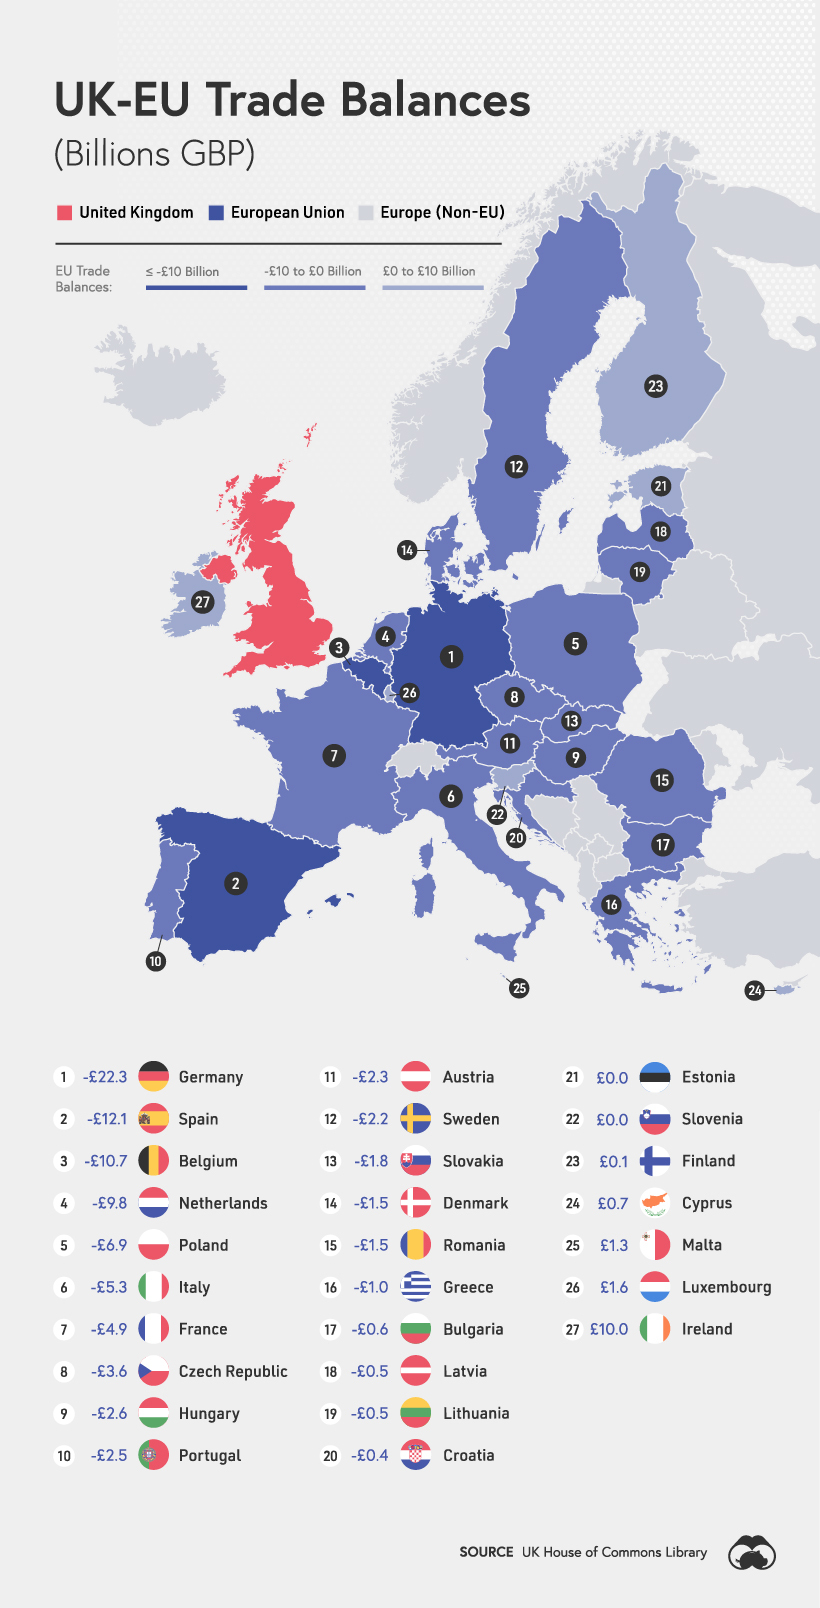
Here’s a breakdown of the trade balances between the UK and the individual EU member states.
What’s in the Bag?
In any trade relationship, it’s also worth examining what types of products and services are switching hands.
Top Imports
The UK’s top three goods imports from the EU (in terms of percentage of total imports) are:
- Motor vehicles (18%)
- Pharmaceuticals (7%)
- Electric machinery and appliances (4%)
Without the new agreement, goods would face tariffs based on the World Trade Organization’s standards. For example, motor vehicles, would have an average tariff of 10% imposed on them, without the provisions of the agreement.
The UK’s top three service imports from the EU are:
- Travel (33%)
- Business services (27%)
- Transportation (18%)
Looking at services, the main import from the EU is travel, followed closely by business services and transportation. Travel makes the top three, as many countries in the EU make attractive vacation spots for UK citizens.
Top Exports
The UK’s top three goods exports to the EU (in terms of percentage of total exports to the EU) are:
- Petroleum and petroleum products (12%)
- Motor vehicles (10%)
- Transport equipment (6%)
In terms of exports, petroleum is the UK’s largest export to the EU, representing 68% of the country’s total petroleum exports.
The UK’s top three service exports to the EU are:
- Business services (33%)
- Financial services (21%)
- Travel (14%)
The main service export is business services, such as accounting, legal, advertising, R&D, engineering, and so on. Travel to the UK is a significant revenue generator as London is one of the top tourist destinations in the world.
EU vs. Global Trade
The UK’s relationship with other countries has remained steady. China is one of the country’s most important export destinations, growing 7% per year from 2010-2019.
At the same time, the UK’s exports to the United States have grown just over 4% per year over the same period, continuing to increase at a similar rate up to 2030.
While the UK currently has a £79 billion ($108 billion) trade deficit with the EU, they have a surplus of £49 billion ($67 billion) with non-EU countries. Additionally, the share of the UK’s exports going to the EU has been consistently falling over the last number of years. Foreign direct investment flows between the two entities have also been drastically reduced.
However, the UK and EU trade relationship is still highly intertwined and significant. Not only are the two connected through intangible flows but physically as well via pipelines, transport highways, and cables. In a typical year, 210 million passengers and 230 million tonnes of cargo are transported between the two entities.
The TCA will help to regulate these flows and continue a sense of status quo, however, it’s worth noting that if EU regulations are not met, tariffs could be imposed.
The Economist Intelligence Unit recently determined risk and resilience factors for different UK industries based on the agreement. The report found that the food & agriculture, automotive, and financial services industries are most at risk, due to interconnected supply chains and the risk of tariffs being imposed. The life sciences and tech industries stand to do the best.
The Trade and Cooperation Agreement
Overall, Brexit has had significant ramifications for all nations involved. Ireland, for example, is now geographically cut off from the EU, creating potential obstacles for both the movement of people and goods.
Now, after years of discussions, the UK and the EU have finally agreed to the terms for their new relationship, with a focus on sustainable trade, citizens’ security, and governance for long-standing cooperation, in order to guarantee a level playing field. The TCA has helped ease the transition, and while they’re no longer in a union, the UK and the EU have created a strong base for trade to continue normally.


Politics
Charted: How Much Do Countries Trust the United Nations?
Which countries trust the United Nations to do the right thing the most, and the least?
How Much Do Countries Trust the United Nations?
This was originally posted on our Voronoi app. Download the app for free on iOS or Android and discover incredible data-driven charts from a variety of trusted sources.
Do you trust the United Nations (UN) in carrying out its objectives of maintaining peace and security, protecting human rights, and upholding international law?
Survey results from Edelman’s 2024 Trust Barometer Global Report show that some countries’ citizens believe strongly in the UN to “do the right thing,” while others are less trusting.
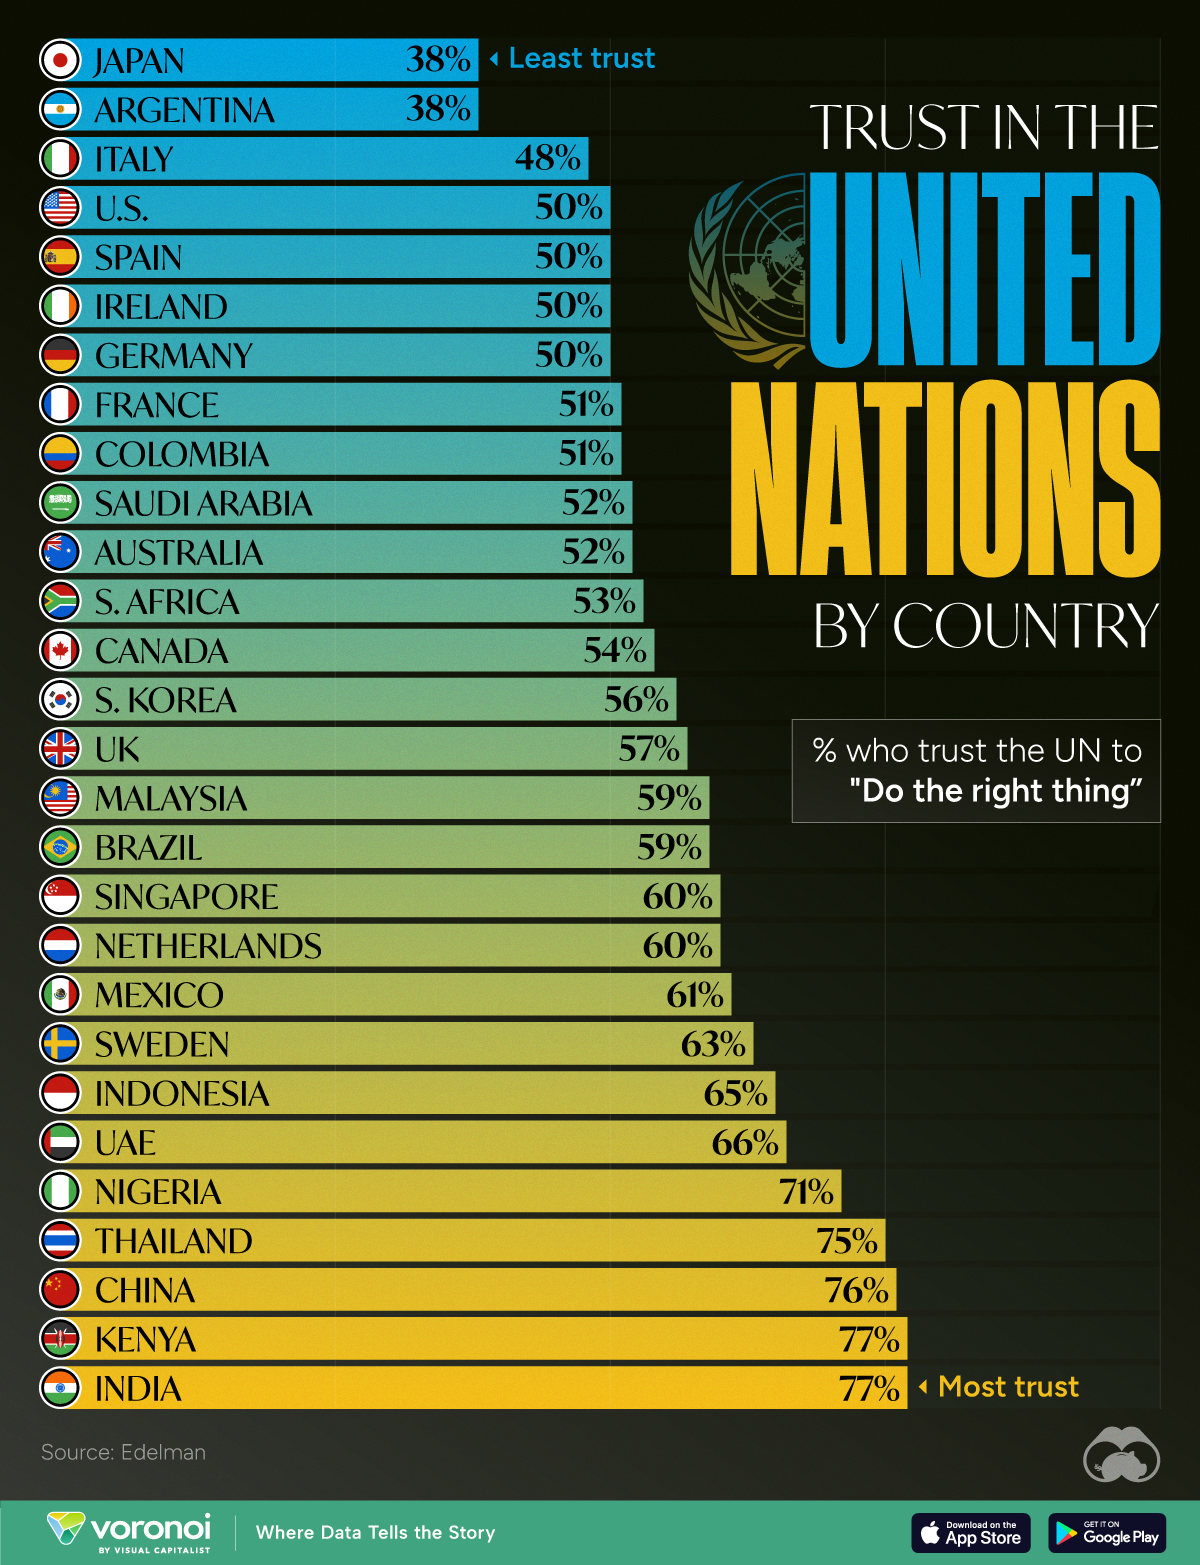
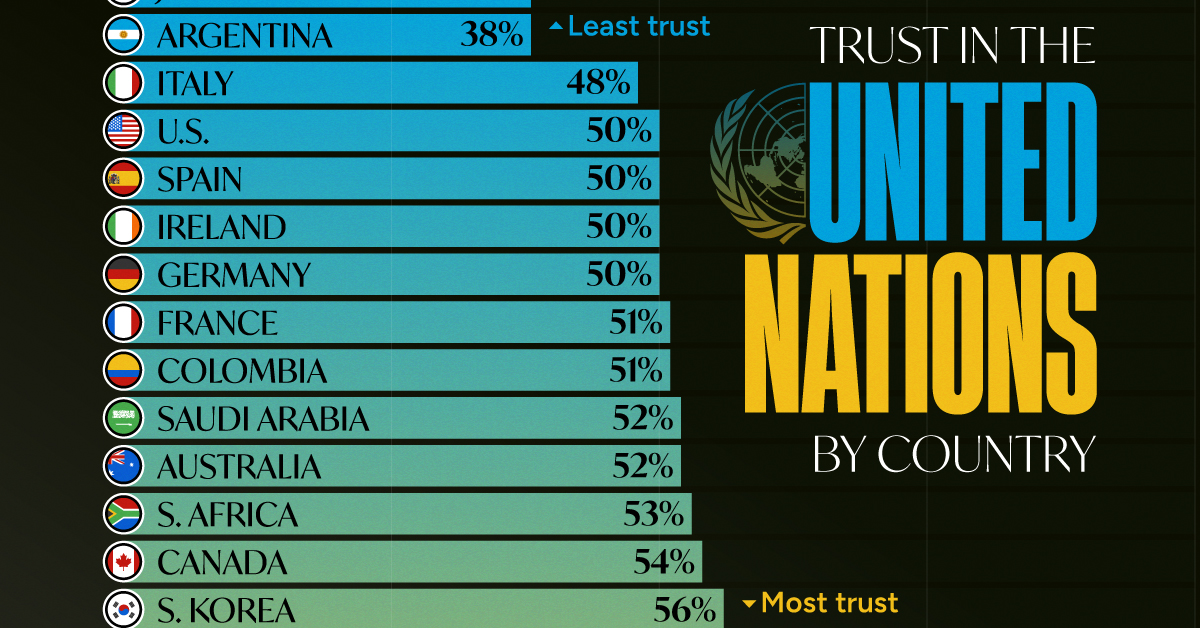
Ranked: 28 Countries Trust Levels in the United Nations in 2024
To gauge trust in the United Nations, Edelman surveyed more than 32,000 respondents between 28 countries in November 2023. Each country sample of 1,150 people is statistically significant and representative.
According to the results, respondents from Japan and Argentina had the least amount of trust in the UN when it came to “doing the right thing.”
| Country | % who trust the UN to "Do the right thing" |
|---|---|
| 🇯🇵 Japan | 38% |
| 🇦🇷 Argentina | 38% |
| 🇮🇹 Italy | 48% |
| 🇺🇸 U.S. | 50% |
| 🇪🇸 Spain | 50% |
| 🇮🇪 Ireland | 50% |
| 🇩🇪 Germany | 50% |
| 🇫🇷 France | 51% |
| 🇨🇴 Colombia | 51% |
| 🇸🇦 Saudi Arabia | 52% |
| 🇦🇺 Australia | 52% |
| 🇿🇦 South Africa | 53% |
| 🇨🇦 Canada | 54% |
| 🇰🇷 South Korea | 56% |
| 🇬🇧 UK | 57% |
| 🇲🇾 Malaysia | 59% |
| 🇧🇷 Brazil | 59% |
| 🇸🇬 Singapore | 60% |
| 🇳🇱 Netherlands | 60% |
| 🇲🇽 Mexico | 61% |
| 🇸🇪 Sweden | 63% |
| 🇮🇩 Indonesia | 65% |
| 🇦🇪 UAE | 66% |
| 🇳🇬 Nigeria | 71% |
| 🇹🇭 Thailand | 75% |
| 🇨🇳 China | 76% |
| 🇰🇪 Kenya | 77% |
| 🇮🇳 India | 77% |
Just 38% of Japanese and Argentinian people had faith in the UN, by far the lowest levels of trust. Only one other country was below the 50% trust mark: Italy at 48%.
Many major economies and G7 countries had trust levels hovering between 50–60%, including the U.S. and Germany at 50% and the UK at 57%.
Meanwhile, India and Kenya had the highest levels of trust in the UN at 77%, with China right behind at 76%. In general, African and Asian nations tended to have higher levels of trust in the UN, though there were exceptions like South Africa (53%) and South Korea (56%)
It’s also worth noting that views within countries can differ significantly. Separate data on this topic from Pew Research shows that public opinion of the UN is split along ideological lines. In the U.S., there’s a 45 percentage point difference, with more conservative respondents having significantly lower trust in the UN.

-

 Science1 week ago
Visualizing the Average Lifespans of Mammals
-

 Markets2 weeks ago
The Top 10 States by Real GDP Growth in 2023
-

 Demographics2 weeks ago
The Smallest Gender Wage Gaps in OECD Countries
-

 United States2 weeks ago
Where U.S. Inflation Hit the Hardest in March 2024
-

 Green2 weeks ago
Top Countries By Forest Growth Since 2001
-

 United States2 weeks ago
Ranked: The Largest U.S. Corporations by Number of Employees
-

 Maps2 weeks ago
The Largest Earthquakes in the New York Area (1970-2024)
-

 Green2 weeks ago
Ranked: The Countries With the Most Air Pollution in 2023