Politics
Charted: How Much Do Countries Trust the United Nations?
![]() See this visualization first on the Voronoi app.
See this visualization first on the Voronoi app.
How Much Do Countries Trust the United Nations?
This was originally posted on our Voronoi app. Download the app for free on iOS or Android and discover incredible data-driven charts from a variety of trusted sources.
Do you trust the United Nations (UN) in carrying out its objectives of maintaining peace and security, protecting human rights, and upholding international law?
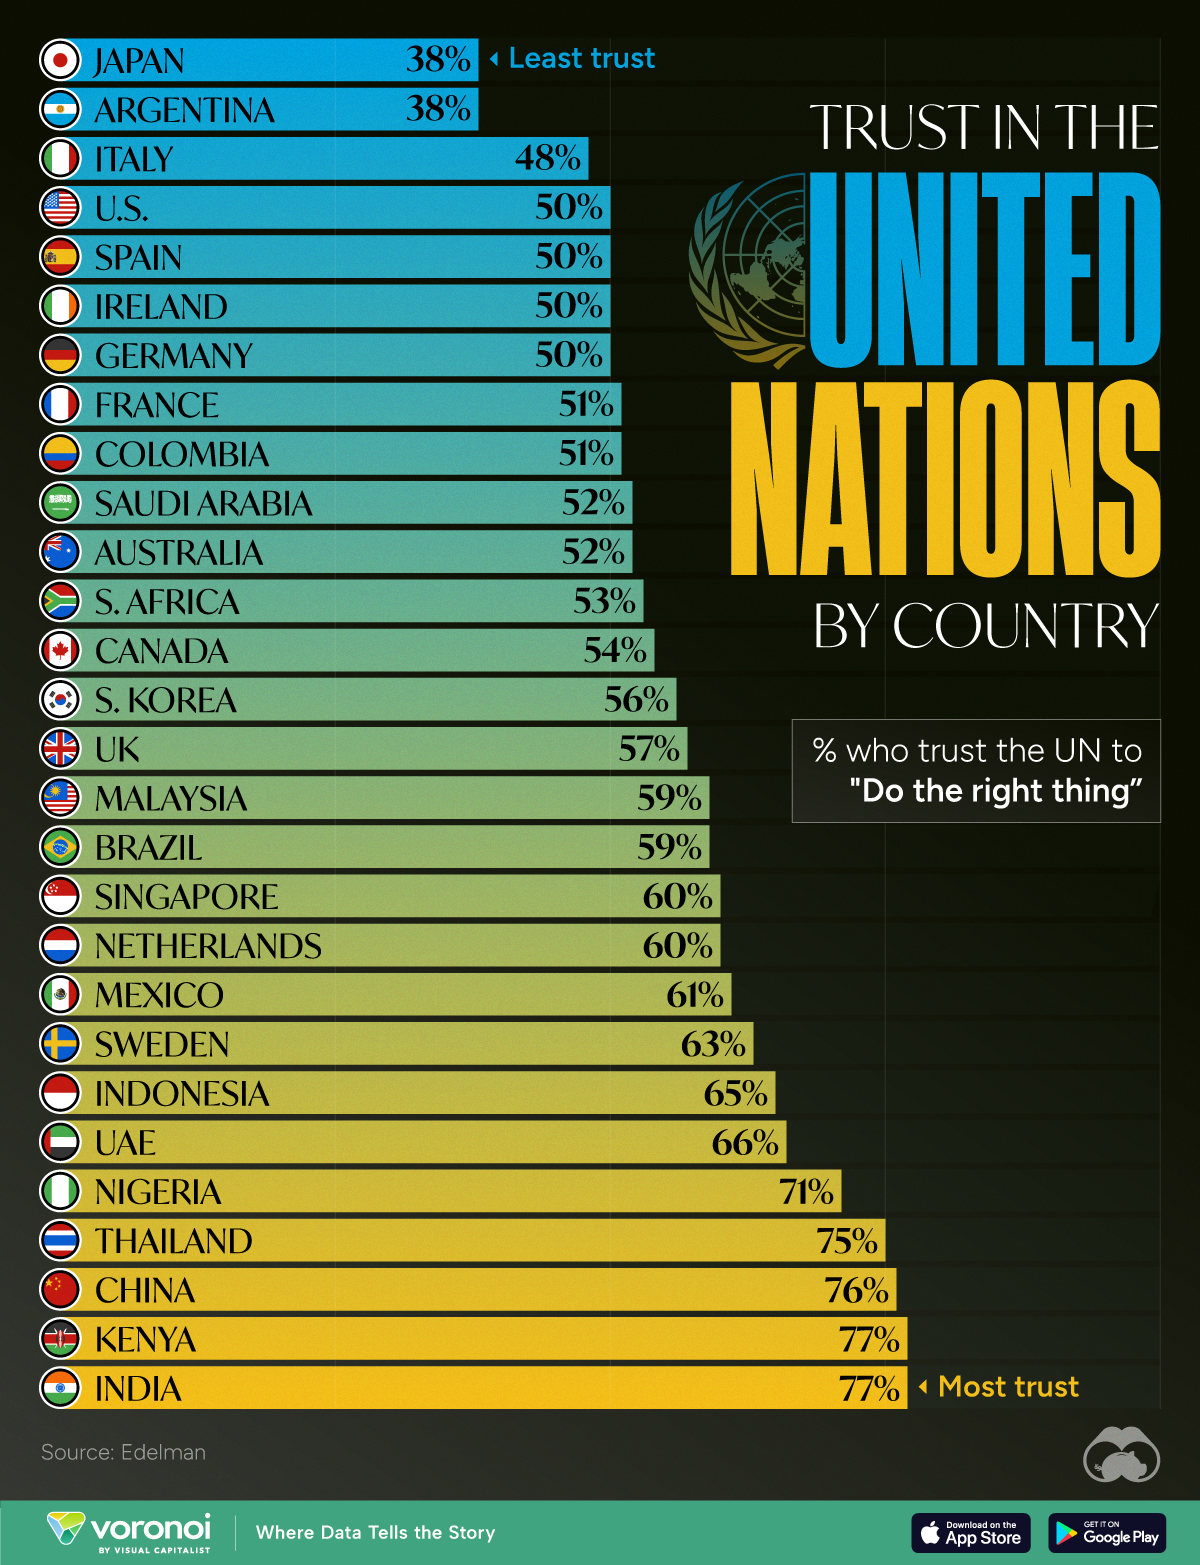
Survey results from Edelman’s 2024 Trust Barometer Global Report show that some countries’ citizens believe strongly in the UN to “do the right thing,” while others are less trusting.
Ranked: 28 Countries Trust Levels in the United Nations in 2024
To gauge trust in the United Nations, Edelman surveyed more than 32,000 respondents between 28 countries in November 2023. Each country sample of 1,150 people is statistically significant and representative.
According to the results, respondents from Japan and Argentina had the least amount of trust in the UN when it came to “doing the right thing.”
| Country | % who trust the UN to "Do the right thing" |
|---|---|
| 🇯🇵 Japan | 38% |
| 🇦🇷 Argentina | 38% |
| 🇮🇹 Italy | 48% |
| 🇺🇸 U.S. | 50% |
| 🇪🇸 Spain | 50% |
| 🇮🇪 Ireland | 50% |
| 🇩🇪 Germany | 50% |
| 🇫🇷 France | 51% |
| 🇨🇴 Colombia | 51% |
| 🇸🇦 Saudi Arabia | 52% |
| 🇦🇺 Australia | 52% |
| 🇿🇦 South Africa | 53% |
| 🇨🇦 Canada | 54% |
| 🇰🇷 South Korea | 56% |
| 🇬🇧 UK | 57% |
| 🇲🇾 Malaysia | 59% |
| 🇧🇷 Brazil | 59% |
| 🇸🇬 Singapore | 60% |
| 🇳🇱 Netherlands | 60% |
| 🇲🇽 Mexico | 61% |
| 🇸🇪 Sweden | 63% |
| 🇮🇩 Indonesia | 65% |
| 🇦🇪 UAE | 66% |
| 🇳🇬 Nigeria | 71% |
| 🇹🇭 Thailand | 75% |
| 🇨🇳 China | 76% |
| 🇰🇪 Kenya | 77% |
| 🇮🇳 India | 77% |
Just 38% of Japanese and Argentinian people had faith in the UN, by far the lowest levels of trust. Only one other country was below the 50% trust mark: Italy at 48%.
Many major economies and G7 countries had trust levels hovering between 50–60%, including the U.S. and Germany at 50% and the UK at 57%.
Meanwhile, India and Kenya had the highest levels of trust in the UN at 77%, with China right behind at 76%. In general, African and Asian nations tended to have higher levels of trust in the UN, though there were exceptions like South Africa (53%) and South Korea (56%)
It’s also worth noting that views within countries can differ significantly. Separate data on this topic from Pew Research shows that public opinion of the UN is split along ideological lines. In the U.S., there’s a 45 percentage point difference, with more conservative respondents having significantly lower trust in the UN.


Economy
The Bloc Effect: International Trade with Geopolitical Allies on the Rise
Rising geopolitical tensions are shaping the future of international trade, but what is the effect on trading among G7 and BRICS countries?


The Bloc Effect: International Trade with Allies on the Rise
International trade has become increasingly fragmented over the last five years as countries have shifted to trading more with their geopolitical allies.
This graphic from The Hinrich Foundation, the first in a three-part series covering the future of trade, provides visual context to the growing divide in trade in G7 and pre-expansion BRICS countries, which are used as proxies for geopolitical blocs.
Trade Shifts in G7 and BRICS Countries
This analysis uses IMF data to examine differences in shares of exports within and between trading blocs from 2018 to 2023. For example, we looked at the percentage of China’s exports with other BRICS members as well as with G7 members to see how these proportions shifted in percentage points (pp) over time.
Countries traded nearly $270 billion more with allies in 2023 compared to 2018. This shift came at the expense of trade with rival blocs, which saw a decline of $314 billion.
Country Change in Exports Within Bloc (pp) Change in Exports With Other Bloc (pp)
🇮🇳 India 0.0 3.9
🇷🇺 Russia 0.7 -3.8
🇮🇹 Italy 0.8 -0.7
🇨🇦 Canada 0.9 -0.7
🇫🇷 France 1.0 -1.1
🇪🇺 EU 1.1 -1.5
🇩🇪 Germany 1.4 -2.1
🇿🇦 South Africa 1.5 1.5
🇺🇸 U.S. 1.6 -0.4
🇯🇵 Japan 2.0 -1.7
🇨🇳 China 2.1 -5.2
🇧🇷 Brazil 3.7 -3.3
🇬🇧 UK 10.2 0.5
All shifts reported are in percentage points. For example, the EU saw its share of exports to G7 countries rise from 74.3% in 2018 to 75.4% in 2023, which equates to a 1.1 percentage point increase.
The UK saw the largest uptick in trading with other countries within the G7 (+10.2 percentage points), namely the EU, as the post-Brexit trade slump to the region recovered.
Meanwhile, the U.S.-China trade dispute caused China’s share of exports to the G7 to fall by 5.2 percentage points from 2018 to 2023, the largest decline in our sample set. In fact, partly as a result of the conflict, the U.S. has by far the highest number of harmful tariffs in place.
The Russia-Ukraine War and ensuing sanctions by the West contributed to Russia’s share of exports to the G7 falling by 3.8 percentage points over the same timeframe.
India, South Africa, and the UK bucked the trend and continued to witness advances in exports with the opposing bloc.
Average Trade Shifts of G7 and BRICS Blocs
Though results varied significantly on a country-by-country basis, the broader trend towards favoring geopolitical allies in international trade is clear.
Bloc Change in Exports Within Bloc (pp) Change in Exports With Other Bloc (pp)
Average 2.1 -1.1
BRICS 1.6 -1.4
G7 incl. EU 2.4 -1.0
Overall, BRICS countries saw a larger shift away from exports with the other bloc, while for G7 countries the shift within their own bloc was more pronounced. This implies that though BRICS countries are trading less with the G7, they are relying more on trade partners outside their bloc to make up for the lost G7 share.
A Global Shift in International Trade and Geopolitical Proximity
The movement towards strengthening trade relations based on geopolitical proximity is a global trend.
The United Nations categorizes countries along a scale of geopolitical proximity based on UN voting records.
According to the organization’s analysis, international trade between geopolitically close countries rose from the first quarter of 2022 (when Russia first invaded Ukraine) to the third quarter of 2023 by over 6%. Conversely, trade with geopolitically distant countries declined.
The second piece in this series will explore China’s gradual move away from using the U.S. dollar in trade settlements.
Visit the Hinrich Foundation to learn more about the future of geopolitical trade

-

 Economy2 days ago
Economic Growth Forecasts for G7 and BRICS Countries in 2024
The IMF has released its economic growth forecasts for 2024. How do the G7 and BRICS countries compare?
-

 United States2 weeks ago
Ranked: The Largest U.S. Corporations by Number of Employees
We visualized the top U.S. companies by employees, revealing the massive scale of retailers like Walmart, Target, and Home Depot.
-

 Economy2 weeks ago
Where U.S. Inflation Hit the Hardest in March 2024
We visualized product categories that saw the highest % increase in price due to U.S. inflation as of March 2024.
-

 Economy1 month ago
G20 Inflation Rates: Feb 2024 vs COVID Peak
We visualize inflation rates across G20 countries as of Feb 2024, in the context of their COVID-19 pandemic peak.
-

 Economy1 month ago
Mapped: Unemployment Claims by State
This visual heatmap of unemployment claims by state highlights New York, California, and Alaska leading the country by a wide margin.
-

 Economy2 months ago
Confidence in the Global Economy, by Country
Will the global economy be stronger in 2024 than in 2023?


-

 Debt1 week ago
How Debt-to-GDP Ratios Have Changed Since 2000
-

 Markets2 weeks ago
Ranked: The World’s Top Flight Routes, by Revenue
-

 Demographics2 weeks ago
Population Projections: The World’s 6 Largest Countries in 2075
-

 Markets2 weeks ago
The Top 10 States by Real GDP Growth in 2023
-

 Demographics2 weeks ago
The Smallest Gender Wage Gaps in OECD Countries
-
Economy2 weeks ago
Where U.S. Inflation Hit the Hardest in March 2024
-

 Green2 weeks ago
Top Countries By Forest Growth Since 2001
-
United States2 weeks ago
Ranked: The Largest U.S. Corporations by Number of Employees