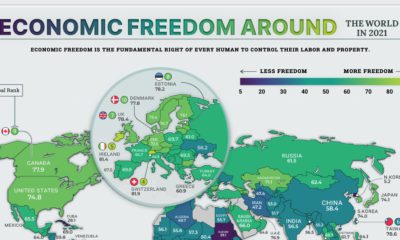

The global average economic freedom score is at the highest its been in 27 years. Here we map the economic freedom score of nearly every country.
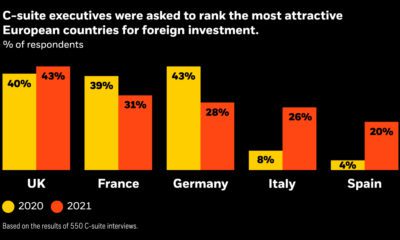

With the passing of a Brexit deal, is now the time to invest in UK equities? This data-driven infographic helps you decide.
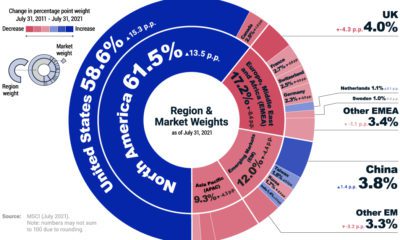

The MSCI ACWI Investable Market Index (IMI) covers 99% of the investable global equity market. Here, we show its region and market breakdown.
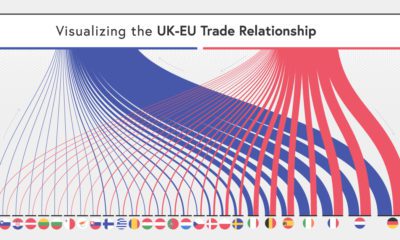

The UK and the EU have recently laid out new terms for their relationship. So how important is the UK's trade with the EU?
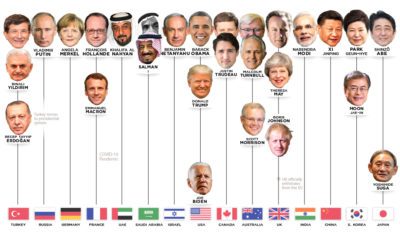

Who has led the world's 15 most powerful countries over the last 50 years? This visual looks at world leaders from 1970 to today.
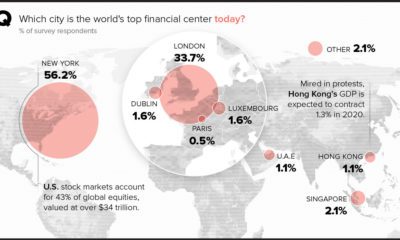

Perceptions of major financial centers are being reexamined amid shifts in the geopolitical landscape, including Brexit and unrest in Hong Kong.
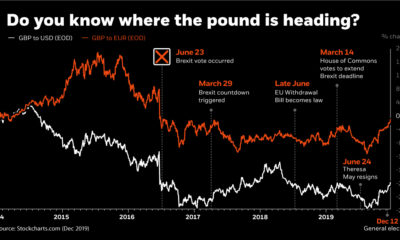

This infographic uses the recent Brexit-related volatility of the British pound to illustrate how currency risk can impact an investor's portfolio.
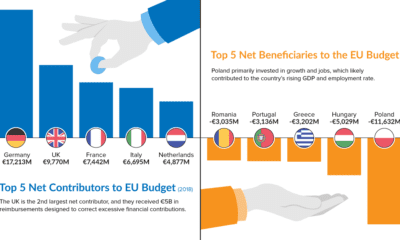

As Brexit looms, the EU budget is under the microscope. Learn which countries contribute the most—and least—to the bottom line in this chart.
Here are nine 'black swan' events in recent memory that profoundly changed markets, ranging from the Asian financial crisis of 1997 to the more current Brexit.
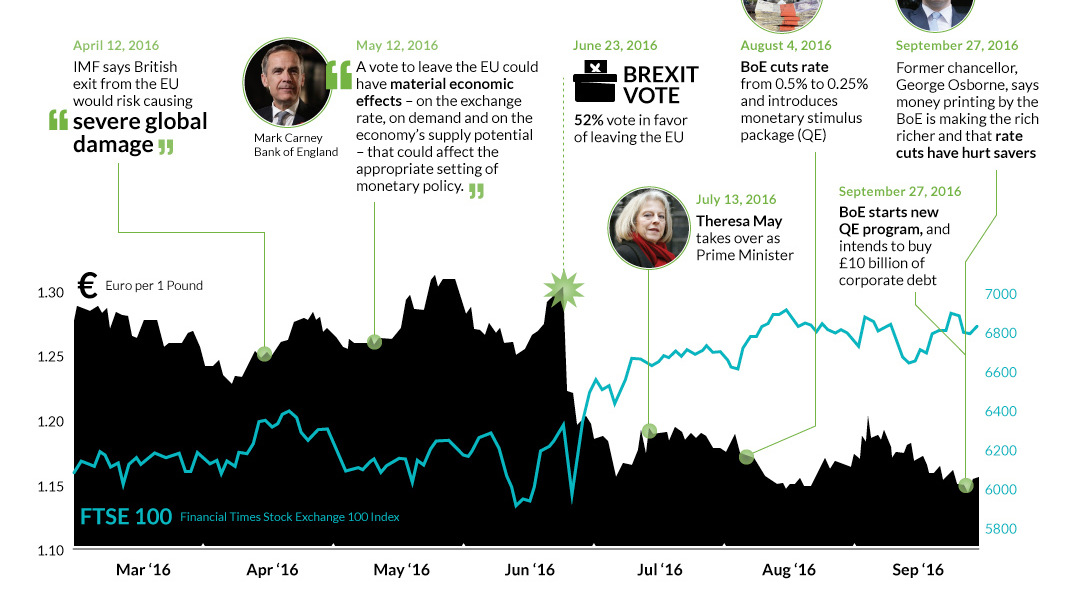
Many experts predicted a Brexit calamity if the UK voted to leave. Were they right? We look at the last three months and the aftermath of...