Wealth
Mapped: Where Do the Wealthiest People in the World Live?
![]() See this visualization first on the Voronoi app.
See this visualization first on the Voronoi app.
Where Do the Wealthiest People in the World Live?
This was originally posted on our Voronoi app. Download the app for free on iOS or Android and discover incredible data-driven charts from a variety of trusted sources.
Investors didn’t expect 2023 to be the bumper year for returns it ended up being. Despite tightening monetary policies and surging bond yields, equities continued their strong performance (helped hugely by enthusiasm around the potential of artificial intelligence).
This has boosted wealth creation, and the growth of ultra high net worth individuals (UHNWIs) in the world.
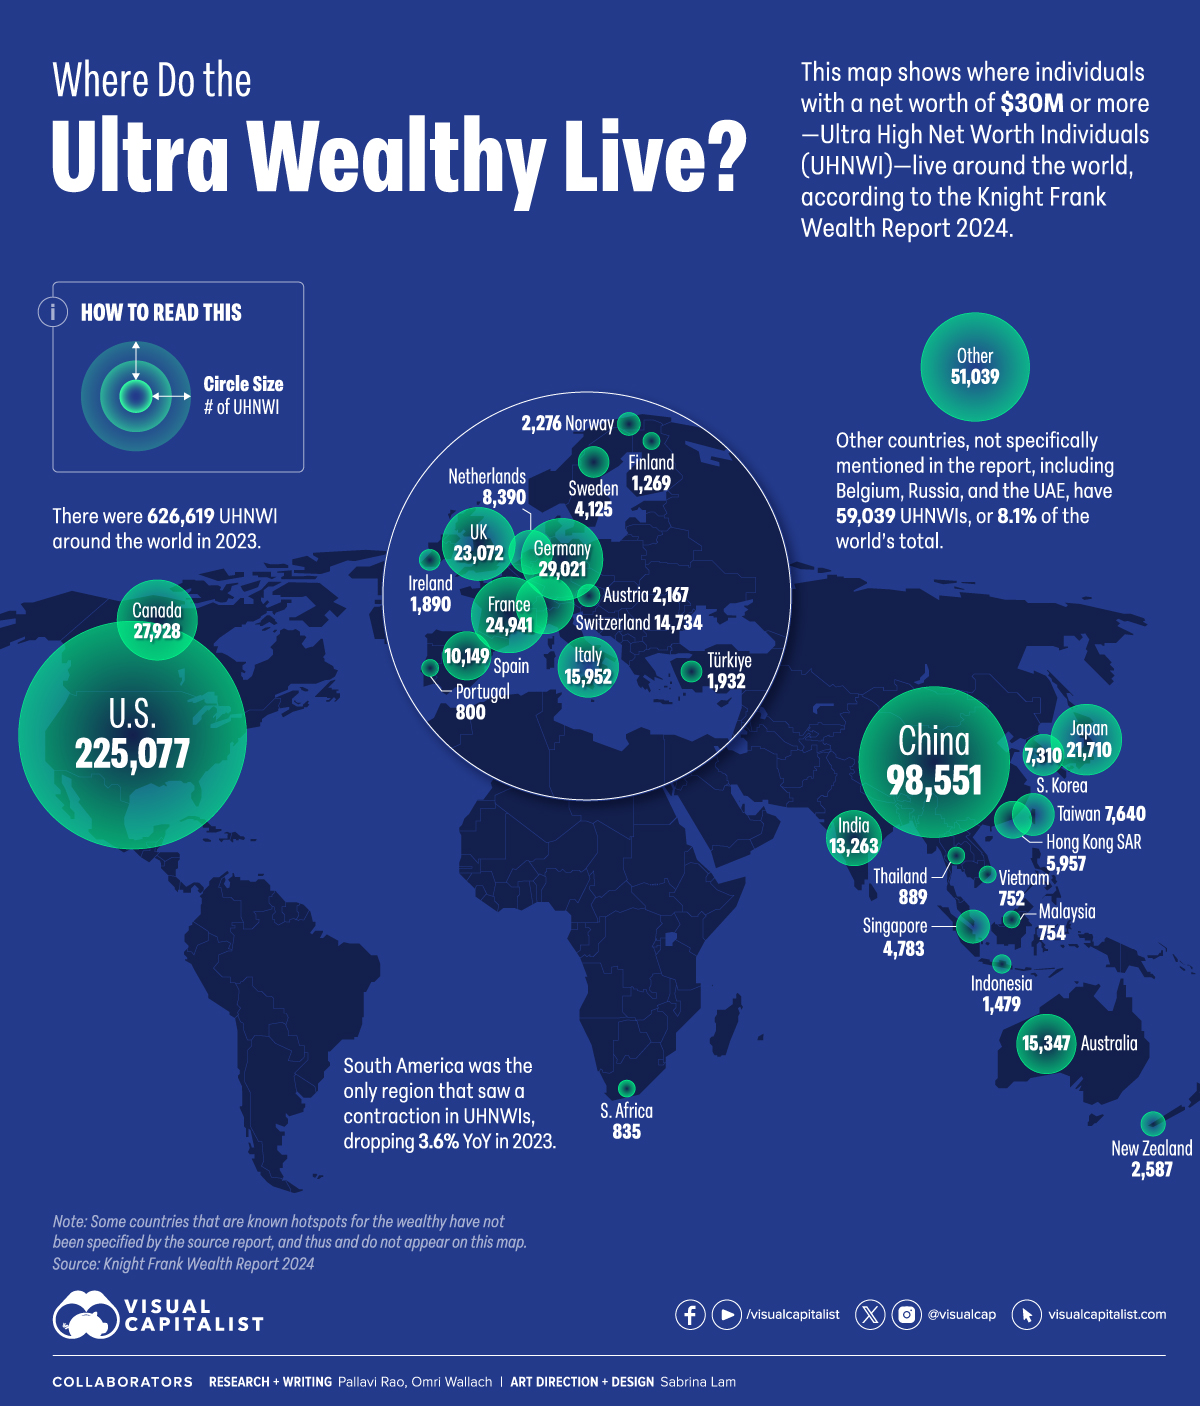
We map out where the 600,000+ UHNWIs reside, as of the end 2023. To be categorized as such, a person’s net worth needs to be higher than $30 million. This map uses data from the Knight Frank Wealth Report 2024.
It’s worth noting that some countries that are known hotspots for the wealthy—including Belgium, Saudi Arabia, the UAE, and Russia—do not have specified numbers in the source report and have not been covered in this map and article.
Ranked: Countries By Number of Ultra Wealthy Individuals
At the top of the ranks, accounting for more than one-third of the wealthiest in the world, the U.S. is home to 225,000 UHNWIs, more than double the number of 99,000 UHNWIs in China.
Together, the world’s two largest economies are home to 50% of the world’s wealthiest.
| Rank | Territory | UHNWI Population | YoY Growth | % of World UHNWIs |
|---|---|---|---|---|
| 1 | 🇺🇸 U.S. | 225,077 | +7.9% | 35.9% |
| 2 | 🇨🇳 China | 98,551 | +3.3% | 15.7% |
| 3 | 🇩🇪 Germany | 29,021 | +1.1% | 4.6% |
| 4 | 🇨🇦 Canada | 27,928 | +2.0% | 4.5% |
| 5 | 🇫🇷 France | 24,941 | +0.2% | 4.0% |
| 6 | 🇬🇧 UK | 23,072 | +3.1% | 3.7% |
| 7 | 🇯🇵 Japan | 21,710 | +0.3% | 3.5% |
| 8 | 🇮🇹 Italy | 15,952 | +3.8% | 2.5% |
| 9 | 🇦🇺 Australia | 15,347 | +2.9% | 2.4% |
| 10 | 🇨🇭 Switzerland | 14,734 | +5.2% | 2.4% |
| 11 | 🇮🇳 India | 13,263 | +6.1% | 2.1% |
| 12 | 🇪🇸 Spain | 10,149 | +1.7% | 1.6% |
| 13 | 🇳🇱 Netherlands | 8,390 | +0.2% | 1.3% |
| 14 | 🇹🇼 Taiwan | 7,640 | -0.3% | 1.2% |
| 15 | 🇰🇷 South Korea | 7,310 | +5.6% | 1.2% |
| 16 | 🇭🇰 Hong Kong | 5,957 | +2.5% | 1.0% |
| 17 | 🇸🇬 Singapore | 4,783 | +4.0% | 0.8% |
| 18 | 🇸🇪 Sweden | 4,125 | +2.5% | 0.7% |
| 19 | 🇳🇿 New Zealand | 2,587 | +2.9% | 0.4% |
| 20 | 🇳🇴 Norway | 2,276 | +1.1% | 0.4% |
| 21 | 🇦🇹 Austria | 2,167 | +0.3% | 0.3% |
| 22 | 🇹🇷 Türkiye | 1,932 | +9.7% | 0.3% |
| 23 | 🇮🇪 Ireland | 1,890 | +0.4% | 0.3% |
| 24 | 🇮🇩 Indonesia | 1,479 | +4.2% | 0.2% |
| 25 | 🇫🇮 Finland | 1,269 | +4.1% | 0.2% |
| 26 | 🇹🇭 Thailand | 889 | +0.8% | 0.1% |
| 27 | 🇿🇦 South Africa | 835 | -1.3% | 0.1% |
| 28 | 🇵🇹 Portugal | 800 | +3.0% | 0.1% |
| 29 | 🇲🇾 Malaysia | 754 | +4.3% | 0.1% |
| 30 | 🇻🇳 Vietnam | 752 | +2.4% | 0.1% |
| N/A | 🌐 Other | 51,039 | +0.1% | 8.1% |
| N/A | 🌍 World | 626,619 | +4.2% | N/A |
Note: The organization uses a dynamic proprietary wealth-sizing model created by their data engineering team to arrive at these figures. Exact numbers may change between different editions of this report.
Ranked third, Germany, has close to 30,000 UHNWIs, following the pattern of the biggest economic powerhouses having the highest share of the wealthy.
This correlation remains generally constant outside the top three as well, even if exact positions aren’t quite maintained:
- Canada, 10th largest economy, 4th in share of wealthiest people.
- Australia, 14th largest economy, 9th in wealthiest people.
- Switzerland, 20th largest economy, 10th in wealthiest people.
- India, 6th largest economy, 11th in wealthiest people.
Together, these top countries by share of UHNWIs account for 92% of all individuals with a net worth greater than $30 million.
Other countries, not specifically mentioned in the report, have 59,039 UHNWIs, or 8.1% of the world’s total.
Ranked: Regions By Number of Ultra Wealthy Individuals
Unsurprisingly, buoyed by the U.S. and China, North America and Asia are the top two regions by wealthiest individuals.
Europe is close behind Asia however; a reminder of the region’s collective economic might.
| Rank | Region | UHNWI Population | YoY Growth |
|---|---|---|---|
| 1 | North America | 253,066 | +7.2% |
| 2 | Asia | 165,442 | +2.6% |
| 3 | Europe | 155,232 | +1.8% |
| 4 | Middle East | 18,790 | +6.2% |
| 5 | Oceania | 17,934 | +2.9% |
| 6 | South America | 13,159 | -3.6% |
| 7 | Africa | 2,996 | +3.8% |
The oil-rich Middle East also outperforms on the wealthy individuals metric and saw the highest YoY growth in the ultra-wealthy after North America.
The world as a whole grew its UHNWI population by 4.2% and only South America saw a contraction in numbers between 2022 and 2023.
Where Does This Data Come From?
Source: Knight Frank Wealth Report 2024.
Note: Some countries that are known hotspots for the wealthy, including Belgium, Saudi Arabia, the UAE, and Russia have not been specified by the source report, and thus do not appear on this map.


Money
Charted: Which City Has the Most Billionaires in 2024?
Just two countries account for half of the top 20 cities with the most billionaires. And the majority of the other half are found in Asia.


Charted: Which Country Has the Most Billionaires in 2024?
This was originally posted on our Voronoi app. Download the app for free on iOS or Android and discover incredible data-driven charts from a variety of trusted sources.
Some cities seem to attract the rich. Take New York City for example, which has 340,000 high-net-worth residents with investable assets of more than $1 million.
But there’s a vast difference between being a millionaire and a billionaire. So where do the richest of them all live?
Using data from the Hurun Global Rich List 2024, we rank the top 20 cities with the highest number of billionaires in 2024.
A caveat to these rich lists: sources often vary on figures and exact rankings. For example, in last year’s reports, Forbes had New York as the city with the most billionaires, while the Hurun Global Rich List placed Beijing at the top spot.
Ranked: Top 20 Cities with the Most Billionaires in 2024
The Chinese economy’s doldrums over the course of the past year have affected its ultra-wealthy residents in key cities.
Beijing, the city with the most billionaires in 2023, has not only ceded its spot to New York, but has dropped to #4, overtaken by London and Mumbai.
| Rank | City | Billionaires | Rank Change YoY |
|---|---|---|---|
| 1 | 🇺🇸 New York | 119 | +1 |
| 2 | 🇬🇧 London | 97 | +3 |
| 3 | 🇮🇳 Mumbai | 92 | +4 |
| 4 | 🇨🇳 Beijing | 91 | -3 |
| 5 | 🇨🇳 Shanghai | 87 | -2 |
| 6 | 🇨🇳 Shenzhen | 84 | -2 |
| 7 | 🇭🇰 Hong Kong | 65 | -1 |
| 8 | 🇷🇺 Moscow | 59 | No Change |
| 9 | 🇮🇳 New Delhi | 57 | +6 |
| 10 | 🇺🇸 San Francisco | 52 | No Change |
| 11 | 🇹🇭 Bangkok | 49 | +2 |
| 12 | 🇹🇼 Taipei | 45 | +2 |
| 13 | 🇫🇷 Paris | 44 | -2 |
| 14 | 🇨🇳 Hangzhou | 43 | -5 |
| 15 | 🇸🇬 Singapore | 42 | New to Top 20 |
| 16 | 🇨🇳 Guangzhou | 39 | -4 |
| 17T | 🇮🇩 Jakarta | 37 | +1 |
| 17T | 🇧🇷 Sao Paulo | 37 | No Change |
| 19T | 🇺🇸 Los Angeles | 31 | No Change |
| 19T | 🇰🇷 Seoul | 31 | -3 |
In fact all Chinese cities on the top 20 list have lost billionaires between 2023–24. Consequently, they’ve all lost ranking spots as well, with Hangzhou seeing the biggest slide (-5) in the top 20.
Where China lost, all other Asian cities—except Seoul—in the top 20 have gained ranks. Indian cities lead the way, with New Delhi (+6) and Mumbai (+3) having climbed the most.
At a country level, China and the U.S combine to make up half of the cities in the top 20. They are also home to about half of the world’s 3,200 billionaire population.
In other news of note: Hurun officially counts Taylor Swift as a billionaire, estimating her net worth at $1.2 billion.

-

 Education1 week ago
How Hard Is It to Get Into an Ivy League School?
-

 Technology2 weeks ago
Ranked: Semiconductor Companies by Industry Revenue Share
-

 Markets2 weeks ago
Ranked: The World’s Top Flight Routes, by Revenue
-

 Demographics2 weeks ago
Population Projections: The World’s 6 Largest Countries in 2075
-

 Markets2 weeks ago
The Top 10 States by Real GDP Growth in 2023
-

 Demographics2 weeks ago
The Smallest Gender Wage Gaps in OECD Countries
-

 Economy2 weeks ago
Where U.S. Inflation Hit the Hardest in March 2024
-

 Environment2 weeks ago
Top Countries By Forest Growth Since 2001