Markets
Visualizing 60 Years of Stock Market Cycles
Subscribe to the Advisor Channel free mailing list for more like this
Visualizing 60 Years of Stock Market Cycles
This was originally posted on Advisor Channel. Sign up to the free mailing list to get beautiful visualizations on financial markets that help advisors and their clients.
Today’s stock market is nothing short of unusual.
The S&P 500 has climbed over 24% to date against a backdrop of strong economic growth and rising interest rates. Despite these factors, the unemployment rate has remained low at 3.7% as of November, and inflation has moderated.
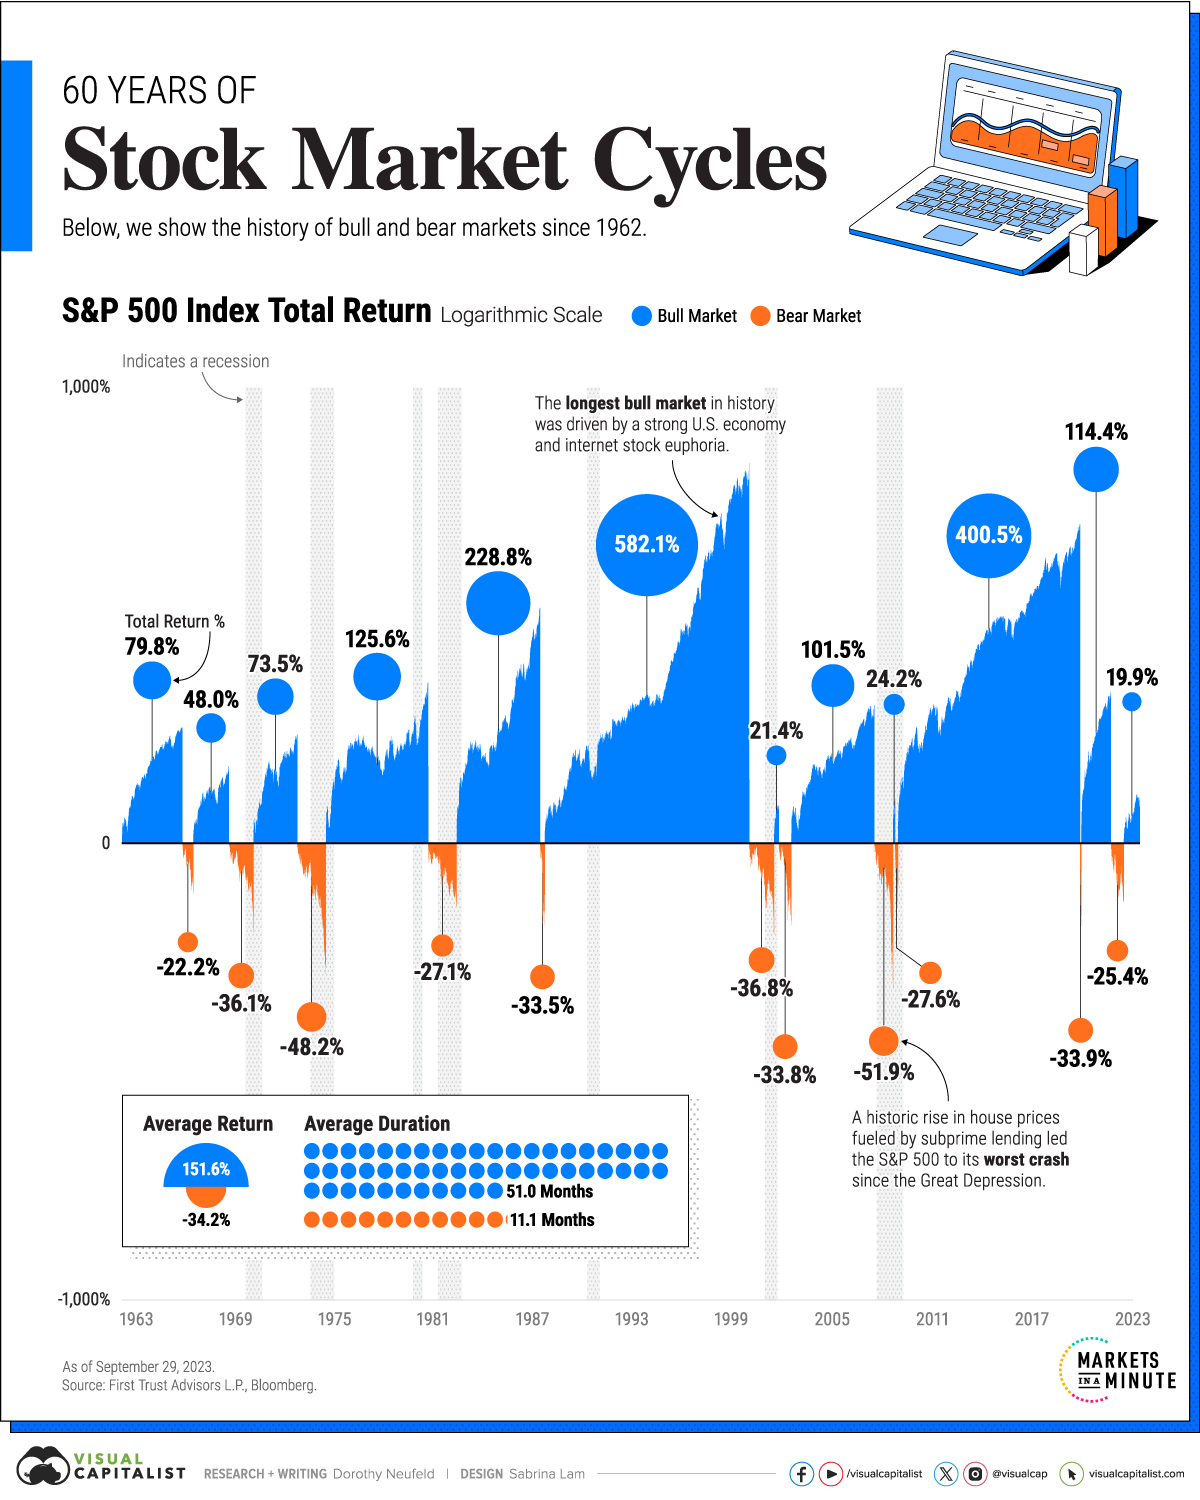
To give some context on the current stock market cycle, this graphic shows 60 years of bull and bear markets, with data from First Trust.
Bulls and Bears Over History
A bear market takes place when a stock market index declines 20% from its peak.
Once stocks fully recover and exceed this peak, it enters a bull market. This can happen over the course of months or years. But as the table below shows, bear markets have been much shorter than bull markets since 1962:
| Market | Average Return* | Average Duration |
|---|---|---|
| 📈 Bull Market | +151.6% | 51.0 Months |
| 📉 Bear Market | -34.2% | 11.1 Months |
*As of September 29, 2022.
The longest bear markets over this period were in the early 1970s and 1980s, both lasting roughly 20 months. In both cases, high inflation led the Fed to tighten monetary policy, triggering each recession. In 1974, the S&P plummeted 48.2% from its peak, in one of the sharpest declines since WWII.
On the other hand, the longest bull market took place through the 1990s amid a roaring U.S. economy. Lasting over 12 years, it reached an apex during the Dotcom boom. Over the course of the bull market, the S&P 500 advanced 582.1%.
After the 2008 Global Financial Crisis, the stock market witnessed another expansive bull run, this time lasting 11 years. Ultra-low interest rates and the outperformance of big tech in particular defined the cycle.
In many cases, stock market peaks happen before a recession begins. Consider how in 2007, the S&P 500 hit a high in October before the recession officially began in December. Similarly, the S&P 500 peaked in September 2000, six months before the 2001 recession officially started.
How Can Investors Prepare for a Bear Market?
No one knows when a bear market will begin, but there are strategies that investors can use to build a more resilient portfolio.
Diversifying across sectors is one approach. Consider how cyclical sectors, such as tech and real estate tend to rise when the market is on the upswing. By contrast, when the market takes a turn, traditionally more defensive sectors like consumer staples outperform.
Asset class diversification is another tactic. Including bonds in a portfolio typically reduces risk given their stable cash flows and historically low correlation to stocks. International stocks also have a lower correlation to U.S. equities which means that when U.S. stocks are down, these types of assets can help buffer the loss.
The good news is that the S&P 500 has seen +11.5% average historical returns since 1928. Overall, the majority of stock market cycles take place in bull territory both in terms of net return appreciation and length of time by a wide margin.


Markets
The European Stock Market: Attractive Valuations Offer Opportunities
On average, the European stock market has valuations that are nearly 50% lower than U.S. valuations. But how can you access the market?


European Stock Market: Attractive Valuations Offer Opportunities
Europe is known for some established brands, from L’Oréal to Louis Vuitton. However, the European stock market offers additional opportunities that may be lesser known.
The above infographic, sponsored by STOXX, outlines why investors may want to consider European stocks.
Attractive Valuations
Compared to most North American and Asian markets, European stocks offer lower or comparable valuations.
| Index | Price-to-Earnings Ratio | Price-to-Book Ratio |
|---|---|---|
| EURO STOXX 50 | 14.9 | 2.2 |
| STOXX Europe 600 | 14.4 | 2 |
| U.S. | 25.9 | 4.7 |
| Canada | 16.1 | 1.8 |
| Japan | 15.4 | 1.6 |
| Asia Pacific ex. China | 17.1 | 1.8 |
Data as of February 29, 2024. See graphic for full index names. Ratios based on trailing 12 month financials. The price to earnings ratio excludes companies with negative earnings.
On average, European valuations are nearly 50% lower than U.S. valuations, potentially offering an affordable entry point for investors.
Research also shows that lower price ratios have historically led to higher long-term returns.
Market Movements Not Closely Connected
Over the last decade, the European stock market had low-to-moderate correlation with North American and Asian equities.
The below chart shows correlations from February 2014 to February 2024. A value closer to zero indicates low correlation, while a value of one would indicate that two regions are moving in perfect unison.
| EURO STOXX 50 | STOXX EUROPE 600 | U.S. | Canada | Japan | Asia Pacific ex. China |
|
|---|---|---|---|---|---|---|
| EURO STOXX 50 | 1.00 | 0.97 | 0.55 | 0.67 | 0.24 | 0.43 |
| STOXX EUROPE 600 | 1.00 | 0.56 | 0.71 | 0.28 | 0.48 | |
| U.S. | 1.00 | 0.73 | 0.12 | 0.25 | ||
| Canada | 1.00 | 0.22 | 0.40 | |||
| Japan | 1.00 | 0.88 | ||||
| Asia Pacific ex. China | 1.00 |
Data is based on daily USD returns.
European equities had relatively independent market movements from North American and Asian markets. One contributing factor could be the differing sector weights in each market. For instance, technology makes up a quarter of the U.S. market, but health care and industrials dominate the broader European market.
Ultimately, European equities can enhance portfolio diversification and have the potential to mitigate risk for investors.
Tracking the Market
For investors interested in European equities, STOXX offers a variety of flagship indices:
| Index | Description | Market Cap |
|---|---|---|
| STOXX Europe 600 | Pan-regional, broad market | €10.5T |
| STOXX Developed Europe | Pan-regional, broad-market | €9.9T |
| STOXX Europe 600 ESG-X | Pan-regional, broad market, sustainability focus | €9.7T |
| STOXX Europe 50 | Pan-regional, blue-chip | €5.1T |
| EURO STOXX 50 | Eurozone, blue-chip | €3.5T |
Data is as of February 29, 2024. Market cap is free float, which represents the shares that are readily available for public trading on stock exchanges.
The EURO STOXX 50 tracks the Eurozone’s biggest and most traded companies. It also underlies one of the world’s largest ranges of ETFs and mutual funds. As of November 2023, there were €27.3 billion in ETFs and €23.5B in mutual fund assets under management tracking the index.
“For the past 25 years, the EURO STOXX 50 has served as an accurate, reliable and tradable representation of the Eurozone equity market.”
— Axel Lomholt, General Manager at STOXX
Partnering with STOXX to Track the European Stock Market
Are you interested in European equities? STOXX can be a valuable partner:
- Comprehensive, liquid and investable ecosystem
- European heritage, global reach
- Highly sophisticated customization capabilities
- Open architecture approach to using data
- Close partnerships with clients
- Part of ISS STOXX and Deutsche Börse Group
With a full suite of indices, STOXX can help you benchmark against the European stock market.
Learn how STOXX’s European indices offer liquid and effective market access.

-

 Economy2 days ago
Economic Growth Forecasts for G7 and BRICS Countries in 2024
The IMF has released its economic growth forecasts for 2024. How do the G7 and BRICS countries compare?
-

 Markets1 week ago
U.S. Debt Interest Payments Reach $1 Trillion
U.S. debt interest payments have surged past the $1 trillion dollar mark, amid high interest rates and an ever-expanding debt burden.
-

 United States2 weeks ago
Ranked: The Largest U.S. Corporations by Number of Employees
We visualized the top U.S. companies by employees, revealing the massive scale of retailers like Walmart, Target, and Home Depot.
-

 Markets2 weeks ago
The Top 10 States by Real GDP Growth in 2023
This graphic shows the states with the highest real GDP growth rate in 2023, largely propelled by the oil and gas boom.
-

 Markets2 weeks ago
Ranked: The World’s Top Flight Routes, by Revenue
In this graphic, we show the highest earning flight routes globally as air travel continued to rebound in 2023.
-

 Markets2 weeks ago
Ranked: The Most Valuable Housing Markets in America
The U.S. residential real estate market is worth a staggering $47.5 trillion. Here are the most valuable housing markets in the country.


-

 Education1 week ago
How Hard Is It to Get Into an Ivy League School?
-

 Technology2 weeks ago
Ranked: Semiconductor Companies by Industry Revenue Share
-
Markets2 weeks ago
Ranked: The World’s Top Flight Routes, by Revenue
-

 Demographics2 weeks ago
Population Projections: The World’s 6 Largest Countries in 2075
-
Markets2 weeks ago
The Top 10 States by Real GDP Growth in 2023
-

 Demographics2 weeks ago
The Smallest Gender Wage Gaps in OECD Countries
-

 Economy2 weeks ago
Where U.S. Inflation Hit the Hardest in March 2024
-

 Environment2 weeks ago
Top Countries By Forest Growth Since 2001