Markets
Ranking the Top S&P 500 Stocks by 5-Year Returns
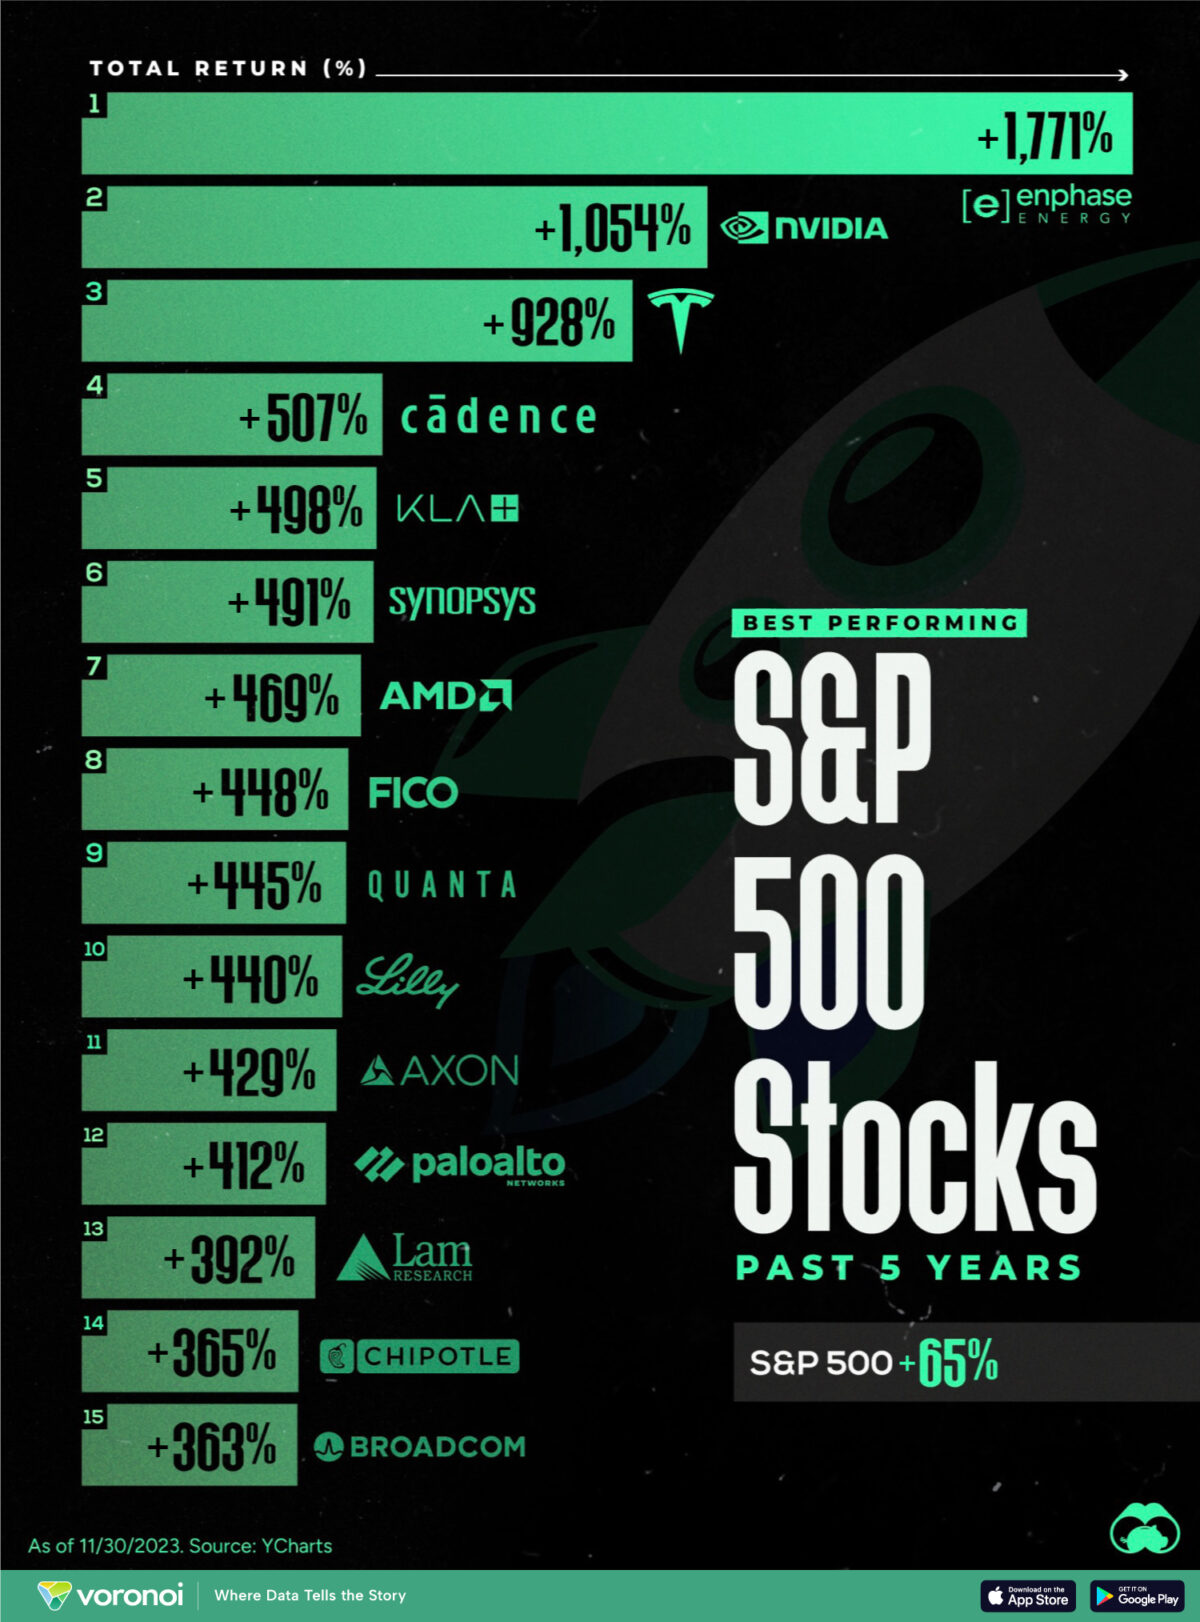
Ranking the Top S&P 500 Stocks by 5-Year Returns
Despite economic challenges, S&P 500 stocks have demonstrated resilience, delivering significant gains over time.
In this graphic, utilizing data from YCharts, we’ve ranked the best-performing S&P 500 stocks based on their 5-year total returns as of November 2023.
IT Companies Top the List
Surprisingly, neither Tesla nor Nvidia claims the number one spot on this list.
Enphase Energy, a California-based producer of solar components and EV charging stations, secures the top position. The company provides a semiconductor-based microinverter that converts energy at the solar module level, energy monitoring technology, and control services.
According to Affinity Syntax, Enphase Energy generates over 80% of its revenue from the U.S. market.
| Company | Sector | 5 Year Total Return |
|---|---|---|
| Enphase Energy (ENPH) | 🖥️ Information Technology | 1,771% |
| NVIDIA (NVDA) | 🖥️ Information Technology | 1,054% |
| Tesla (TSLA) | 🛍️ Consumer Discretionary | 928% |
| Cadence Design Systems (CDNS) | 🖥️ Information Technology | 507% |
| KLA Corp (KLAC) | 🖥️ Information Technology | 498% |
| Synopsys (SNPS) | 🖥️ Information Technology | 491% |
| Advanced Micro Devices (AMD) | 🖥️ Information Technology | 469% |
| Fair Isaac (FICO) | 🖥️ Information Technology | 448% |
| Quanta Services (PWR) | 🏭 Industrials | 445% |
| Eli Lilly and Co (LLY) | 🚑 Health Care | 440% |
| Axon Enterprise (AXON) | 🏭 Industrials | 429% |
| Palo Alto Networks (PANW) | 🖥️ Information Technology | 412% |
| Lam Research (LRCX) | 🖥️ Information Technology | 392% |
| Chipotle Mexican Grill (CMG) | 🛍️ Consumer Discretionary | 365% |
| Broadcom (AVGO) | 🖥️ Information Technology | 363% |
Despite leading this list, Enphase Energy’s stock has performed poorly since December 2022, plummeting by more than 60%.
In the second position is chipmaker Nvidia. This year, America’s largest semiconductor company surpassed the $1 trillion market capitalization mark, a milestone achieved by just a handful of companies, including Apple, Amazon, and Microsoft.
Tesla holds the third spot. The automaker increased its output by a respectable 40% in 2022, outpacing Western brands like Volkswagen (+10%) and GM (+13%). However, it was surpassed by Chinese BYD, which became the top-selling EV brand globally.
The list is dominated by IT companies, with 10 of 15, but also includes two consumer discretionary and two industrial companies. Pharmaceutical giant Eli Lilly the sole health care company on our list.


Markets
The European Stock Market: Attractive Valuations Offer Opportunities
On average, the European stock market has valuations that are nearly 50% lower than U.S. valuations. But how can you access the market?


European Stock Market: Attractive Valuations Offer Opportunities
Europe is known for some established brands, from L’Oréal to Louis Vuitton. However, the European stock market offers additional opportunities that may be lesser known.
The above infographic, sponsored by STOXX, outlines why investors may want to consider European stocks.
Attractive Valuations
Compared to most North American and Asian markets, European stocks offer lower or comparable valuations.
| Index | Price-to-Earnings Ratio | Price-to-Book Ratio |
|---|---|---|
| EURO STOXX 50 | 14.9 | 2.2 |
| STOXX Europe 600 | 14.4 | 2 |
| U.S. | 25.9 | 4.7 |
| Canada | 16.1 | 1.8 |
| Japan | 15.4 | 1.6 |
| Asia Pacific ex. China | 17.1 | 1.8 |
Data as of February 29, 2024. See graphic for full index names. Ratios based on trailing 12 month financials. The price to earnings ratio excludes companies with negative earnings.
On average, European valuations are nearly 50% lower than U.S. valuations, potentially offering an affordable entry point for investors.
Research also shows that lower price ratios have historically led to higher long-term returns.
Market Movements Not Closely Connected
Over the last decade, the European stock market had low-to-moderate correlation with North American and Asian equities.
The below chart shows correlations from February 2014 to February 2024. A value closer to zero indicates low correlation, while a value of one would indicate that two regions are moving in perfect unison.
| EURO STOXX 50 | STOXX EUROPE 600 | U.S. | Canada | Japan | Asia Pacific ex. China |
|
|---|---|---|---|---|---|---|
| EURO STOXX 50 | 1.00 | 0.97 | 0.55 | 0.67 | 0.24 | 0.43 |
| STOXX EUROPE 600 | 1.00 | 0.56 | 0.71 | 0.28 | 0.48 | |
| U.S. | 1.00 | 0.73 | 0.12 | 0.25 | ||
| Canada | 1.00 | 0.22 | 0.40 | |||
| Japan | 1.00 | 0.88 | ||||
| Asia Pacific ex. China | 1.00 |
Data is based on daily USD returns.
European equities had relatively independent market movements from North American and Asian markets. One contributing factor could be the differing sector weights in each market. For instance, technology makes up a quarter of the U.S. market, but health care and industrials dominate the broader European market.
Ultimately, European equities can enhance portfolio diversification and have the potential to mitigate risk for investors.
Tracking the Market
For investors interested in European equities, STOXX offers a variety of flagship indices:
| Index | Description | Market Cap |
|---|---|---|
| STOXX Europe 600 | Pan-regional, broad market | €10.5T |
| STOXX Developed Europe | Pan-regional, broad-market | €9.9T |
| STOXX Europe 600 ESG-X | Pan-regional, broad market, sustainability focus | €9.7T |
| STOXX Europe 50 | Pan-regional, blue-chip | €5.1T |
| EURO STOXX 50 | Eurozone, blue-chip | €3.5T |
Data is as of February 29, 2024. Market cap is free float, which represents the shares that are readily available for public trading on stock exchanges.
The EURO STOXX 50 tracks the Eurozone’s biggest and most traded companies. It also underlies one of the world’s largest ranges of ETFs and mutual funds. As of November 2023, there were €27.3 billion in ETFs and €23.5B in mutual fund assets under management tracking the index.
“For the past 25 years, the EURO STOXX 50 has served as an accurate, reliable and tradable representation of the Eurozone equity market.”
— Axel Lomholt, General Manager at STOXX
Partnering with STOXX to Track the European Stock Market
Are you interested in European equities? STOXX can be a valuable partner:
- Comprehensive, liquid and investable ecosystem
- European heritage, global reach
- Highly sophisticated customization capabilities
- Open architecture approach to using data
- Close partnerships with clients
- Part of ISS STOXX and Deutsche Börse Group
With a full suite of indices, STOXX can help you benchmark against the European stock market.
Learn how STOXX’s European indices offer liquid and effective market access.

-

 Economy3 days ago
Economic Growth Forecasts for G7 and BRICS Countries in 2024
The IMF has released its economic growth forecasts for 2024. How do the G7 and BRICS countries compare?
-

 Markets2 weeks ago
U.S. Debt Interest Payments Reach $1 Trillion
U.S. debt interest payments have surged past the $1 trillion dollar mark, amid high interest rates and an ever-expanding debt burden.
-

 United States2 weeks ago
Ranked: The Largest U.S. Corporations by Number of Employees
We visualized the top U.S. companies by employees, revealing the massive scale of retailers like Walmart, Target, and Home Depot.
-

 Markets2 weeks ago
The Top 10 States by Real GDP Growth in 2023
This graphic shows the states with the highest real GDP growth rate in 2023, largely propelled by the oil and gas boom.
-

 Markets3 weeks ago
Ranked: The World’s Top Flight Routes, by Revenue
In this graphic, we show the highest earning flight routes globally as air travel continued to rebound in 2023.
-

 Markets3 weeks ago
Ranked: The Most Valuable Housing Markets in America
The U.S. residential real estate market is worth a staggering $47.5 trillion. Here are the most valuable housing markets in the country.


-

 Debt1 week ago
How Debt-to-GDP Ratios Have Changed Since 2000
-

 Countries2 weeks ago
Population Projections: The World’s 6 Largest Countries in 2075
-
Markets2 weeks ago
The Top 10 States by Real GDP Growth in 2023
-

 Demographics2 weeks ago
The Smallest Gender Wage Gaps in OECD Countries
-

 United States2 weeks ago
Where U.S. Inflation Hit the Hardest in March 2024
-

 Green2 weeks ago
Top Countries By Forest Growth Since 2001
-
United States2 weeks ago
Ranked: The Largest U.S. Corporations by Number of Employees
-

 Maps2 weeks ago
The Largest Earthquakes in the New York Area (1970-2024)