

This graphic illustrates the biggest stock markets by country, providing a unique breakdown of $110 trillion in valuation.
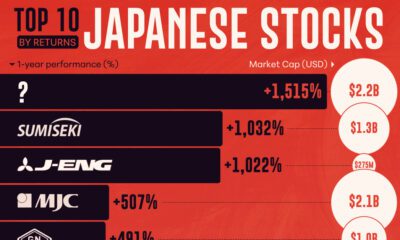

With the Nikkei 225 hitting its first all-time high since 1989, we've ranked the top 10 Japanese stocks by their 1-yr return.

Jin Medical, the top IPO of the year, is set to be delisted due to a listing rule violation.
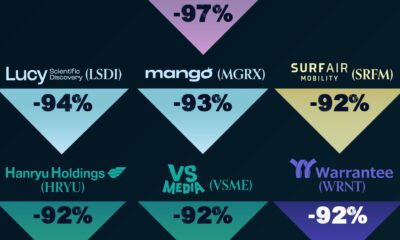

The Chinese EV battery company U Power experienced the worst IPO performance in 2023.
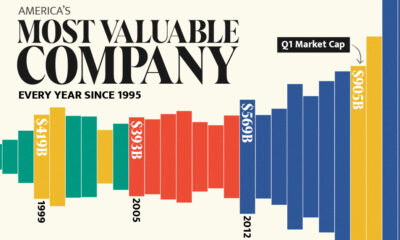

Over the last three decades, the growth of tech companies has driven a shift in the ranking of the most valuable companies in the U.S.
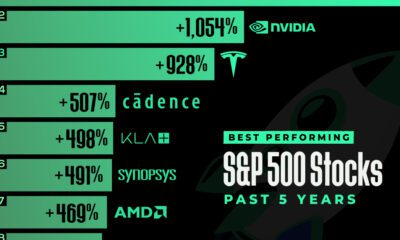

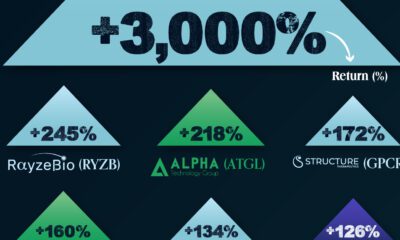
In this graphic, we've ranked the top S&P 500 stocks based on their 5-year total returns, as of November 2023.
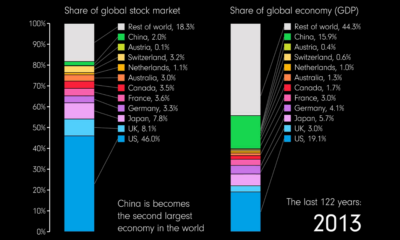

This animation compares countries' share of the global stock market and GDP over 122 years from 1900 to 2022.
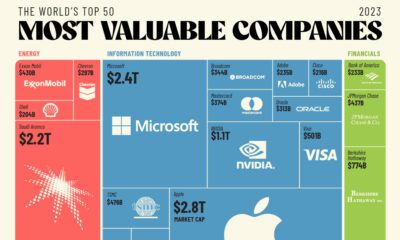

The world's 50 most valuable companies represent over $25 trillion in market cap. We break this massive figure down by company and sector.
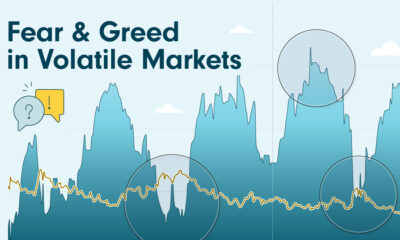

CNN's Fear & Greed Index captures investor confidence levels, usually reflecting market volatility. It increases during periods of greed in the markets and decreases when investors...
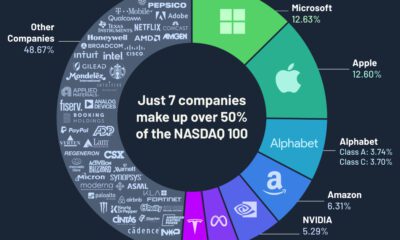

Just seven companies make up over 50% of the Nasdaq 100 by weight, and most of them are from the technology sector.


 Creator Program