Personal Finance
Visualizing How the Pandemic is Impacting American Wallets
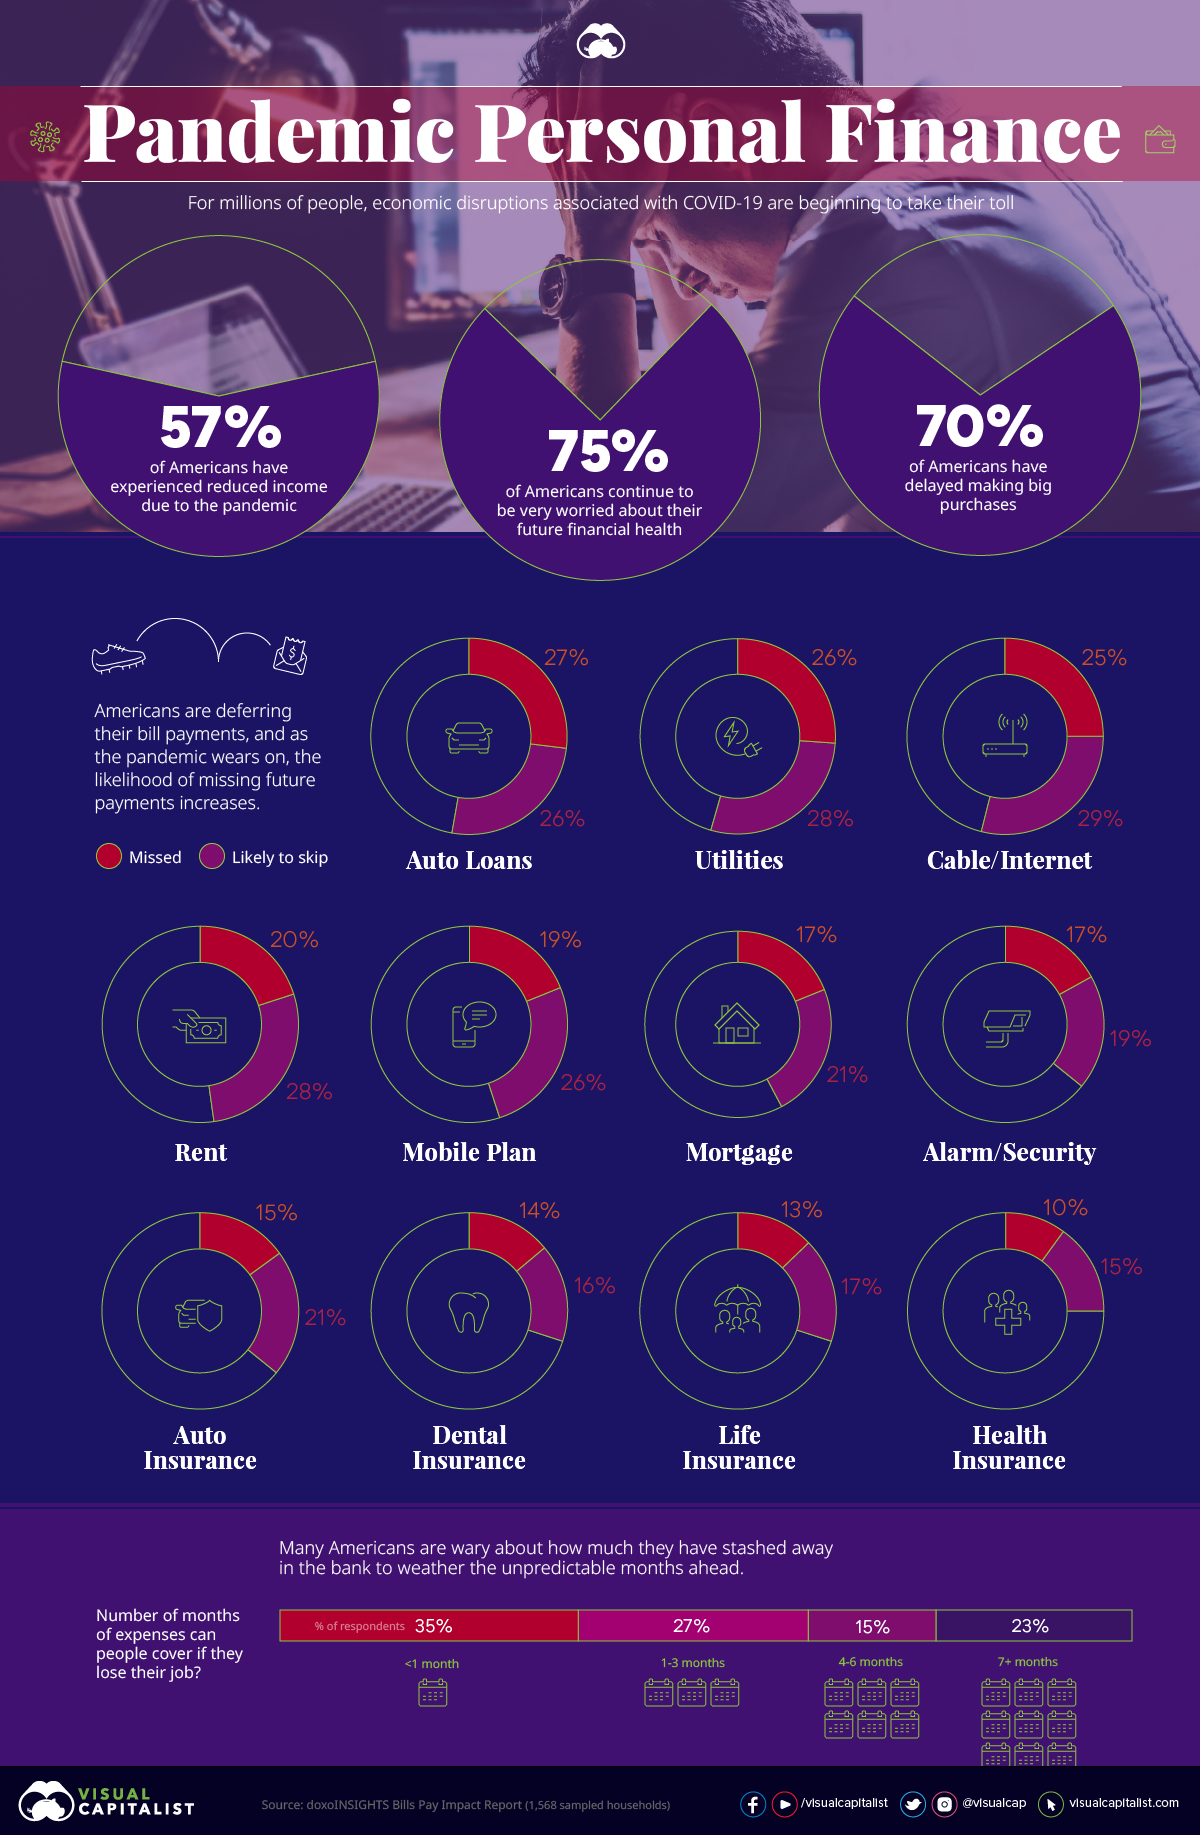
A Snapshot of U.S. Personal Finances During the Pandemic
If you’ve felt that you’ve needed to penny-pinch more during the pandemic, you’re not alone.
In the past seven months, 42% of U.S. consumers have missed paying one or more bills, while over a third (39%) believe they will need to skip payments in the future.
This visualization breaks down the state of U.S. consumers’ personal finances during the COVID-19 era, and projects into future concerns around savings.
Pandemic Personal Finances: Key Takeaways
Based on data from the doxoINSIGHTS Bills Pay Impact Report across 1,568 sampled households, three themes emerge:
- 57% of consumers’ incomes have taken a hit in the past seven months
- 70% have delayed discretionary spending on big purchases
- 75% continue to be very worried about their future financial health
How do these anxieties translate into day-to-day consequences?
Pandemic Postpones Bill Payments
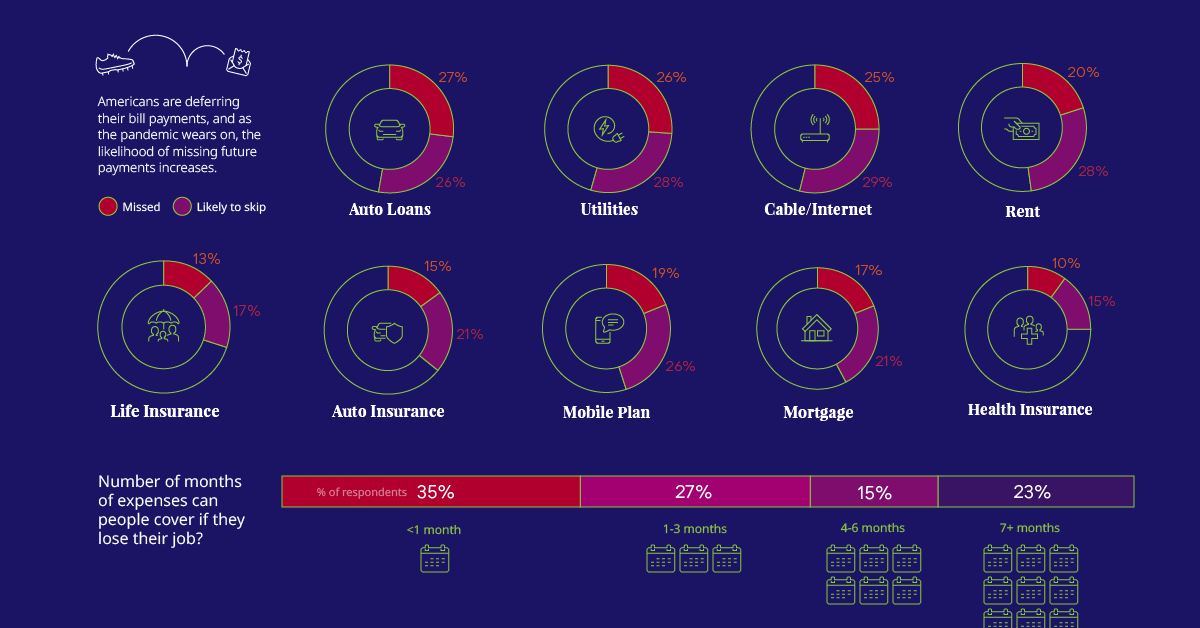
Unsurprisingly, worrying about personal finances also means that more Americans are deferring their bill payments during the pandemic. However, these vary depending on the type of bill, total amount, and immediate urgency.
Over a quarter (27%) of U.S. consumers report having missed a bill on their auto loans, followed by 26% for utilities and 25% on cable or internet costs.
The average cost of the above three bill types is $258—but that’s still a fraction of the two most expensive bills, mortgage or rent, which come in at $1,268 and $1,023 respectively.
| Bill Type | $ Value | % Missed |
|---|---|---|
| Auto loans | $374 | 27% |
| Utilities | $290 | 26% |
| Cable/ Internet | $110 | 25% |
| Rent | $1,023 | 20% |
| Mobile phone | $88 | 19% |
| Mortgage | $1,268 | 17% |
| Alarm/ Security | $76 | 17% |
| Auto insurance | $181 | 15% |
| Dental insurance | $25 | 14% |
| Life insurance | $76 | 13% |
| Health insurance | $94 | 10% |
Prioritizing Payments
While 20% of Americans say they’ve missed a rent payment over the past few months, what’s even more alarming is that 28% of U.S. consumers believe they will most likely skip paying rent in the future.
| Bill Type | % Likely to Skip in Future |
|---|---|
| Cable/ Internet | 29% |
| Utilities | 28% |
| Rent | 28% |
| Auto loans | 26% |
| Mobile phone | 26% |
| Mortgage | 21% |
| Auto insurance | 21% |
| Alarm/ Security | 19% |
| Dental insurance | 16% |
| Life insurance | 17% |
| Health insurance | 15% |
Another clear trend is that many Americans are prioritizing insurance payments, particularly health insurance. This is good news during a global pandemic—only 10% have missed paying this bill type, although 15% expect to skip it in the coming months.
According to the report, some U.S. consumers seem to prioritize the bill types which come with strings attached, from late-payment penalties to accrued interest.
While missing a single payment might seem harmless, a pattern of missed payments over time have the potential to negatively impact your credit score.
Enough Savings To Stay Afloat?
Finally, Americans are wary about how much they have stashed away in the bank to weather the tumultuous months ahead.
While unemployment figures are recovering from historic troughs, the fear of losing one’s job remains prevalent. How many months’ worth of savings do U.S. consumers think they have if this were to happen?
| # Months | % Responses |
|---|---|
| 7+ months 💰💰💰💰💰💰💰 | 23% |
| 4-6 months 💰💰💰💰💰💰 | 15% |
| 1-3 months 💰💰💰 | 27% |
| <1 month 💰 | 35% |
No one knows how long the COVID-19 chaos will last. In order to adapt to this economic uncertainty, consumer priorities are shifting along with their tightened budgets.


Personal Finance
Chart: The Declining Value of the U.S. Federal Minimum Wage
This graphic compares the nominal vs. inflation-adjusted value of the U.S. minimum wage, from 1940 to 2023.


The Declining Value of the U.S. Federal Minimum Wage
This was originally posted on our Voronoi app. Download the app for free on iOS or Android and discover incredible data-driven charts from a variety of trusted sources.
This graphic illustrates the history of the U.S. federal minimum wage using data compiled by Statista, in both nominal and real (inflation-adjusted) terms. The federal minimum wage was raised to $7.25 per hour in July 2009, where it has remained ever since.
Nominal vs. Real Value
The data we used to create this graphic can be found in the table below.
| Year | Nominal value ($/hour) | Real value ($/hour) |
|---|---|---|
| 1940 | 0.3 | 6.5 |
| 1945 | 0.4 | 6.82 |
| 1950 | 0.75 | 9.64 |
| 1955 | 0.75 | 8.52 |
| 1960 | 1 | 10.28 |
| 1965 | 1.25 | 12.08 |
| 1970 | 1.6 | 12.61 |
| 1975 | 2.1 | 12.04 |
| 1980 | 3.1 | 11.61 |
| 1985 | 3.35 | 9.51 |
| 1990 | 3.8 | 8.94 |
| 1995 | 4.25 | 8.49 |
| 2000 | 5.15 | 9.12 |
| 2005 | 5.15 | 8.03 |
| 2010 | 7.25 | 10.09 |
| 2015 | 7.25 | 9.3 |
| 2018 | 7.25 | 8.78 |
| 2019 | 7.25 | 8.61 |
| 2020 | 7.25 | 8.58 |
| 2021 | 7.25 | 8.24 |
| 2022 | 7.25 | 7.61 |
| 2023 | 7.25 | 7.25 |
What our graphic shows is how inflation has eroded the real value of the U.S. minimum wage over time, despite nominal increases.
For instance, consider the year 1960, when the federal minimum wage was $1 per hour. After accounting for inflation, this would be worth around $10.28 today!
The two lines converge at 2023 because the nominal and real value are identical in present day terms.
Many States Have Their Own Minimum Wage
According to the National Conference of State Legislatures (NCSL), 30 states and Washington, D.C. have implemented a minimum wage that is higher than $7.25.
The following states have adopted the federal minimum: Georgia, Idaho, Indiana, Iowa, Kansas, Kentucky, New Hampshire, North Carolina, North Dakota, Oklahoma, Pennsylvania, Texas, Utah, Wisconsin, and Wyoming.
Meanwhile, the states of Alabama, Louisiana, Mississippi, South Carolina, and Tennessee have no wage minimums, but have to follow the federal minimum.
How Does the U.S. Minimum Wage Rank Globally?
If you found this topic interesting, check out Mapped: Minimum Wage Around the World to see which countries have the highest minimum wage in monthly terms, as of January 2023.

-

 Debt1 week ago
How Debt-to-GDP Ratios Have Changed Since 2000
-

 Markets2 weeks ago
Ranked: The World’s Top Flight Routes, by Revenue
-

 Countries2 weeks ago
Population Projections: The World’s 6 Largest Countries in 2075
-

 Markets2 weeks ago
The Top 10 States by Real GDP Growth in 2023
-

 Demographics2 weeks ago
The Smallest Gender Wage Gaps in OECD Countries
-

 United States2 weeks ago
Where U.S. Inflation Hit the Hardest in March 2024
-

 Green2 weeks ago
Top Countries By Forest Growth Since 2001
-

 United States2 weeks ago
Ranked: The Largest U.S. Corporations by Number of Employees