Politics
Decoding U.S. Election Day in 9 Key Charts
After a tumultuous election cycle, the time has come at last for Americans to cast their ballots.
Media coverage has reached a fever pitch, and keeping up with the news cycle can be daunting for anyone. To keep the voting public and interested onlookers informed, we’ve compiled nine key charts that can help in answering key questions that people will have today:
- Who’ll win the U.S. presidential election?
- How could swing states flip?
- When will we know the election results?
- What are the stakes?
- What does the rest of the world think?
Let’s start with the biggest—and most challenging—of these topics first.
Who’ll Win the Election?
As the world learned in 2016, answering this question is not as simple as it looks—even when the poll results point to a clear victory.
Chart #1: Biden remains the odds-on favorite
In 2020’s race, the poll results are once again stacked against President Trump. Here’s a look at who’s ahead in aggregated national polls:
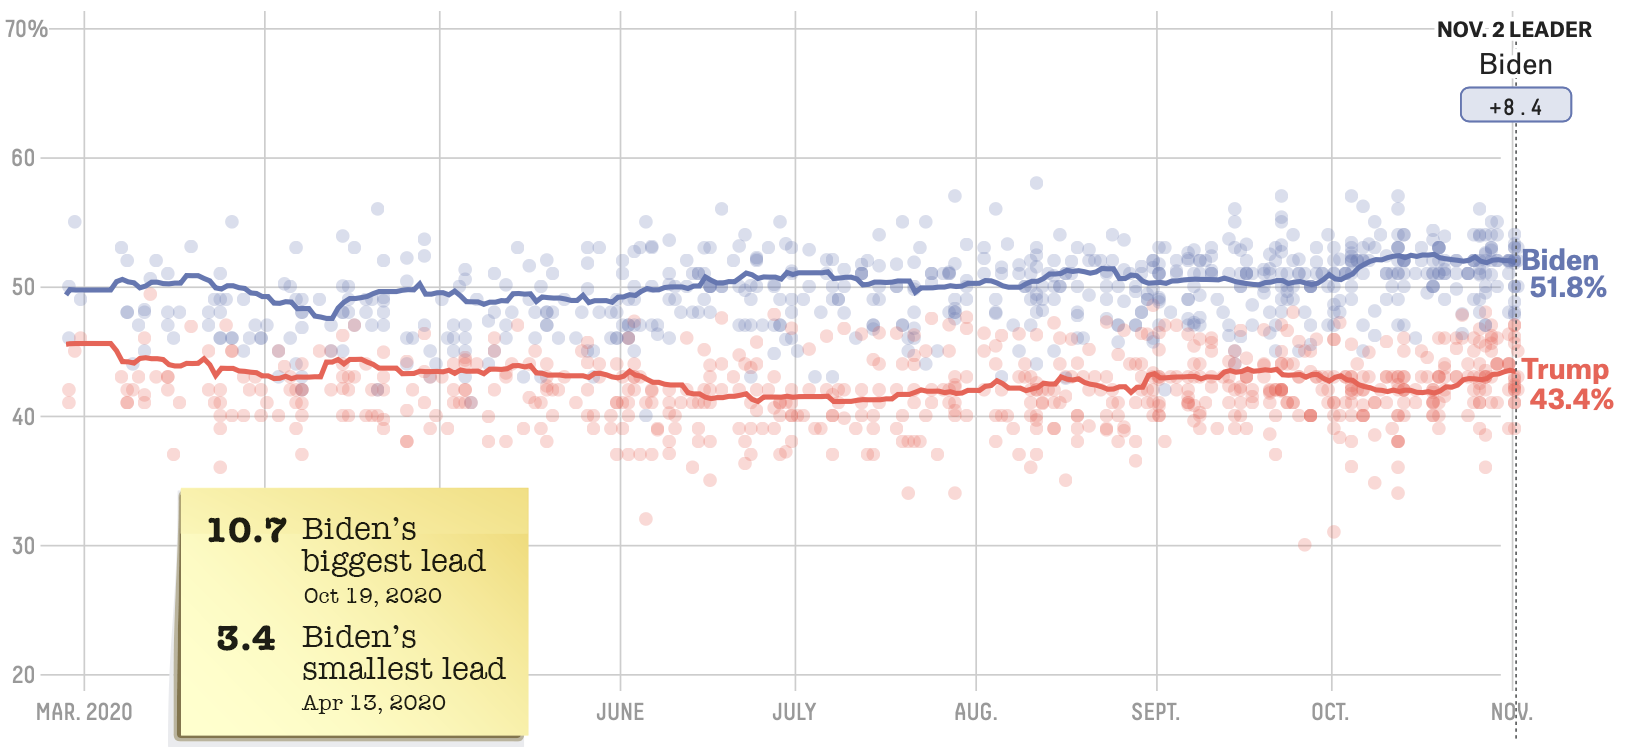
Source: FiveThirtyEight
Although this election cycle has been a wild ride, that volatility isn’t necessarily reflected in the polls. Over the past three months, Joe Biden’s lead in the national polls has not dipped below three percentage points.
Chart #2: Viewing odds through a 2016 lens
That said, after the colossal miscalculation by the media and pollsters in 2016, many people are skeptical of the accuracy of polls. Luckily, there’s a way to look at predictions through a more skeptical lens. As this table from FiveThirtyEight demonstrates, even if the results are as wrong as in 2016, Joe Biden is still predicted to win.
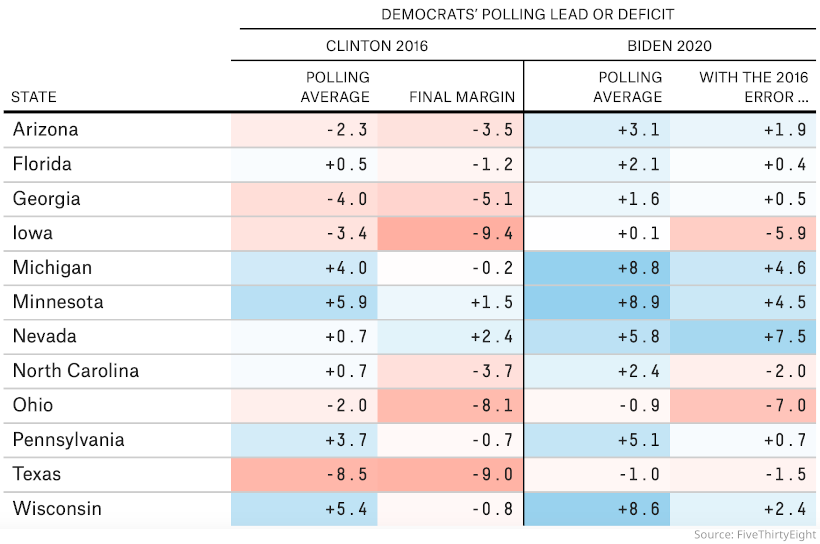
Chart #3: Betting markets also agree
Prediction markets are another way to try to gauge how the election could turn out. Traders on PredictIt are also leaning towards a Biden win on election day. President Trump’s COVID-19 diagnosis in early October served as a pivot point in that market.
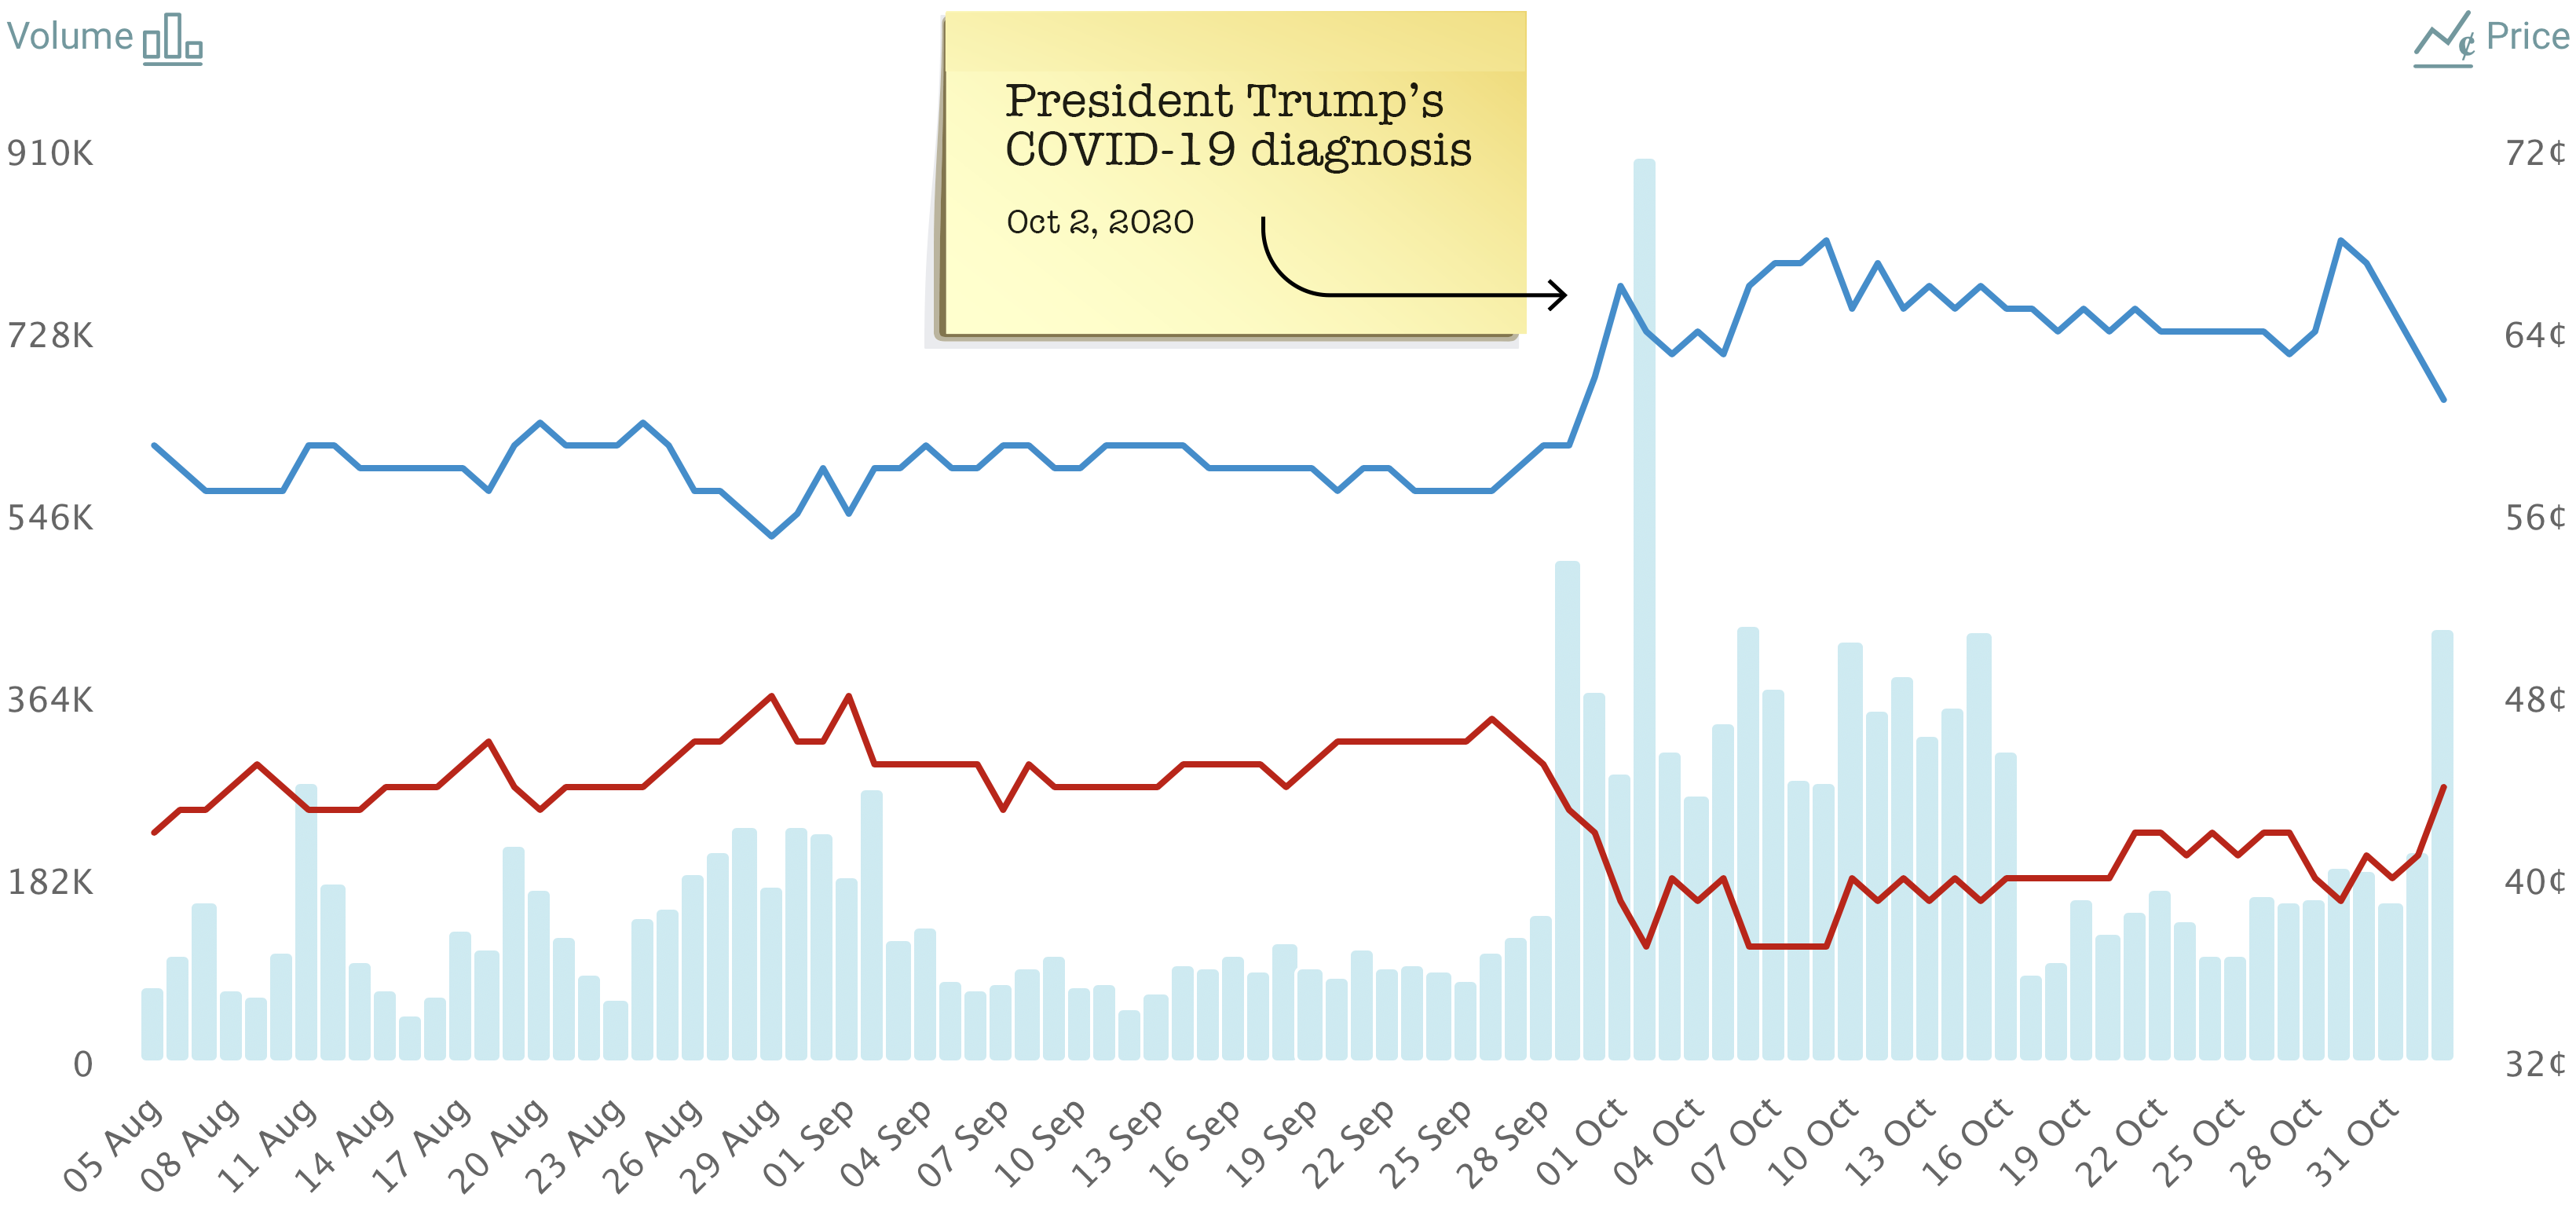
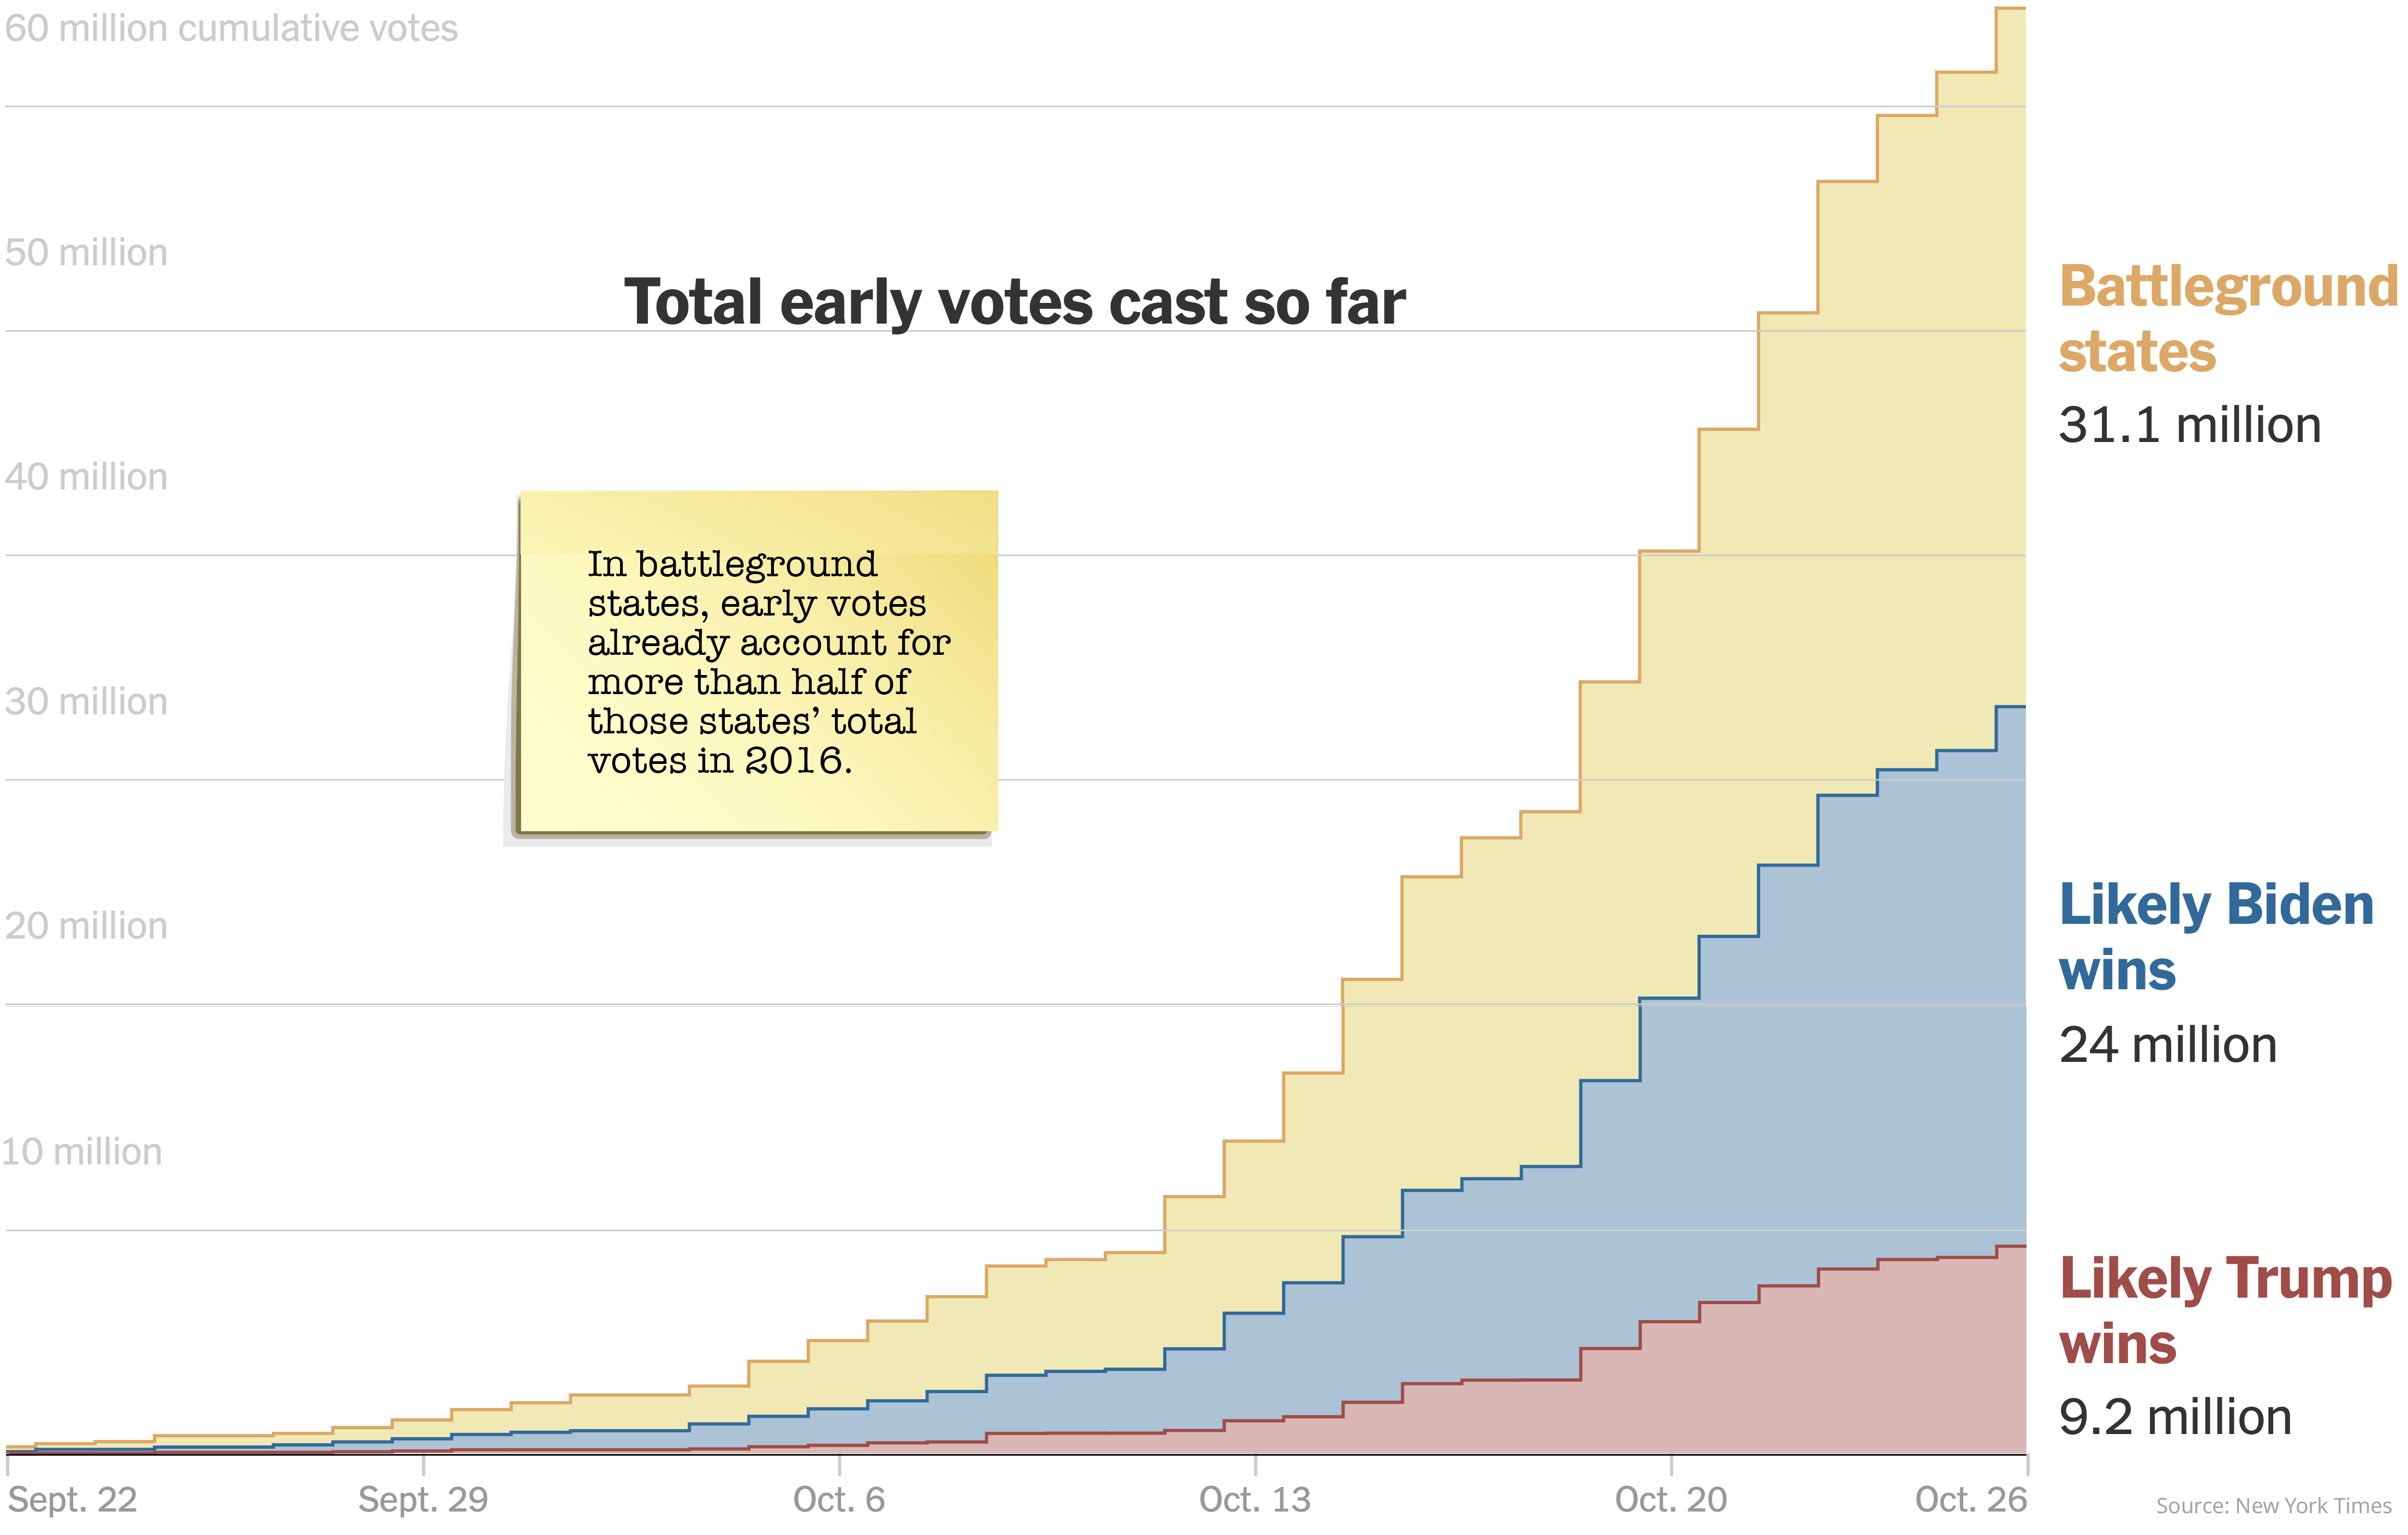
Chart #4: The Sultans of Swing
There are a few swing states which will be hotly contested, with the candidates focusing their final days of campaigning on these.
Pennsylvania has received the most visits from both Trump and Biden since their last debate on October 22nd, with Trump visiting the state seven times and Biden stopping by four times.
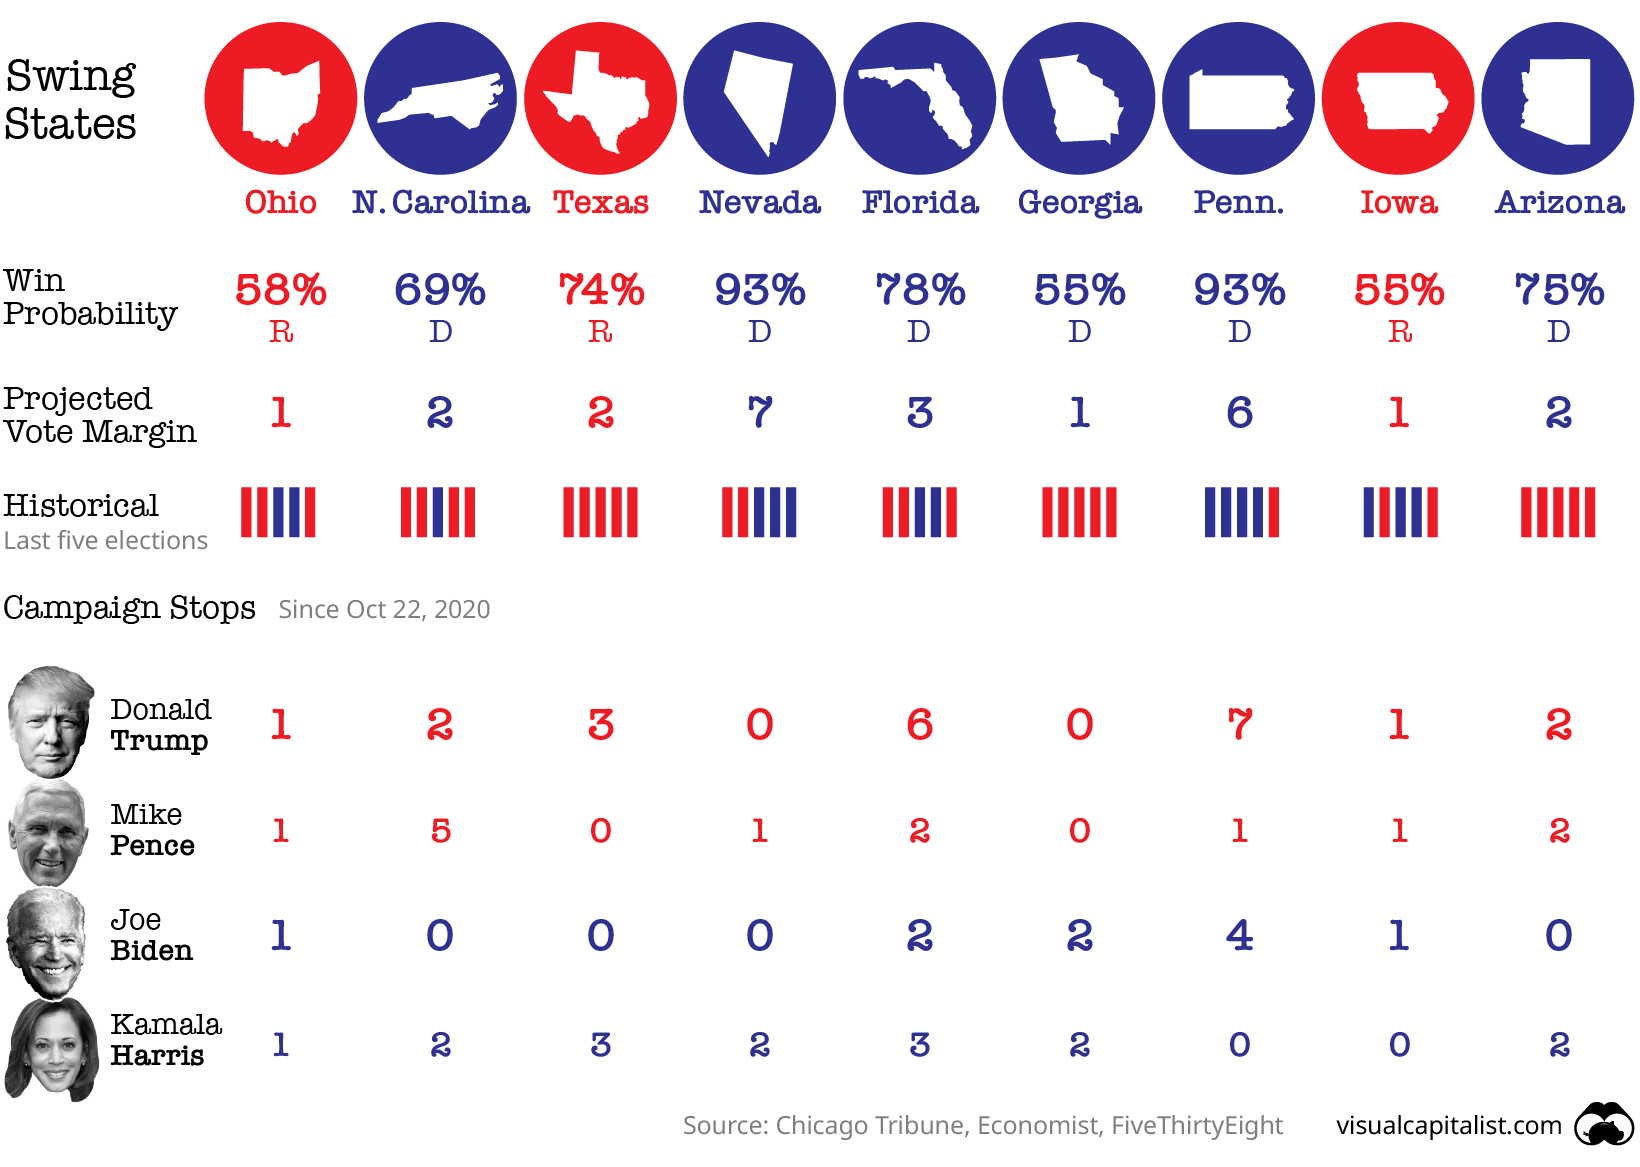
Swing states have had strong early voting turnouts. In fact, the number of early voters in many swing states is already set to surpass the total number of voters they saw in the 2016 election.
While Arizona and Georgia have voted red for the past five elections, early predictions point to these states possibly turning blue in 2020.
When Will We Know the Election Results?
While the result of the presidential election is typically known on the night of the election itself, this year could see delays due to the tight race and the amount of mail-in ballots.
No matter what, state election disputes need to be settled before December 8th, the “safe-harbor deadline”. After this date, states run the risk of having Congress refuse to accept their electoral votes, with Congress also resolving any left over disputes.
Each state’s electors then meet on December 14th in order to elect the president and vice-president. Depending on how that goes, this interactive election timeline by The Guardian looks at a few nightmare scenarios that the U.S. could get caught in.
Chart #5: Visualizing mail-in ballots so far
Mail-in ballots can slow down the election result due to late ballot deadlines and the pre-processing required for them to be counted. Expect to see a correlation between states with high mail-in ballot numbers and how long it takes them to call their result.
Ballot deadlines depend on the state, with some states accepting ballots up until November 23rd as long as they were postmarked by election day.
While some states can start pre-processing ballots before election day, others can’t start until election day itself. Some counties (including some in swing state Pennsylvania) won’t be starting mail-in ballot counting until November 4th due to limited resources.
Why Are the Stakes So High?
Voters from both parties are heavily invested in who wins this election—a trend that’s been on the rise for years, coinciding with increasing amounts of political polarization.
Chart #6: Voter apathy, no more
According to a recent survey by Pew Research Center, 83% of voters say it “really matters” who becomes the next president. In 2000, only 50% felt so strongly about the outcome of the election.
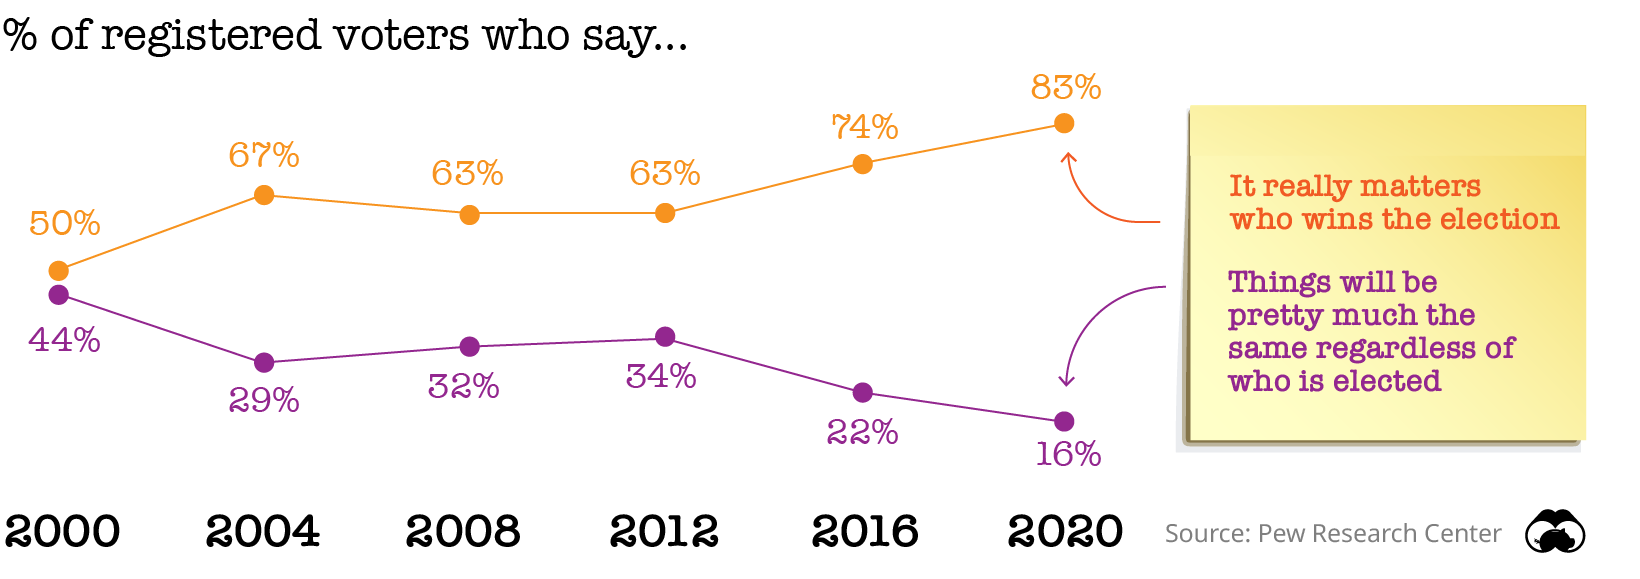
To be fair, this year is also unique given a global pandemic—and this has certainly weighed heavily on many voters, creating more urgency than normal.
In fact, according to a survey conducted by Gallup in April 2020, 45% of Americans think Coronavirus/disease is the most important issue the country is currently facing.
Chart #7: Voters See COVID as a Top Concern
Research has shown a correlation so far between COVID-related deaths and reduced support for the incumbent. According to this graph from the New York Times, Trump’s approval rating tends to be lower in counties with higher death rates.
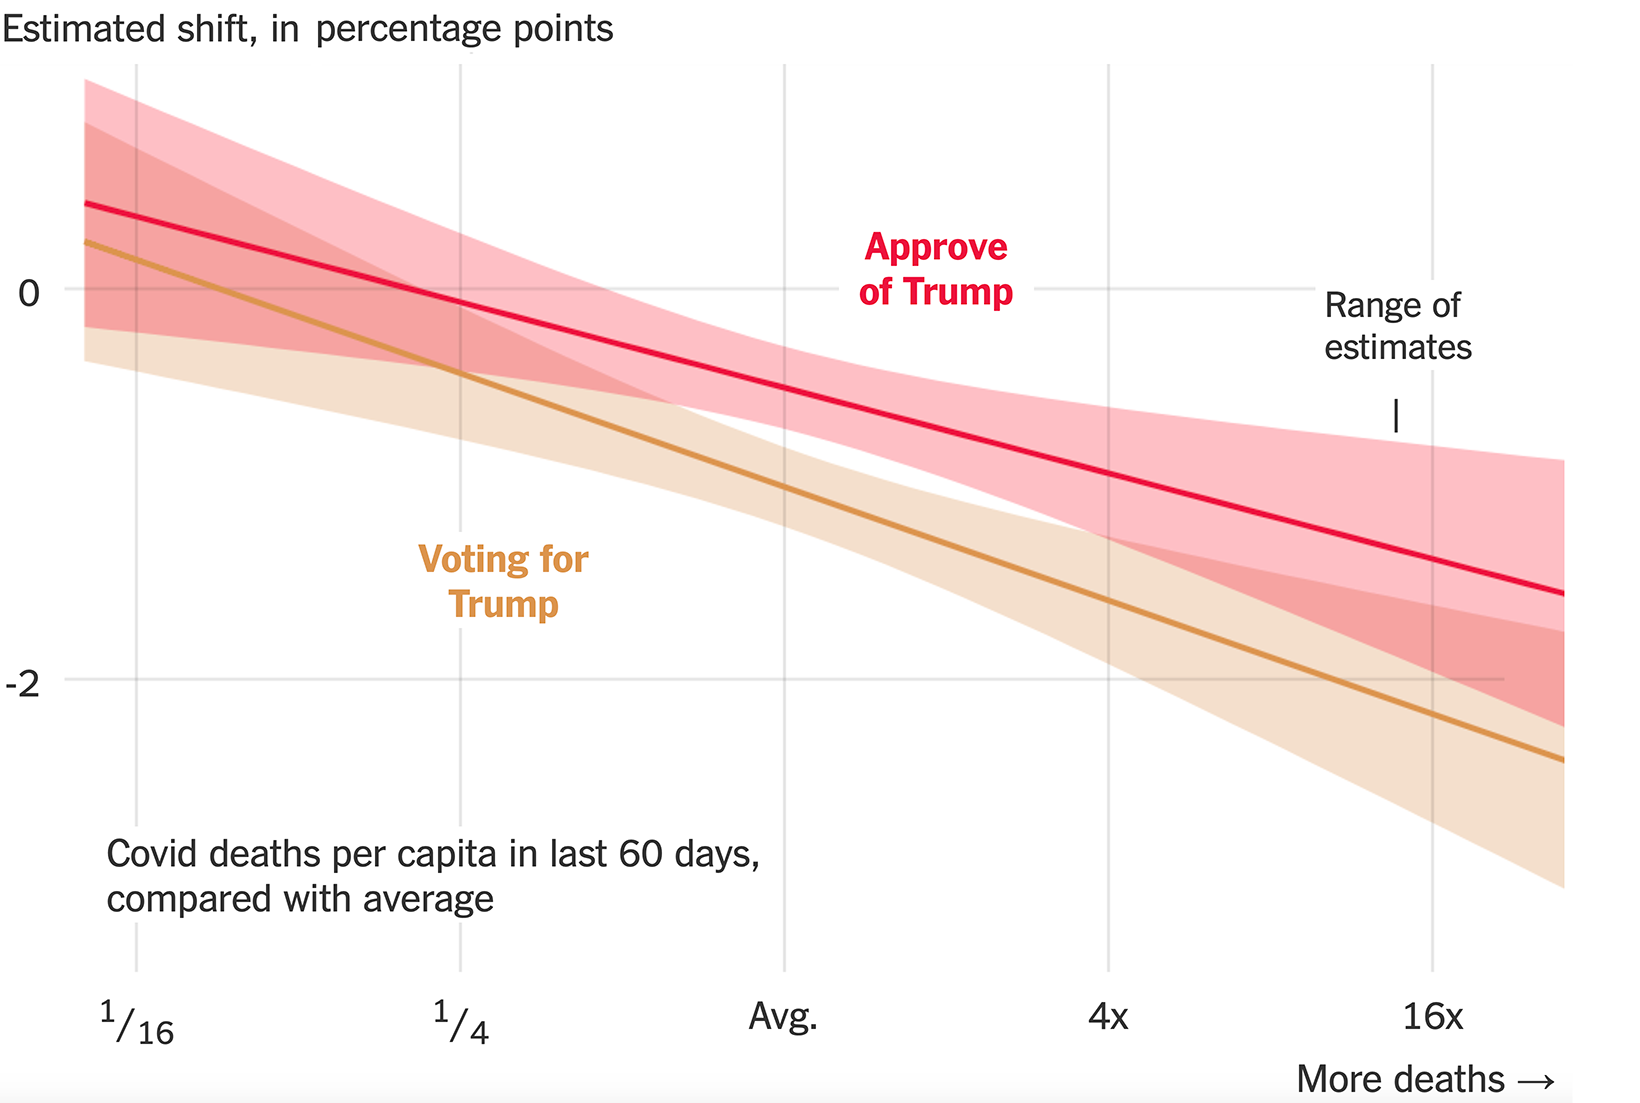
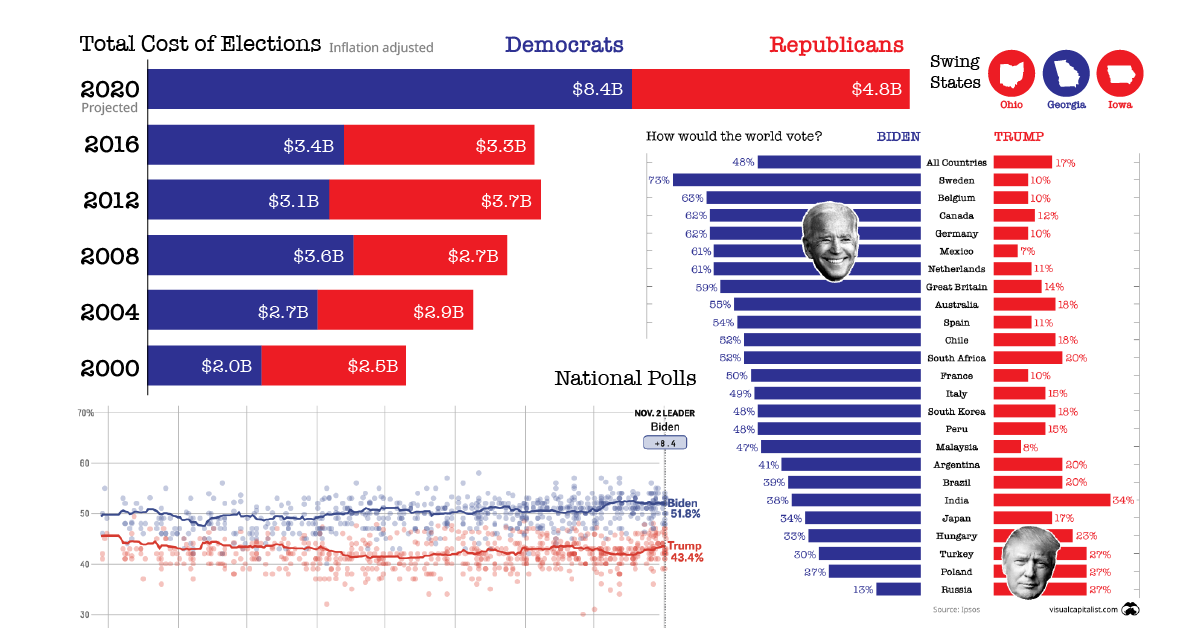
Chart #8: The price of democracy
The exceptionally high stakes could be a reason why this election is expected to be the most expensive to date. Spending is projected to reach over $13 billion, almost double the amount spent in 2016.
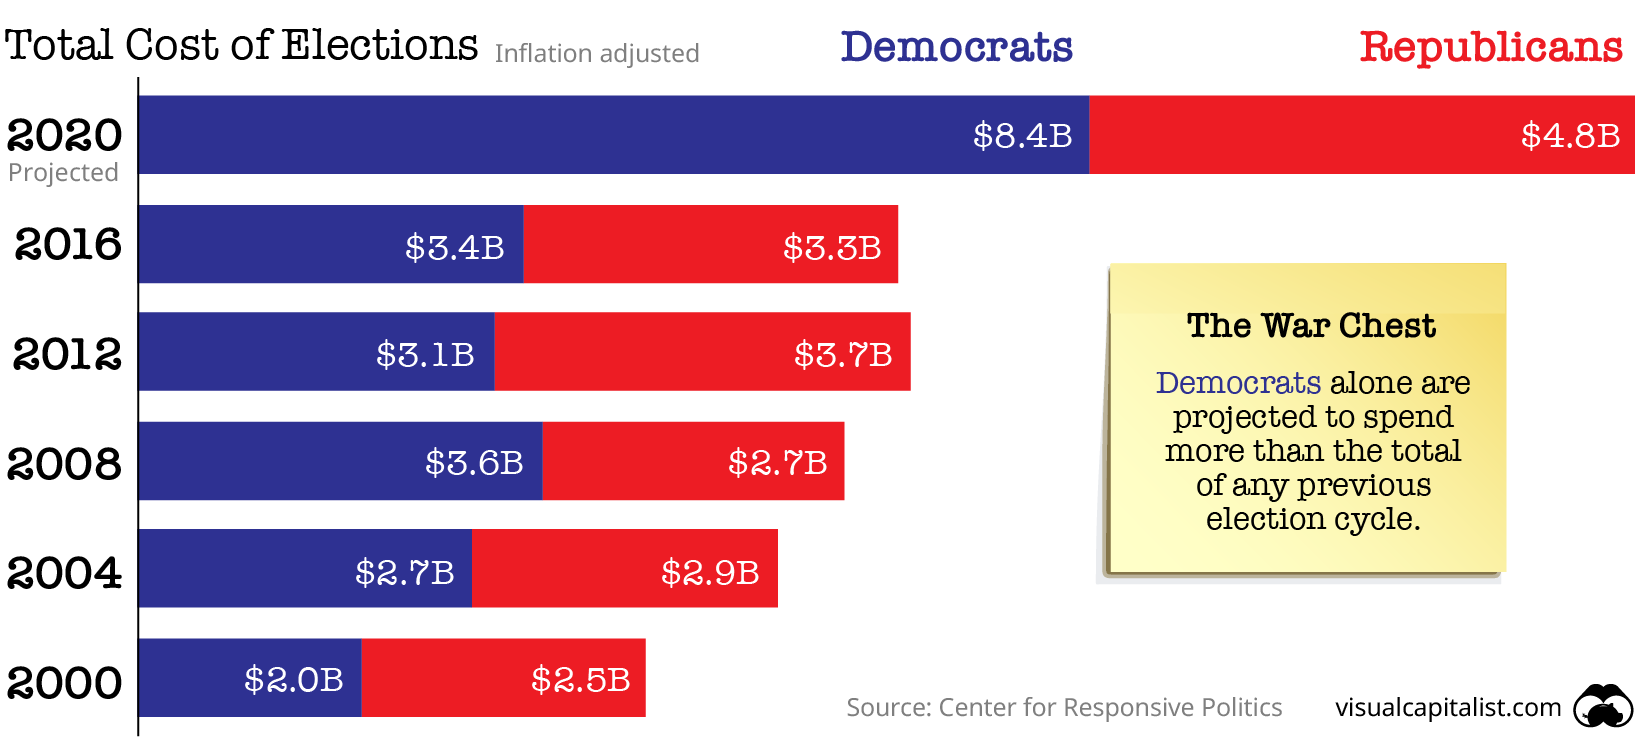
Source: Center for Responsive Politics
Chart #9: What the rest of the world thinks
Americans aren’t the only ones invested in the U.S. presidential election this year. The whole world is watching, and according to Ipsos, the majority is rooting for Biden.
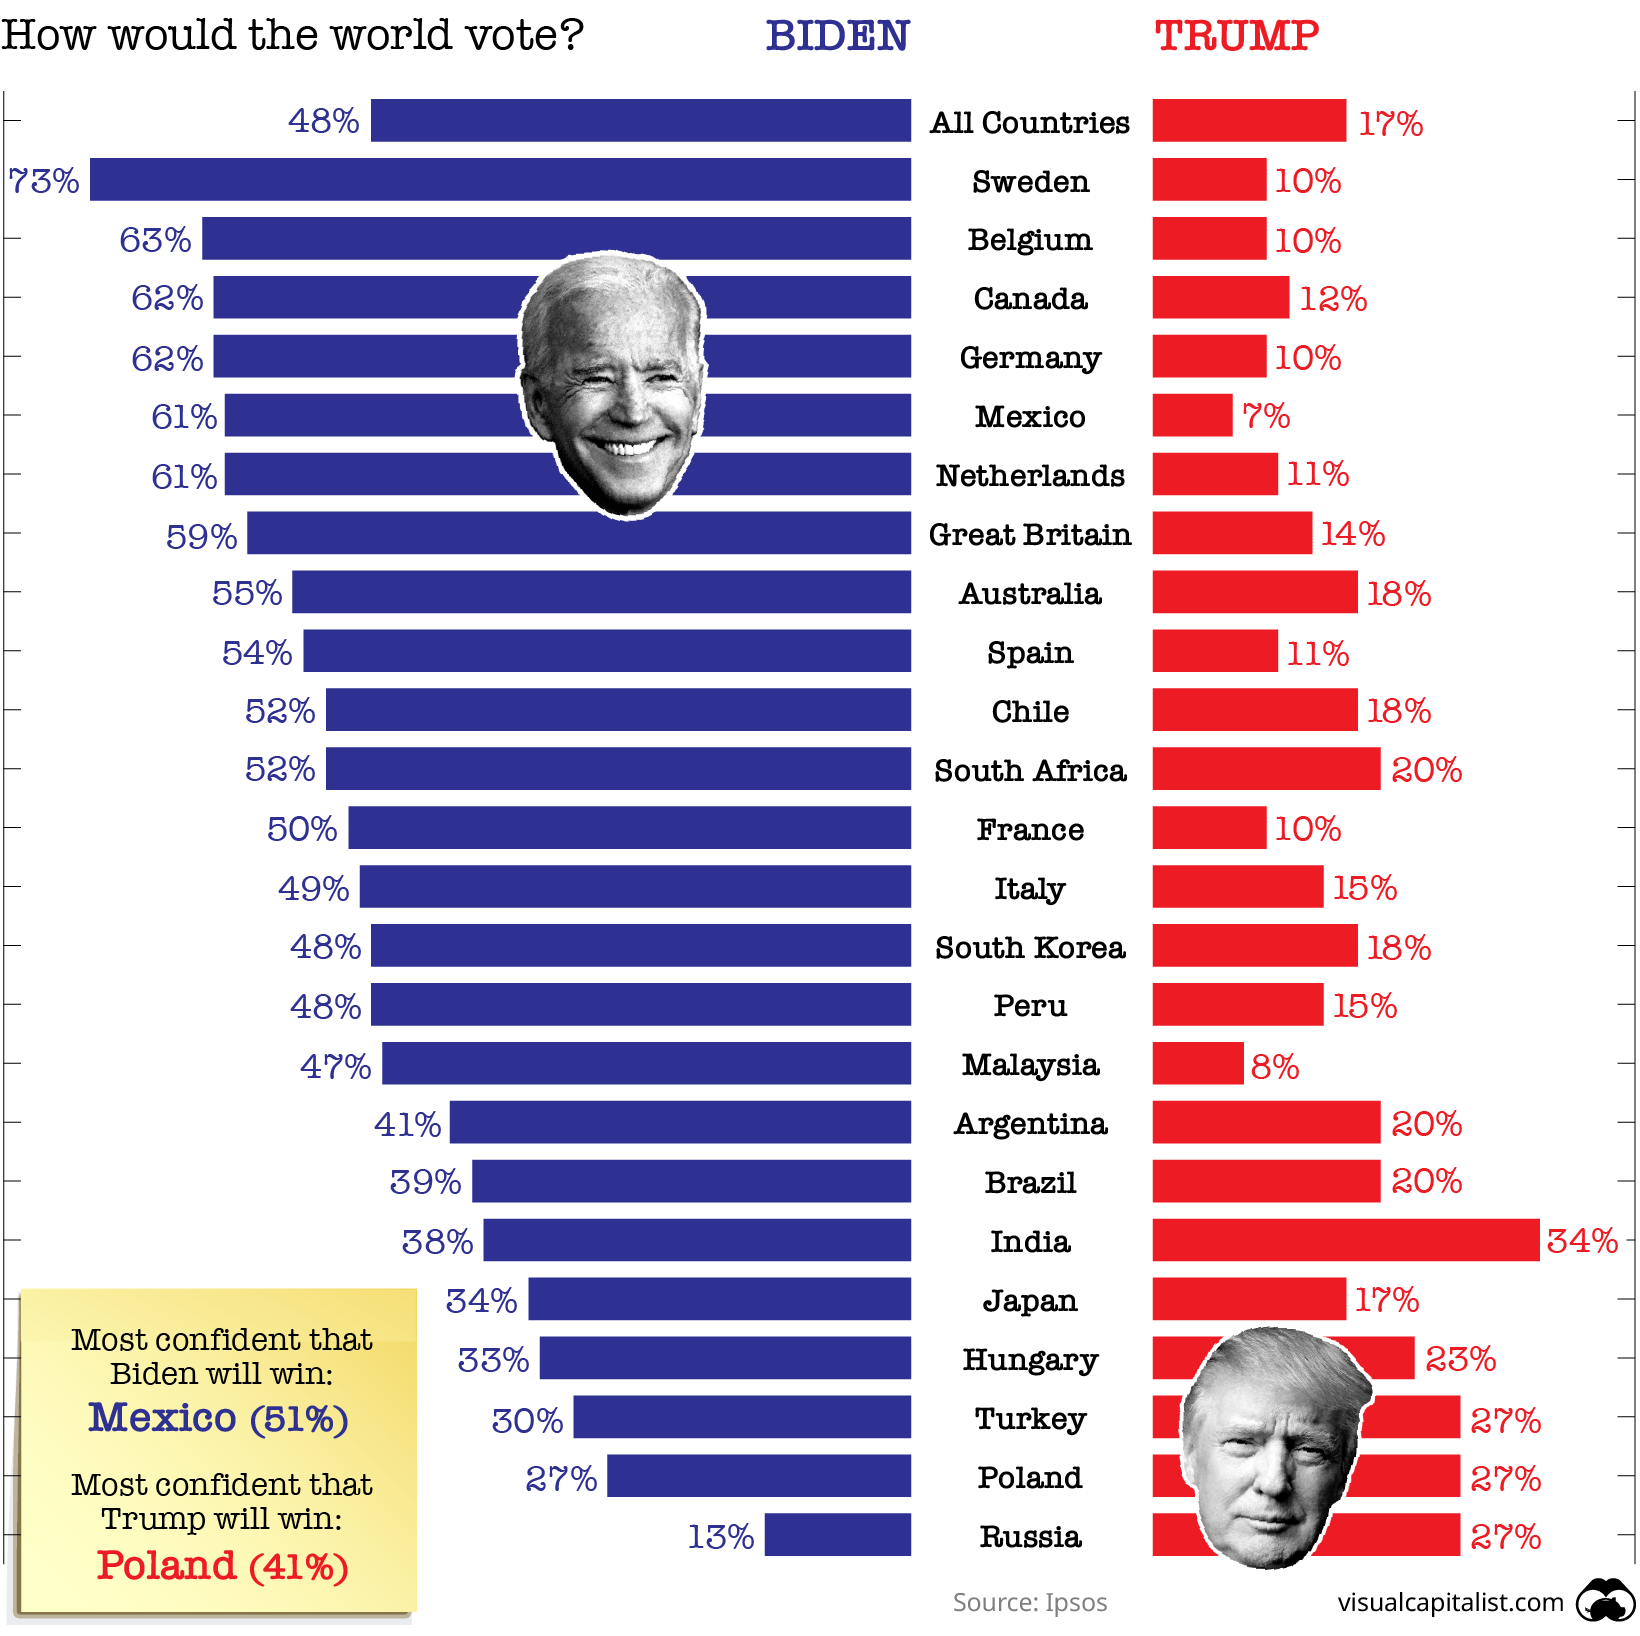
But of course, the world doesn’t get to cast a vote today, making this final chart a moot point.
The real decision makers will be in the American electorate—and the forthcoming result will be on people’s minds for days, months, or maybe even years to come.


Economy
The Bloc Effect: International Trade with Geopolitical Allies on the Rise
Rising geopolitical tensions are shaping the future of international trade, but what is the effect on trading among G7 and BRICS countries?


The Bloc Effect: International Trade with Allies on the Rise
International trade has become increasingly fragmented over the last five years as countries have shifted to trading more with their geopolitical allies.
This graphic from The Hinrich Foundation, the first in a three-part series covering the future of trade, provides visual context to the growing divide in trade in G7 and pre-expansion BRICS countries, which are used as proxies for geopolitical blocs.
Trade Shifts in G7 and BRICS Countries
This analysis uses IMF data to examine differences in shares of exports within and between trading blocs from 2018 to 2023. For example, we looked at the percentage of China’s exports with other BRICS members as well as with G7 members to see how these proportions shifted in percentage points (pp) over time.
Countries traded nearly $270 billion more with allies in 2023 compared to 2018. This shift came at the expense of trade with rival blocs, which saw a decline of $314 billion.
Country Change in Exports Within Bloc (pp) Change in Exports With Other Bloc (pp)
🇮🇳 India 0.0 3.9
🇷🇺 Russia 0.7 -3.8
🇮🇹 Italy 0.8 -0.7
🇨🇦 Canada 0.9 -0.7
🇫🇷 France 1.0 -1.1
🇪🇺 EU 1.1 -1.5
🇩🇪 Germany 1.4 -2.1
🇿🇦 South Africa 1.5 1.5
🇺🇸 U.S. 1.6 -0.4
🇯🇵 Japan 2.0 -1.7
🇨🇳 China 2.1 -5.2
🇧🇷 Brazil 3.7 -3.3
🇬🇧 UK 10.2 0.5
All shifts reported are in percentage points. For example, the EU saw its share of exports to G7 countries rise from 74.3% in 2018 to 75.4% in 2023, which equates to a 1.1 percentage point increase.
The UK saw the largest uptick in trading with other countries within the G7 (+10.2 percentage points), namely the EU, as the post-Brexit trade slump to the region recovered.
Meanwhile, the U.S.-China trade dispute caused China’s share of exports to the G7 to fall by 5.2 percentage points from 2018 to 2023, the largest decline in our sample set. In fact, partly as a result of the conflict, the U.S. has by far the highest number of harmful tariffs in place.
The Russia-Ukraine War and ensuing sanctions by the West contributed to Russia’s share of exports to the G7 falling by 3.8 percentage points over the same timeframe.
India, South Africa, and the UK bucked the trend and continued to witness advances in exports with the opposing bloc.
Average Trade Shifts of G7 and BRICS Blocs
Though results varied significantly on a country-by-country basis, the broader trend towards favoring geopolitical allies in international trade is clear.
Bloc Change in Exports Within Bloc (pp) Change in Exports With Other Bloc (pp)
Average 2.1 -1.1
BRICS 1.6 -1.4
G7 incl. EU 2.4 -1.0
Overall, BRICS countries saw a larger shift away from exports with the other bloc, while for G7 countries the shift within their own bloc was more pronounced. This implies that though BRICS countries are trading less with the G7, they are relying more on trade partners outside their bloc to make up for the lost G7 share.
A Global Shift in International Trade and Geopolitical Proximity
The movement towards strengthening trade relations based on geopolitical proximity is a global trend.
The United Nations categorizes countries along a scale of geopolitical proximity based on UN voting records.
According to the organization’s analysis, international trade between geopolitically close countries rose from the first quarter of 2022 (when Russia first invaded Ukraine) to the third quarter of 2023 by over 6%. Conversely, trade with geopolitically distant countries declined.
The second piece in this series will explore China’s gradual move away from using the U.S. dollar in trade settlements.
Visit the Hinrich Foundation to learn more about the future of geopolitical trade

-

 Misc19 hours ago
Visualizing the Most Common Pets in the U.S.
Lions, tigers, and bears, oh my!—these animals do not feature on this list of popular American household pets.
-

 Economy4 days ago
Economic Growth Forecasts for G7 and BRICS Countries in 2024
The IMF has released its economic growth forecasts for 2024. How do the G7 and BRICS countries compare?
-

 United States2 weeks ago
Ranked: The Largest U.S. Corporations by Number of Employees
We visualized the top U.S. companies by employees, revealing the massive scale of retailers like Walmart, Target, and Home Depot.
-

 Economy2 weeks ago
Where U.S. Inflation Hit the Hardest in March 2024
We visualized product categories that saw the highest % increase in price due to U.S. inflation as of March 2024.
-

 Economy1 month ago
G20 Inflation Rates: Feb 2024 vs COVID Peak
We visualize inflation rates across G20 countries as of Feb 2024, in the context of their COVID-19 pandemic peak.
-

 Economy1 month ago
Mapped: Unemployment Claims by State
This visual heatmap of unemployment claims by state highlights New York, California, and Alaska leading the country by a wide margin.

-

 Brands6 days ago
How Tech Logos Have Evolved Over Time
-

 Demographics2 weeks ago
The Smallest Gender Wage Gaps in OECD Countries
-
Economy2 weeks ago
Where U.S. Inflation Hit the Hardest in March 2024
-

 Green2 weeks ago
Top Countries By Forest Growth Since 2001
-
United States2 weeks ago
Ranked: The Largest U.S. Corporations by Number of Employees
-

 Maps2 weeks ago
The Largest Earthquakes in the New York Area (1970-2024)
-

 Green2 weeks ago
Ranked: The Countries With the Most Air Pollution in 2023
-

 Green2 weeks ago
Ranking the Top 15 Countries by Carbon Tax Revenue