Markets
Mapped: The Top 30 Most Valuable Real Estate Cities in the U.S.


The Most Valuable Real Estate Cities in America
According to real estate tycoon Harold Samuel, there are three things that matter when it comes to real estate value—location, location, and location.
America’s property market is no exception to this rule. Depending on the city and its—you guessed it—location, there are vast discrepancies in real estate value across the country.
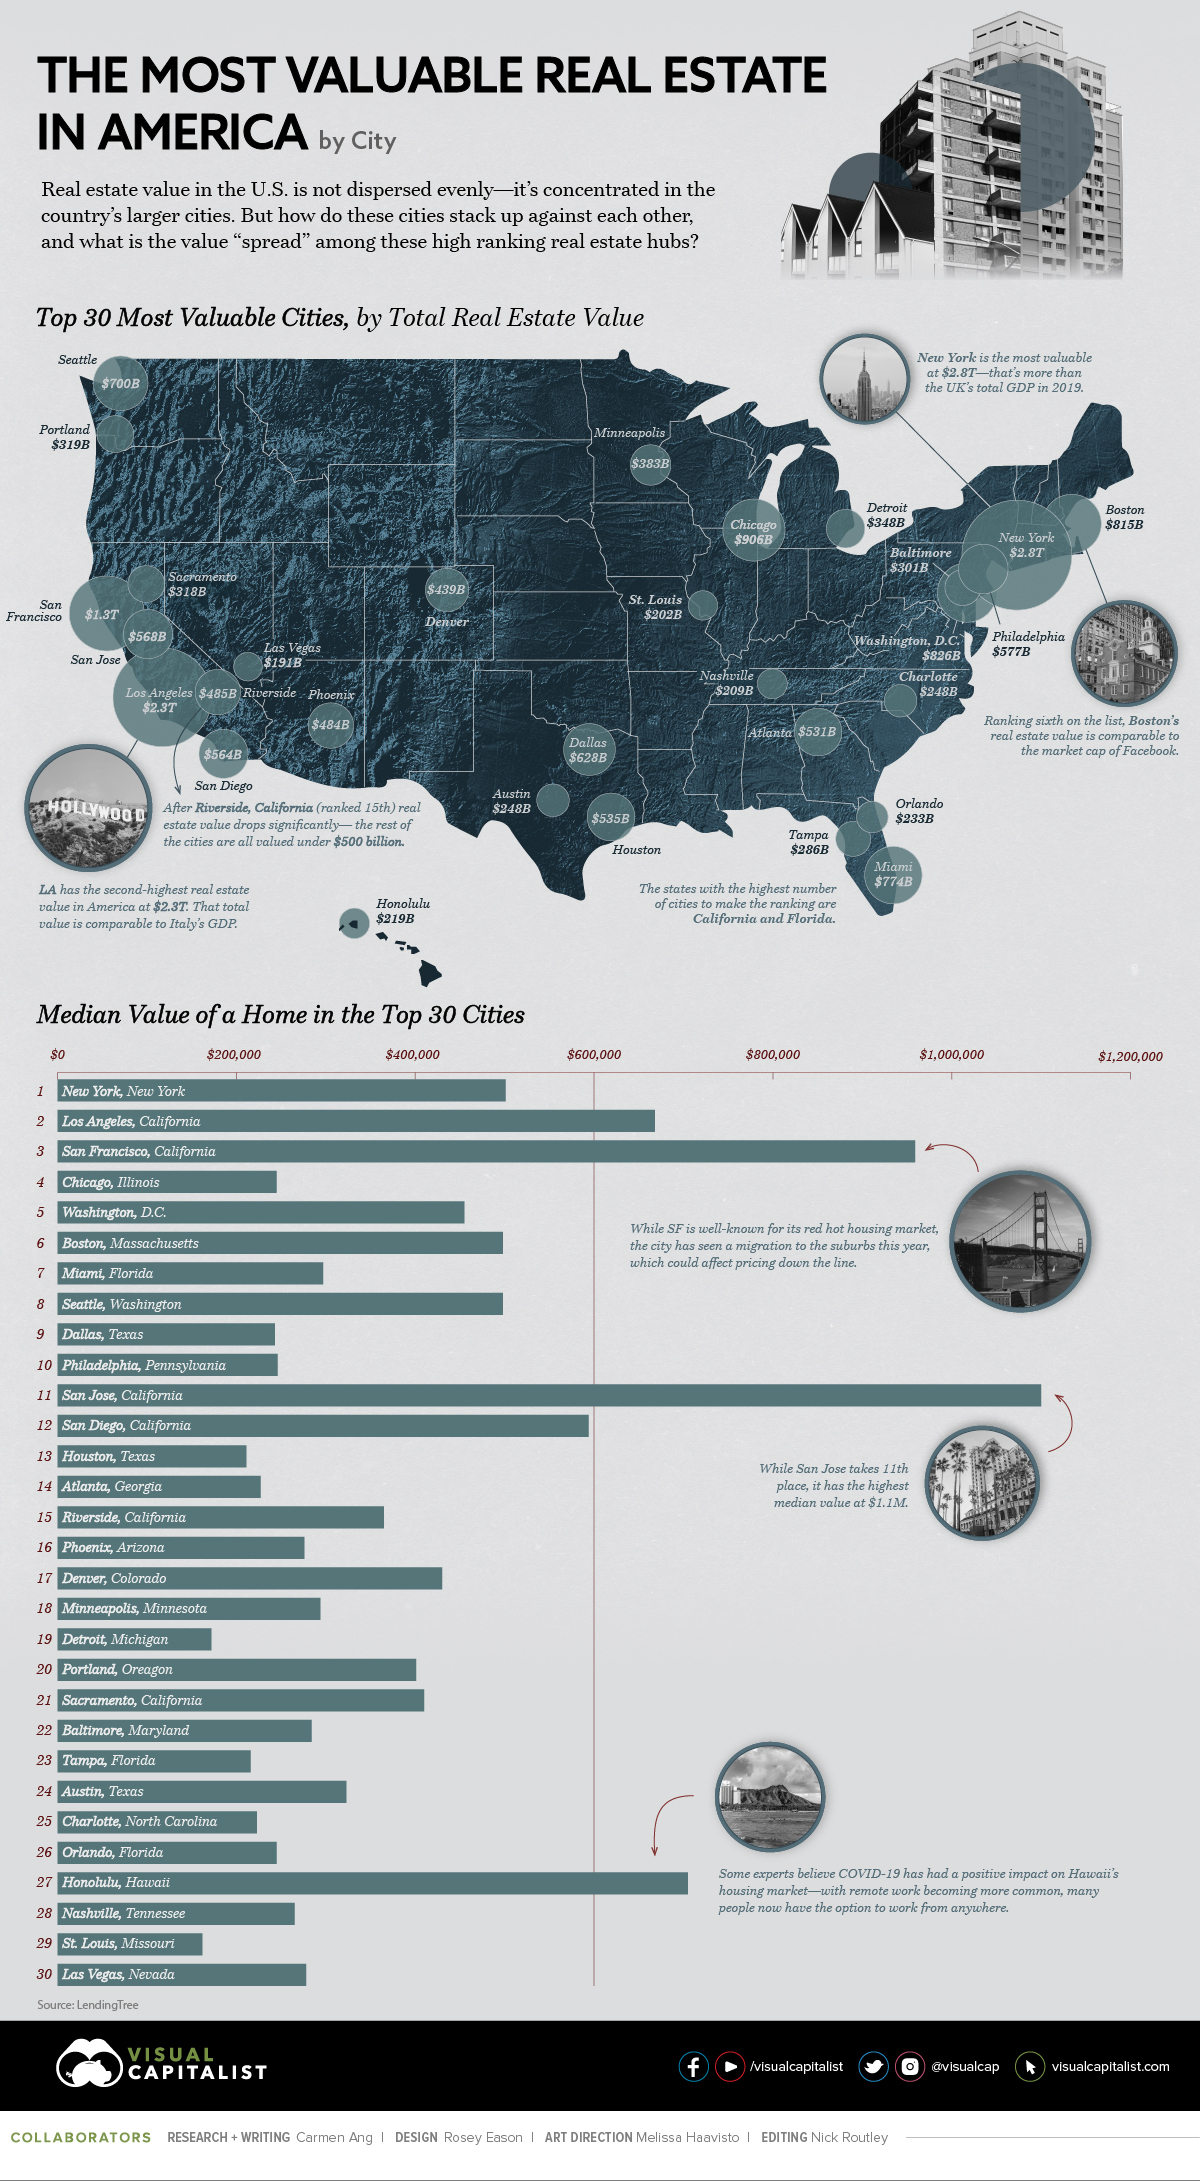
Using the latest data from LendingTree, this graphic ranks the top 30 most valuable real estate cities in America. We’ll also evaluate the top cities based on median value of homes, and how COVID-19 has impacted the market.
The Most Valuable Real Estate Cities
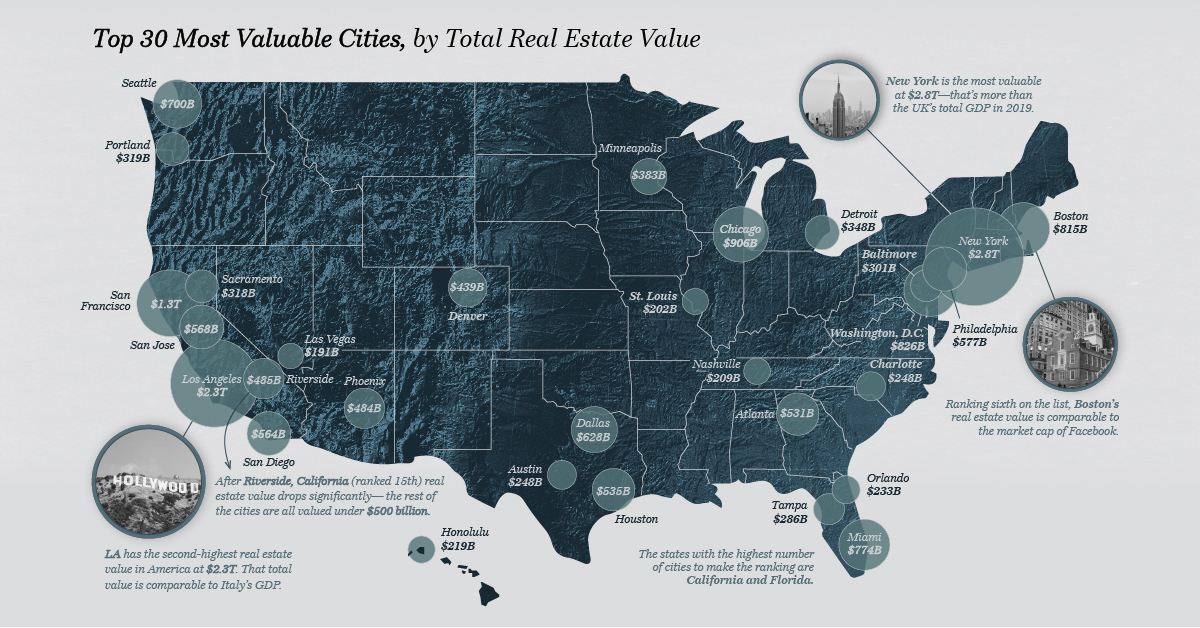
Out of the $32.6 trillion of total real estate value included in LendingTree’s database, the top 30 cities account for almost 57%:
| Rank | City | State | Total Value (in billions) |
|---|---|---|---|
| 1 | New York | New York | $2,838 |
| 2 | Los Angeles | California | $2,289 |
| 3 | San Francisco | California | $1,320 |
| 4 | Chicago | Illinois | $906 |
| 5 | Washington, D.C. | -- | $826 |
| 6 | Boston | Massachusetts | $815 |
| 7 | Miami | Florida | $774 |
| 8 | Seattle | Washington | $700 |
| 9 | Dallas | Texas | $628 |
| 10 | Philadelphia | Pennsylvania | $577 |
| 11 | San Jose, Calif. | California | $568 |
| 12 | San Diego | California | $564 |
| 13 | Houston | Texas | $535 |
| 14 | Atlanta | Georgia | $531 |
| 15 | Riverside, Calif. | California | $485 |
| 16 | Phoenix | Arizona | $484 |
| 17 | Denver | Colorado | $439 |
| 18 | Minneapolis | Minnesota | $383 |
| 19 | Detroit | Michigan | $348 |
| 20 | Portland, Ore. | Oregon | $319 |
| 21 | Sacramento, Calif. | California | $318 |
| 22 | Baltimore | Maryland | $301 |
| 23 | Tampa, Fla. | Florida | $286 |
| 24 | Austin, Texas | Texas | $248 |
| 25 | Charlotte, N.C | North Carolina | $248 |
| 26 | Orlando, Fla. | Florida | $233 |
| 27 | Honolulu | Hawaii | $219 |
| 28 | Nashville, Tenn. | Tennessee | $209 |
| 29 | St. Louis | Missouri | $202 |
| 30 | Las Vegas | Nevada | $191 |
New York has the highest real estate value in the country at $2.8 trillion—that’s around the size of the UK’s GDP in 2019. Close behind is Los Angeles at $2.3 trillion, while San Francisco ranks third at $1.3 trillion.
This may not come as a surprise, considering the popularity of these areas. New York and Los Angeles have the two highest city populations in the U.S., and San Francisco is the second most densely populated city in America (after New York). Historically, these areas have been notorious for their red-hot real estate markets, limited housing supply, and high costs of living.
However, while these cities take the top three spots when it comes to total real estate value, the ranking looks a bit different when comparing the median value of each city.
Most Valuable Cities, by Median Home Value
When it comes to median home value, San Jose claims the top spot at $1.1 million, while San Francisco places second at $959K:
| Rank | City | State | Median Value of a Home |
|---|---|---|---|
| 1 | San Jose | California | $1,100,000 |
| 2 | San Francisco | California | $959,000 |
| 3 | Honolulu | Hawaii | $705,000 |
| 4 | Los Angeles | California | $668,000 |
| 5 | San Diego | California | $594,000 |
| 6 | Oxnard | California | $586,000 |
| 7 | New York | New York | $501,000 |
| 8 | Boston | Massachusetts | $498,000 |
| 9 | Seattle | Washington | $498,000 |
| 10 | Washington, D.C. | -- | $455,000 |
| 11 | Denver | Colorado | $430,000 |
| 12 | Sacramento | California | $410,000 |
| 13 | Bridgeport | Connecticut | $410,000 |
| 14 | Portland | Oregon | $401,000 |
| 15 | Riverside | California | $365,000 |
| 16 | Naples | Florida | $329,000 |
| 17 | Austin | Texas | $323,000 |
| 18 | Salt Lake City | Utah | $312,000 |
| 19 | Providence | Rhode Island | $300,000 |
| 20 | Miami | Florida | $297,000 |
| 21 | Minneapolis | Minnesota | $294,000 |
| 22 | Baltimore | Maryland | $284,000 |
| 23 | Las Vegas | Nevada | $278,000 |
| 24 | Phoenix | Arizona | $276,000 |
| 25 | Raleigh | North Carolina | $271,000 |
| 26 | Nashville | Tennessee | $265,000 |
| 27 | Philadelphia | Pennsylvania | $246,000 |
| 28 | Chicago | Illinois | $245,000 |
| 29 | Orlando | Florida | $245,000 |
| 30 | North Port | Florida | $244,000 |
The Bay Area leads the pack in terms of median value, but San Francisco and San Jose aren’t the only Californian cities to make the list. In fact, half of the top 10 cities are in the Golden State.
Suburban Shuffle
It’s important to note that these numbers are from January 2020, before the global pandemic triggered numerous societal and economic changes, including an accelerated migration to the suburbs from key urban centers like New York and San Francisco.
This mass exodus has negatively impacted sales activity. In fall 2020, or example, home sales in New York dropped by 50% compared to last year.
In contrast, places like Honolulu have seen significant growth in home sales—in September 2020, single-family home sales rose by 12.7% compared to last year. Some experts believe COVID has been a key factor driving this growth, as more people are able to work from anywhere, thanks to remote work.


Markets
U.S. Debt Interest Payments Reach $1 Trillion
U.S. debt interest payments have surged past the $1 trillion dollar mark, amid high interest rates and an ever-expanding debt burden.


U.S. Debt Interest Payments Reach $1 Trillion
This was originally posted on our Voronoi app. Download the app for free on iOS or Android and discover incredible data-driven charts from a variety of trusted sources.
The cost of paying for America’s national debt crossed the $1 trillion dollar mark in 2023, driven by high interest rates and a record $34 trillion mountain of debt.
Over the last decade, U.S. debt interest payments have more than doubled amid vast government spending during the pandemic crisis. As debt payments continue to soar, the Congressional Budget Office (CBO) reported that debt servicing costs surpassed defense spending for the first time ever this year.
This graphic shows the sharp rise in U.S. debt payments, based on data from the Federal Reserve.
A $1 Trillion Interest Bill, and Growing
Below, we show how U.S. debt interest payments have risen at a faster pace than at another time in modern history:
| Date | Interest Payments | U.S. National Debt |
|---|---|---|
| 2023 | $1.0T | $34.0T |
| 2022 | $830B | $31.4T |
| 2021 | $612B | $29.6T |
| 2020 | $518B | $27.7T |
| 2019 | $564B | $23.2T |
| 2018 | $571B | $22.0T |
| 2017 | $493B | $20.5T |
| 2016 | $460B | $20.0T |
| 2015 | $435B | $18.9T |
| 2014 | $442B | $18.1T |
| 2013 | $425B | $17.2T |
| 2012 | $417B | $16.4T |
| 2011 | $433B | $15.2T |
| 2010 | $400B | $14.0T |
| 2009 | $354B | $12.3T |
| 2008 | $380B | $10.7T |
| 2007 | $414B | $9.2T |
| 2006 | $387B | $8.7T |
| 2005 | $355B | $8.2T |
| 2004 | $318B | $7.6T |
| 2003 | $294B | $7.0T |
| 2002 | $298B | $6.4T |
| 2001 | $318B | $5.9T |
| 2000 | $353B | $5.7T |
| 1999 | $353B | $5.8T |
| 1998 | $360B | $5.6T |
| 1997 | $368B | $5.5T |
| 1996 | $362B | $5.3T |
| 1995 | $357B | $5.0T |
| 1994 | $334B | $4.8T |
| 1993 | $311B | $4.5T |
| 1992 | $306B | $4.2T |
| 1991 | $308B | $3.8T |
| 1990 | $298B | $3.4T |
| 1989 | $275B | $3.0T |
| 1988 | $254B | $2.7T |
| 1987 | $240B | $2.4T |
| 1986 | $225B | $2.2T |
| 1985 | $219B | $1.9T |
| 1984 | $205B | $1.7T |
| 1983 | $176B | $1.4T |
| 1982 | $157B | $1.2T |
| 1981 | $142B | $1.0T |
| 1980 | $113B | $930.2B |
| 1979 | $96B | $845.1B |
| 1978 | $84B | $789.2B |
| 1977 | $69B | $718.9B |
| 1976 | $61B | $653.5B |
| 1975 | $55B | $576.6B |
| 1974 | $50B | $492.7B |
| 1973 | $45B | $469.1B |
| 1972 | $39B | $448.5B |
| 1971 | $36B | $424.1B |
| 1970 | $35B | $389.2B |
| 1969 | $30B | $368.2B |
| 1968 | $25B | $358.0B |
| 1967 | $23B | $344.7B |
| 1966 | $21B | $329.3B |
Interest payments represent seasonally adjusted annual rate at the end of Q4.
At current rates, the U.S. national debt is growing by a remarkable $1 trillion about every 100 days, equal to roughly $3.6 trillion per year.
As the national debt has ballooned, debt payments even exceeded Medicaid outlays in 2023—one of the government’s largest expenditures. On average, the U.S. spent more than $2 billion per day on interest costs last year. Going further, the U.S. government is projected to spend a historic $12.4 trillion on interest payments over the next decade, averaging about $37,100 per American.
Exacerbating matters is that the U.S. is running a steep deficit, which stood at $1.1 trillion for the first six months of fiscal 2024. This has accelerated due to the 43% increase in debt servicing costs along with a $31 billion dollar increase in defense spending from a year earlier. Additionally, a $30 billion increase in funding for the Federal Deposit Insurance Corporation in light of the regional banking crisis last year was a major contributor to the deficit increase.
Overall, the CBO forecasts that roughly 75% of the federal deficit’s increase will be due to interest costs by 2034.

-

 Mining2 weeks ago
Charted: The Value Gap Between the Gold Price and Gold Miners
-

 Real Estate1 week ago
Ranked: The Most Valuable Housing Markets in America
-

 Markets1 week ago
Charted: Big Four Market Share by S&P 500 Audits
-

 AI1 week ago
The Stock Performance of U.S. Chipmakers So Far in 2024
-

 Automotive1 week ago
Almost Every EV Stock is Down After Q1 2024
-

 Money2 weeks ago
Where Does One U.S. Tax Dollar Go?
-

 Green2 weeks ago
Ranked: Top Countries by Total Forest Loss Since 2001
-

 Markets2 weeks ago
Visualizing America’s Shortage of Affordable Homes