Datastream
Ranked: The Revenue Impact of U.S. Tax Hikes


The Briefing
- Tax increases backing the American Jobs and Families Plan are expected to exceed 1% of U.S. GDP
- Only 3 tax increases in U.S. history have ever equaled or exceeded 1% of GDP
- The infrastructure plans will require 15 years of higher taxes on corporations to fund 8 years of spending
Ranked: The Revenue Impact of U.S. Tax Bills
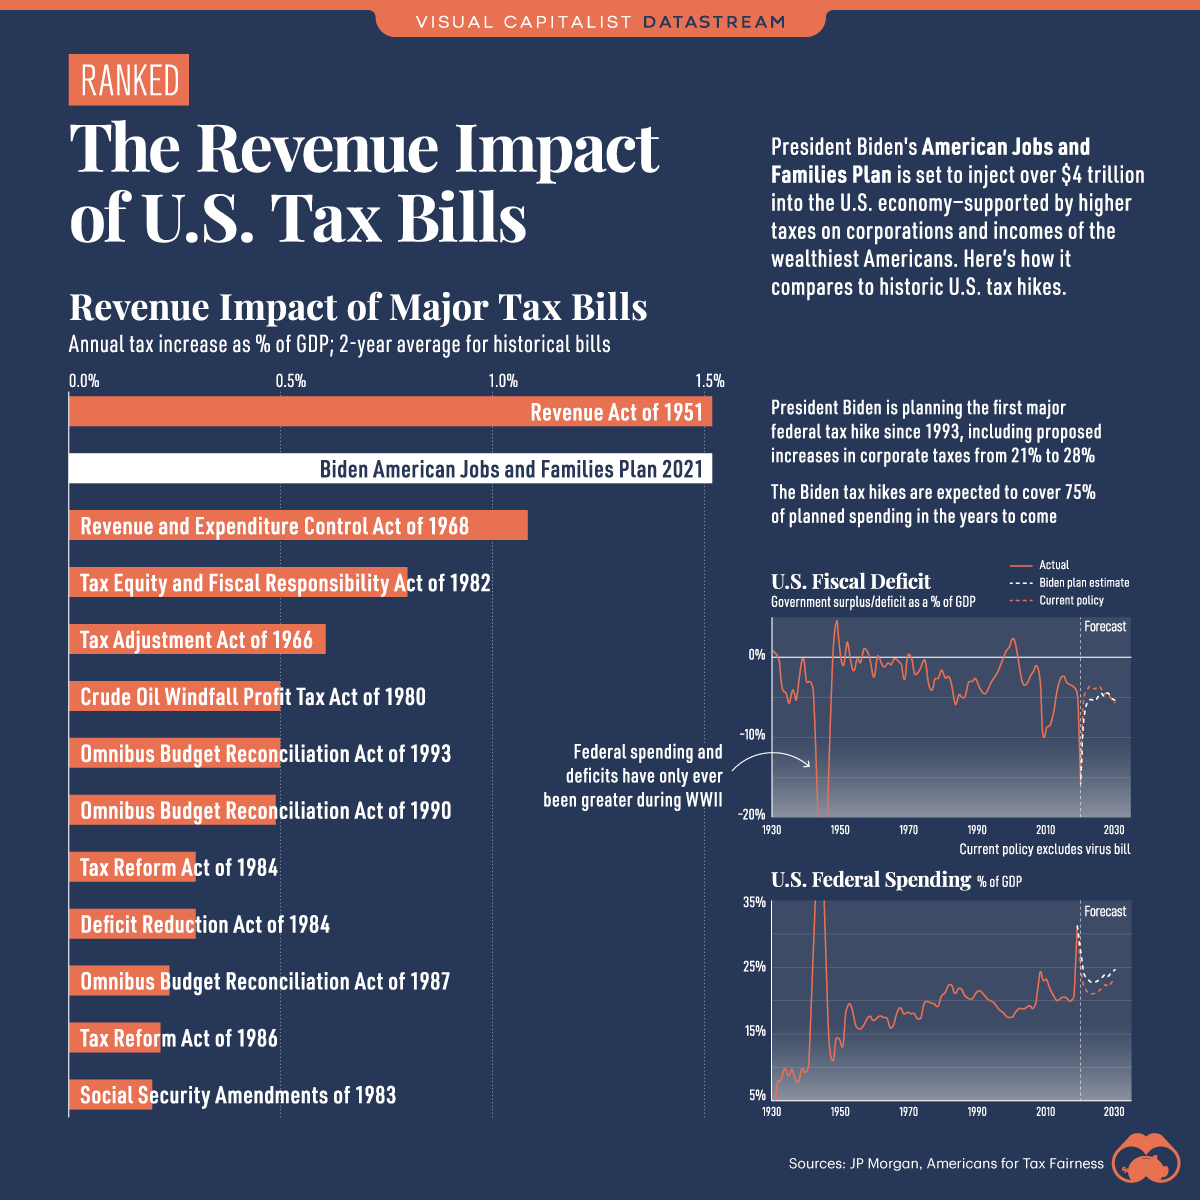
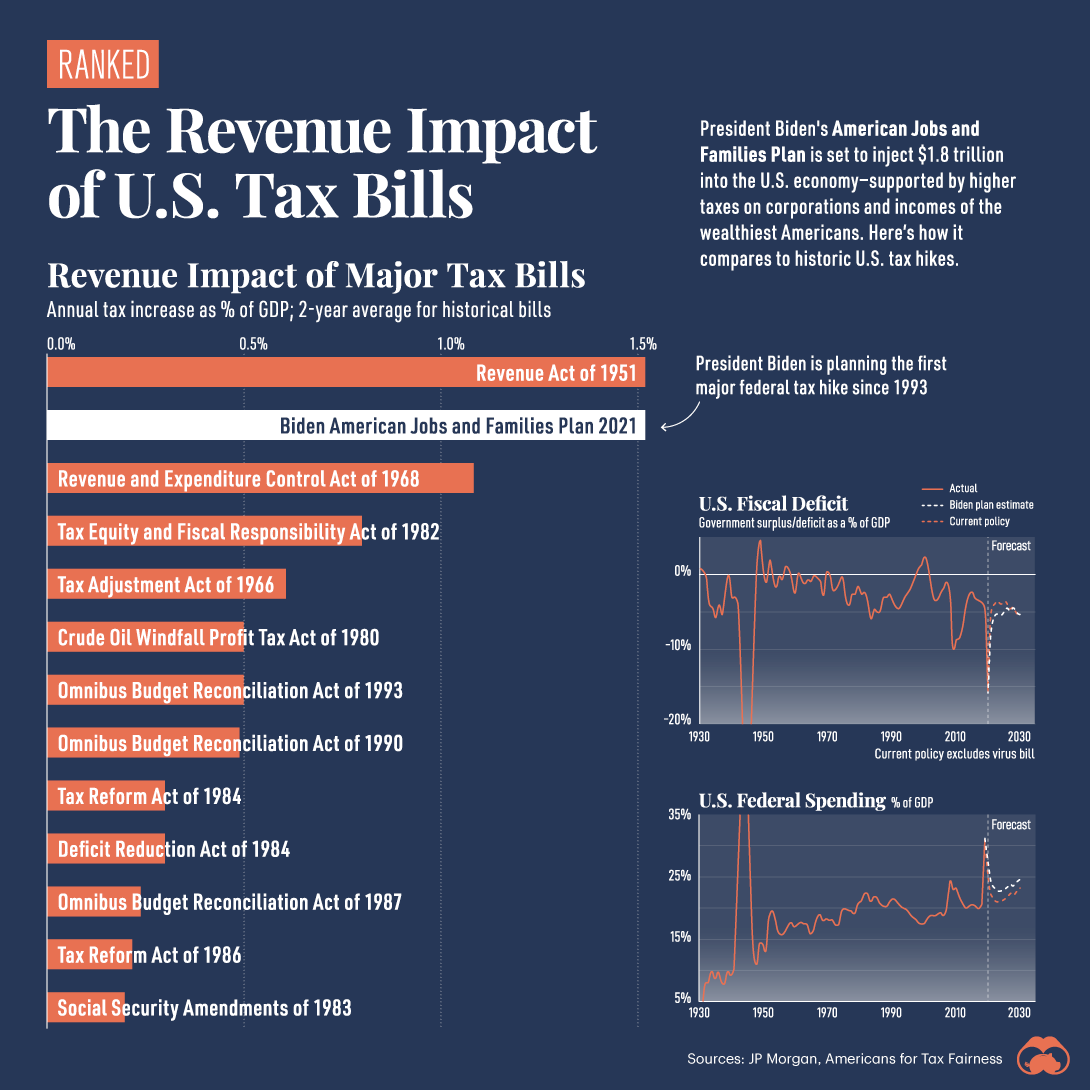
The United States is opening up its wallet and writing some serious checks under the Joe Biden administration. The American Jobs Plan and the American Families Plan are expected to cost a combined $3.2 trillion in total taxpayer dollars. For comparison, the federal government spent slightly more than $6.5 trillion across all of 2020.
In order to foot the bill, tax hikes will roll out for corporations and the ultra-wealthy.
A History of Tax Hikes
But how do these present tax hikes compare to those of the past?
When comparing the estimated increase in tax revenue as a percentage of GDP, the Biden tax hikes fall on par with the Revenue Act of 1951 under Harry Truman, for the greatest tax increases—1.5% of GDP.
Within both tax bills, corporate and high personal incomes were key targets. But while the Revenue Act of 1951 saw a 5% increase on corporate taxes, Biden tax hikes are pushing for a steeper 7% spike from 21% to 28%. Prior to the Trump administration, corporate taxes were at the 35% level.
Here’s how those corporate tax increases would compare amongst some OECD countries:
| OECD Country | Corporate Tax Rate |
|---|---|
| 🇦🇺 Australia | 30.0% |
| 🇫🇷 France | 28.4% |
| 🇺🇸 U.S. | 28.0% |
| 🇰🇷 South Korea | 25.0% |
| 🇪🇸 Spain | 25.0% |
| 🇮🇹 Italy | 24.0% |
| 🇬🇧 UK | 19.0% |
| 🇩🇪 Germany | 15.8% |
| 🇨🇦 Canada | 15.0% |
| 🇮🇪 Ireland | 12.5% |
Overall, tax increases in U.S. history appear to be fairly modest, as only three have ever generated revenue as high as 1% of GDP. The third biggest increase of all-time, the Revenue and Expenditure Control Act of 1968 under Lyndon B. Johnson, saw:
- Temporary 10% income tax surcharge on individuals through 1969
- Temporary 10% income tax surcharge on corporations through 1969
- Delayed scheduled reduction in telephone and automobile excise taxes
Unprecedented Spending
With the exception of WWII, federal spending and deficits as a percentage of GDP is already at unprecedented levels.
In fact, federal spending today is equivalent to 30% of GDP, and is estimated to be closer to 25% by the year 2030. Moreover, in raw dollars, total federal debt now stands at an unprecedented $28 trillion dollars.
Where does this data come from?
Source: JP Morgan
Notes: Joe Biden tax bill increases are estimates which may vary from future figures


Datastream
Can You Calculate Your Daily Carbon Footprint?
Discover how the average person’s carbon footprint impacts the environment and learn how carbon credits can offset your carbon footprint.


The Briefing
- A person’s carbon footprint is substantial, with activities such as food consumption creating as much as 4,500 g of CO₂ emissions daily.
- By purchasing carbon credits from Carbon Streaming Corporation, you can offset your own emissions and fund positive climate action.
Your Everyday Carbon Footprint
While many large businesses and countries have committed to net-zero goals, it is essential to acknowledge that your everyday activities also contribute to global emissions.
In this graphic, sponsored by Carbon Streaming Corporation, we will explore how the choices we make and the products we use have a profound impact on our carbon footprint.
Carbon Emissions by Activity
Here are some of the daily activities and products of the average person and their carbon footprint, according to Clever Carbon.
| Household Activities & Products | CO2 Emissions (g) |
|---|---|
| 💡 Standard Light Bulb (100 watts, four hours) | 172 g |
| 📱 Mobile Phone Use (195 minutes per day)* | 189 g |
| 👕 Washing Machine (0.63 kWh) | 275 g |
| 🔥 Electric Oven (1.56 kWh) | 675 g |
| ♨️ Tumble Dryer (2.5 kWh) | 1,000 g |
| 🧻 Toilet Roll (2 ply) | 1,300 g |
| 🚿 Hot Shower (10 mins) | 2,000 g |
| 🚙 Daily Commute (one hour, by car) | 3,360 g |
| 🍽️ Average Daily Food Consumption (three meals of 600 calories) | 4,500 g |
| *Phone use based on yearly use of 69kg per the source, Reboxed | |
Your choice of transportation plays a crucial role in determining your carbon footprint. For instance, a 15 km daily commute to work on public transport generates an average of 1,464 g of CO₂ emissions. Compared to 3,360 g—twice the volume for a journey the same length by car.
By opting for more sustainable modes of transport, such as cycling, walking, or public transportation, you can significantly reduce your carbon footprint.
Addressing Your Carbon Footprint
One way to compensate for your emissions is by purchasing high-quality carbon credits.
Carbon credits are used to help fund projects that avoid, reduce or remove CO₂ emissions. This includes nature-based solutions such as reforestation and improved forest management, or technology-based solutions such as the production of biochar and carbon capture and storage (CCS).
While carbon credits offer a potential solution for individuals to help reduce global emissions, public awareness remains a significant challenge. A BCG-Patch survey revealed that only 34% of U.S. consumers are familiar with carbon credits, and only 3% have purchased them in the past.
About Carbon Streaming
By financing the creation or expansion of carbon projects, Carbon Streaming Corporation secures the rights to future carbon credits generated by these sustainable projects. You can then purchase these carbon credits to help fund climate solutions around the world and compensate for your own emissions.
Ready to get involved?
>> Learn more about purchasing carbon credits at Carbon Streaming

-

 Science1 week ago
Visualizing the Average Lifespans of Mammals
-

 Markets2 weeks ago
The Top 10 States by Real GDP Growth in 2023
-

 Demographics2 weeks ago
The Smallest Gender Wage Gaps in OECD Countries
-

 United States2 weeks ago
Where U.S. Inflation Hit the Hardest in March 2024
-

 Green2 weeks ago
Top Countries By Forest Growth Since 2001
-

 United States2 weeks ago
Ranked: The Largest U.S. Corporations by Number of Employees
-

 Maps2 weeks ago
The Largest Earthquakes in the New York Area (1970-2024)
-

 Green2 weeks ago
Ranked: The Countries With the Most Air Pollution in 2023